Why plan
Freedom is priced in years, not in rupees.
The goal is not to stop working; it is to stop needing to. Whether you get there is decided less by how clever your investments are than by whether the plan priced inflation, healthcare, the order of the returns and the country you will live in honestly — thirty years before any of it comes due.
18 years
for prices to double at 4% a year — the rate India’s central bank targets — and they never give the ground back
₹3.24 L
what ₹1,00,000 of spending a month costs in thirty years at that same 4%. Same rent, same groceries, same life
2.5×–5.5×
how much faster medical costs compound than general prices, across all eleven markets. Japan is the mildest, Singapore the sharpest
25×
your annual spending — what a 4% withdrawal rate actually implies. It was derived from one country, one currency and one period
FIRE, read correctly
Two letters do the work, and they are not the ones people repeat.
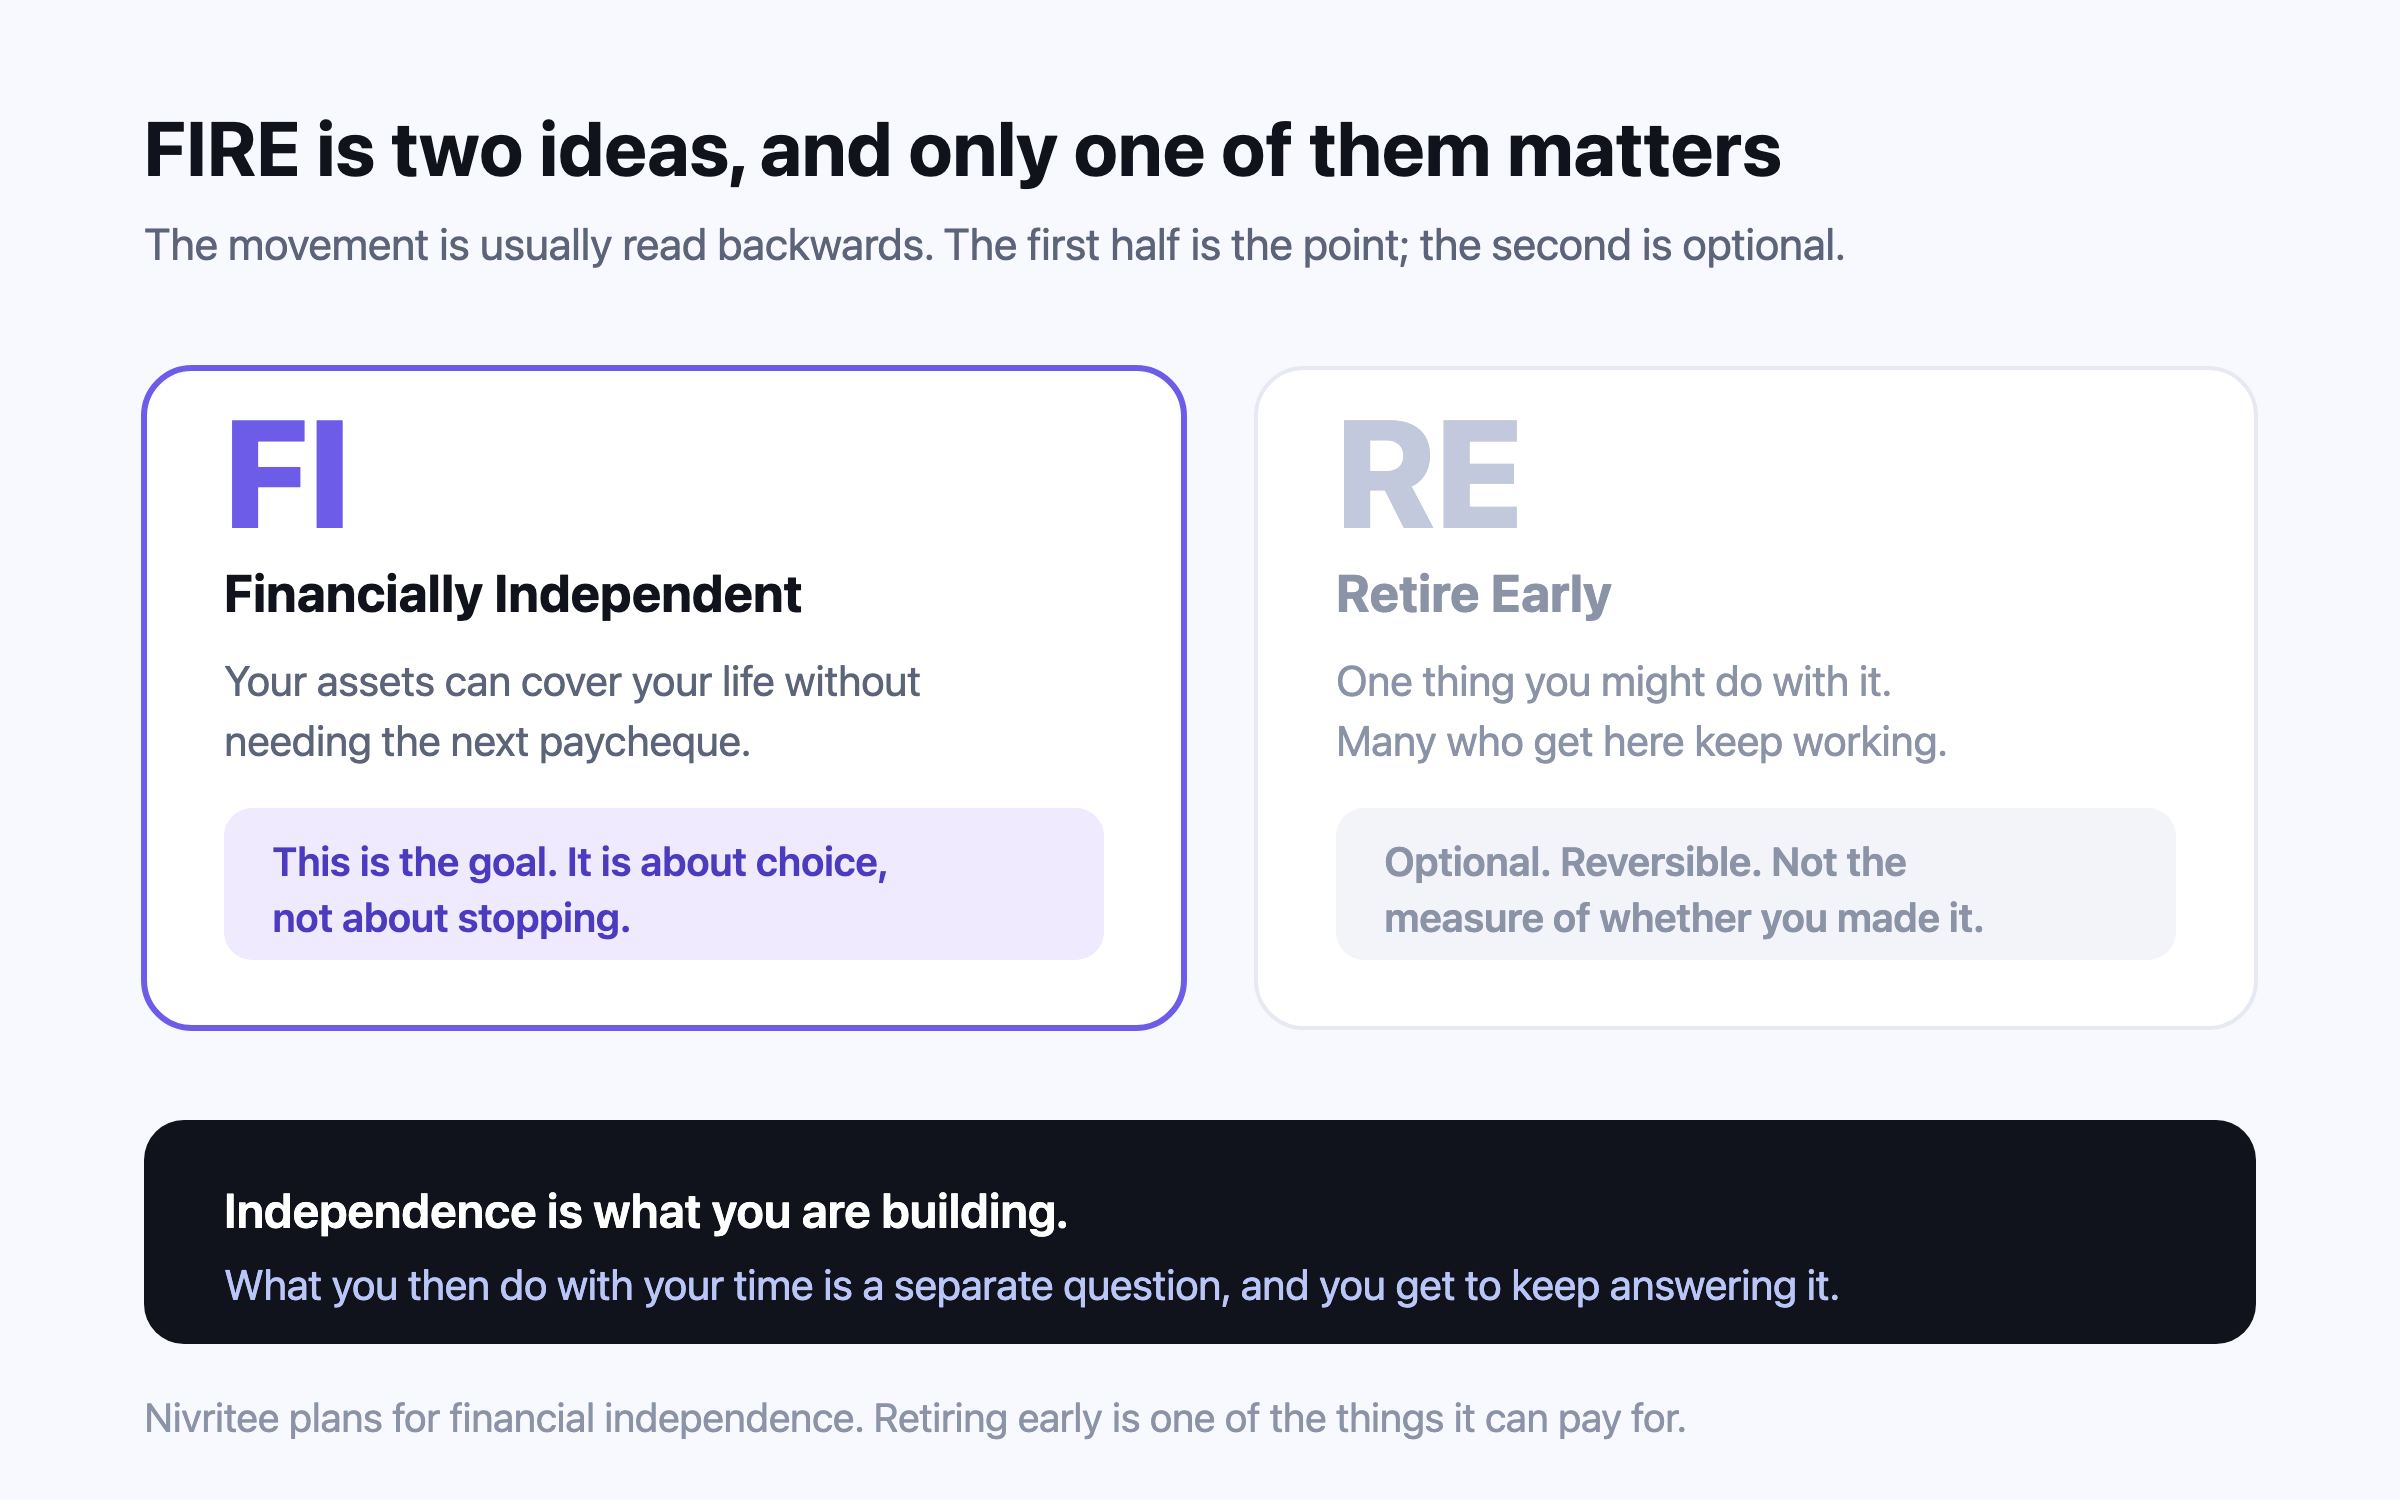
FI is the achievement: the point where what you own can carry what you spend, without the next payslip. RE is one option it unlocks, and it is optional, reversible, and not the measure of whether you made it.
Read that way the goal stops being a date and becomes a threshold — which is a much better thing to plan toward, because you can be halfway to it and know exactly how far.
What it buys
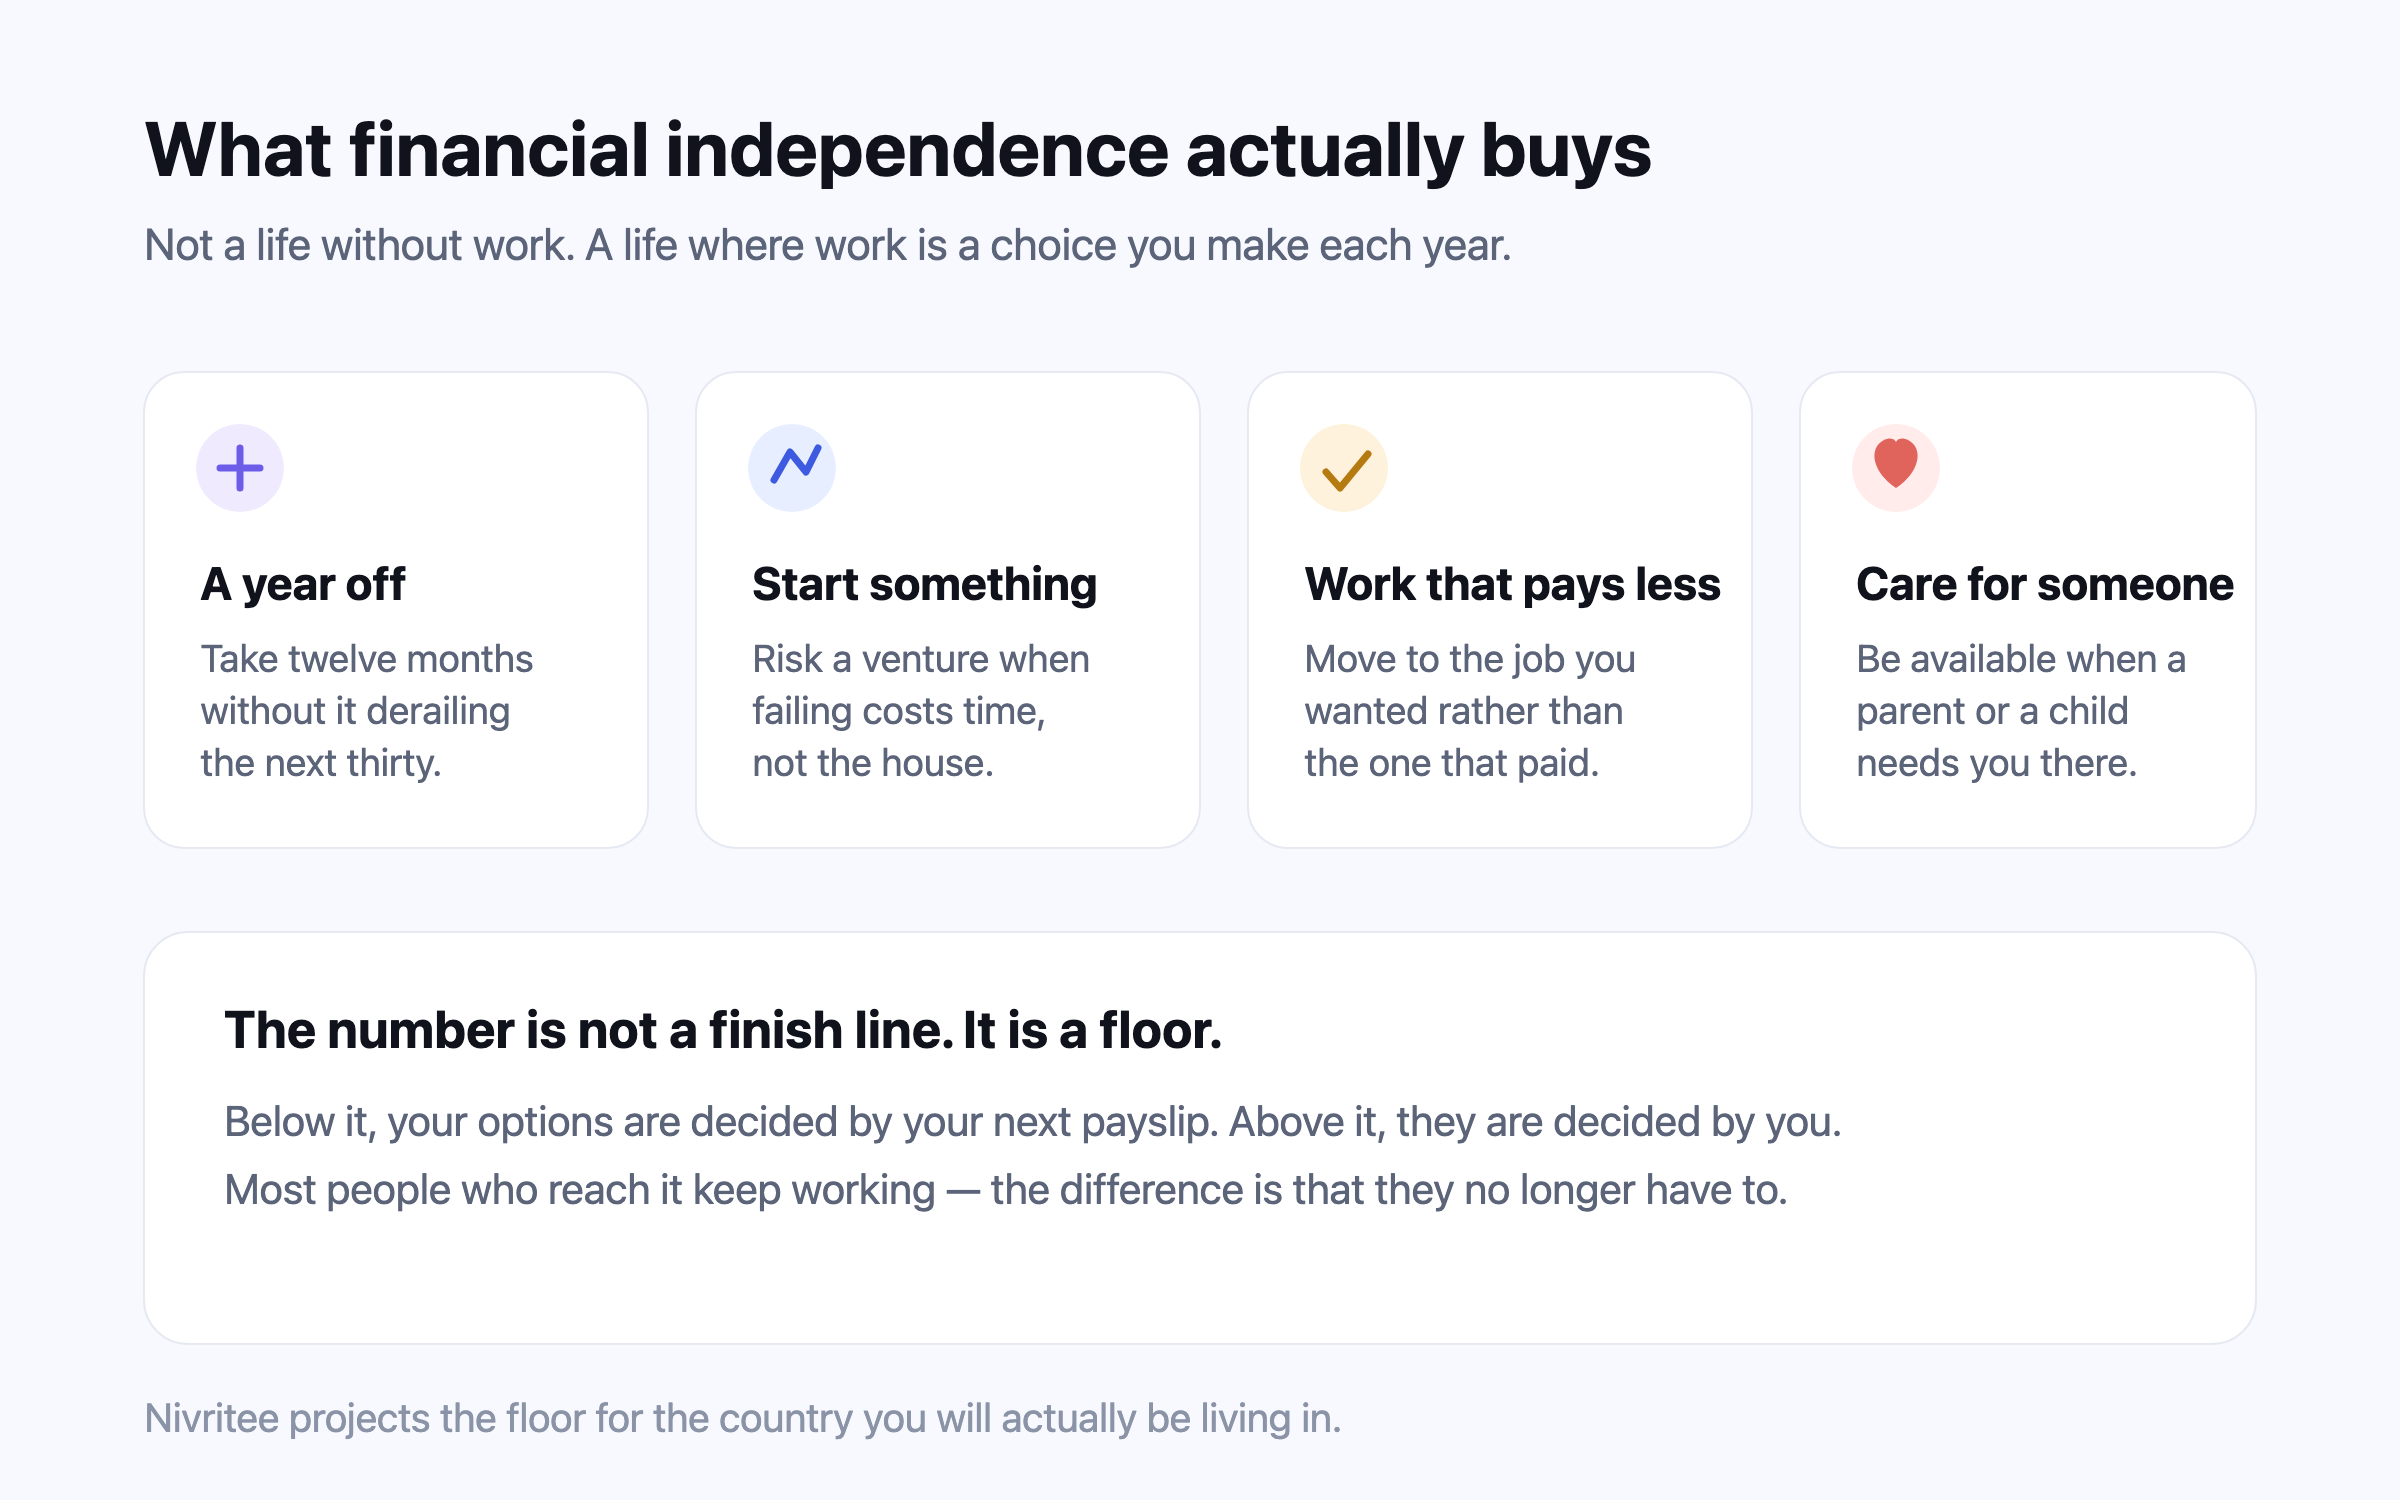
Independence is optionality, priced in years.
A year off that does not derail the next thirty. A venture where failing costs time rather than the house. Work you would choose at a salary you would not have. Being there when a parent or a child needs you.
None of that requires stopping. It requires a floor — and below the floor your options are set by your next payslip, while above it they are set by you.
Why now
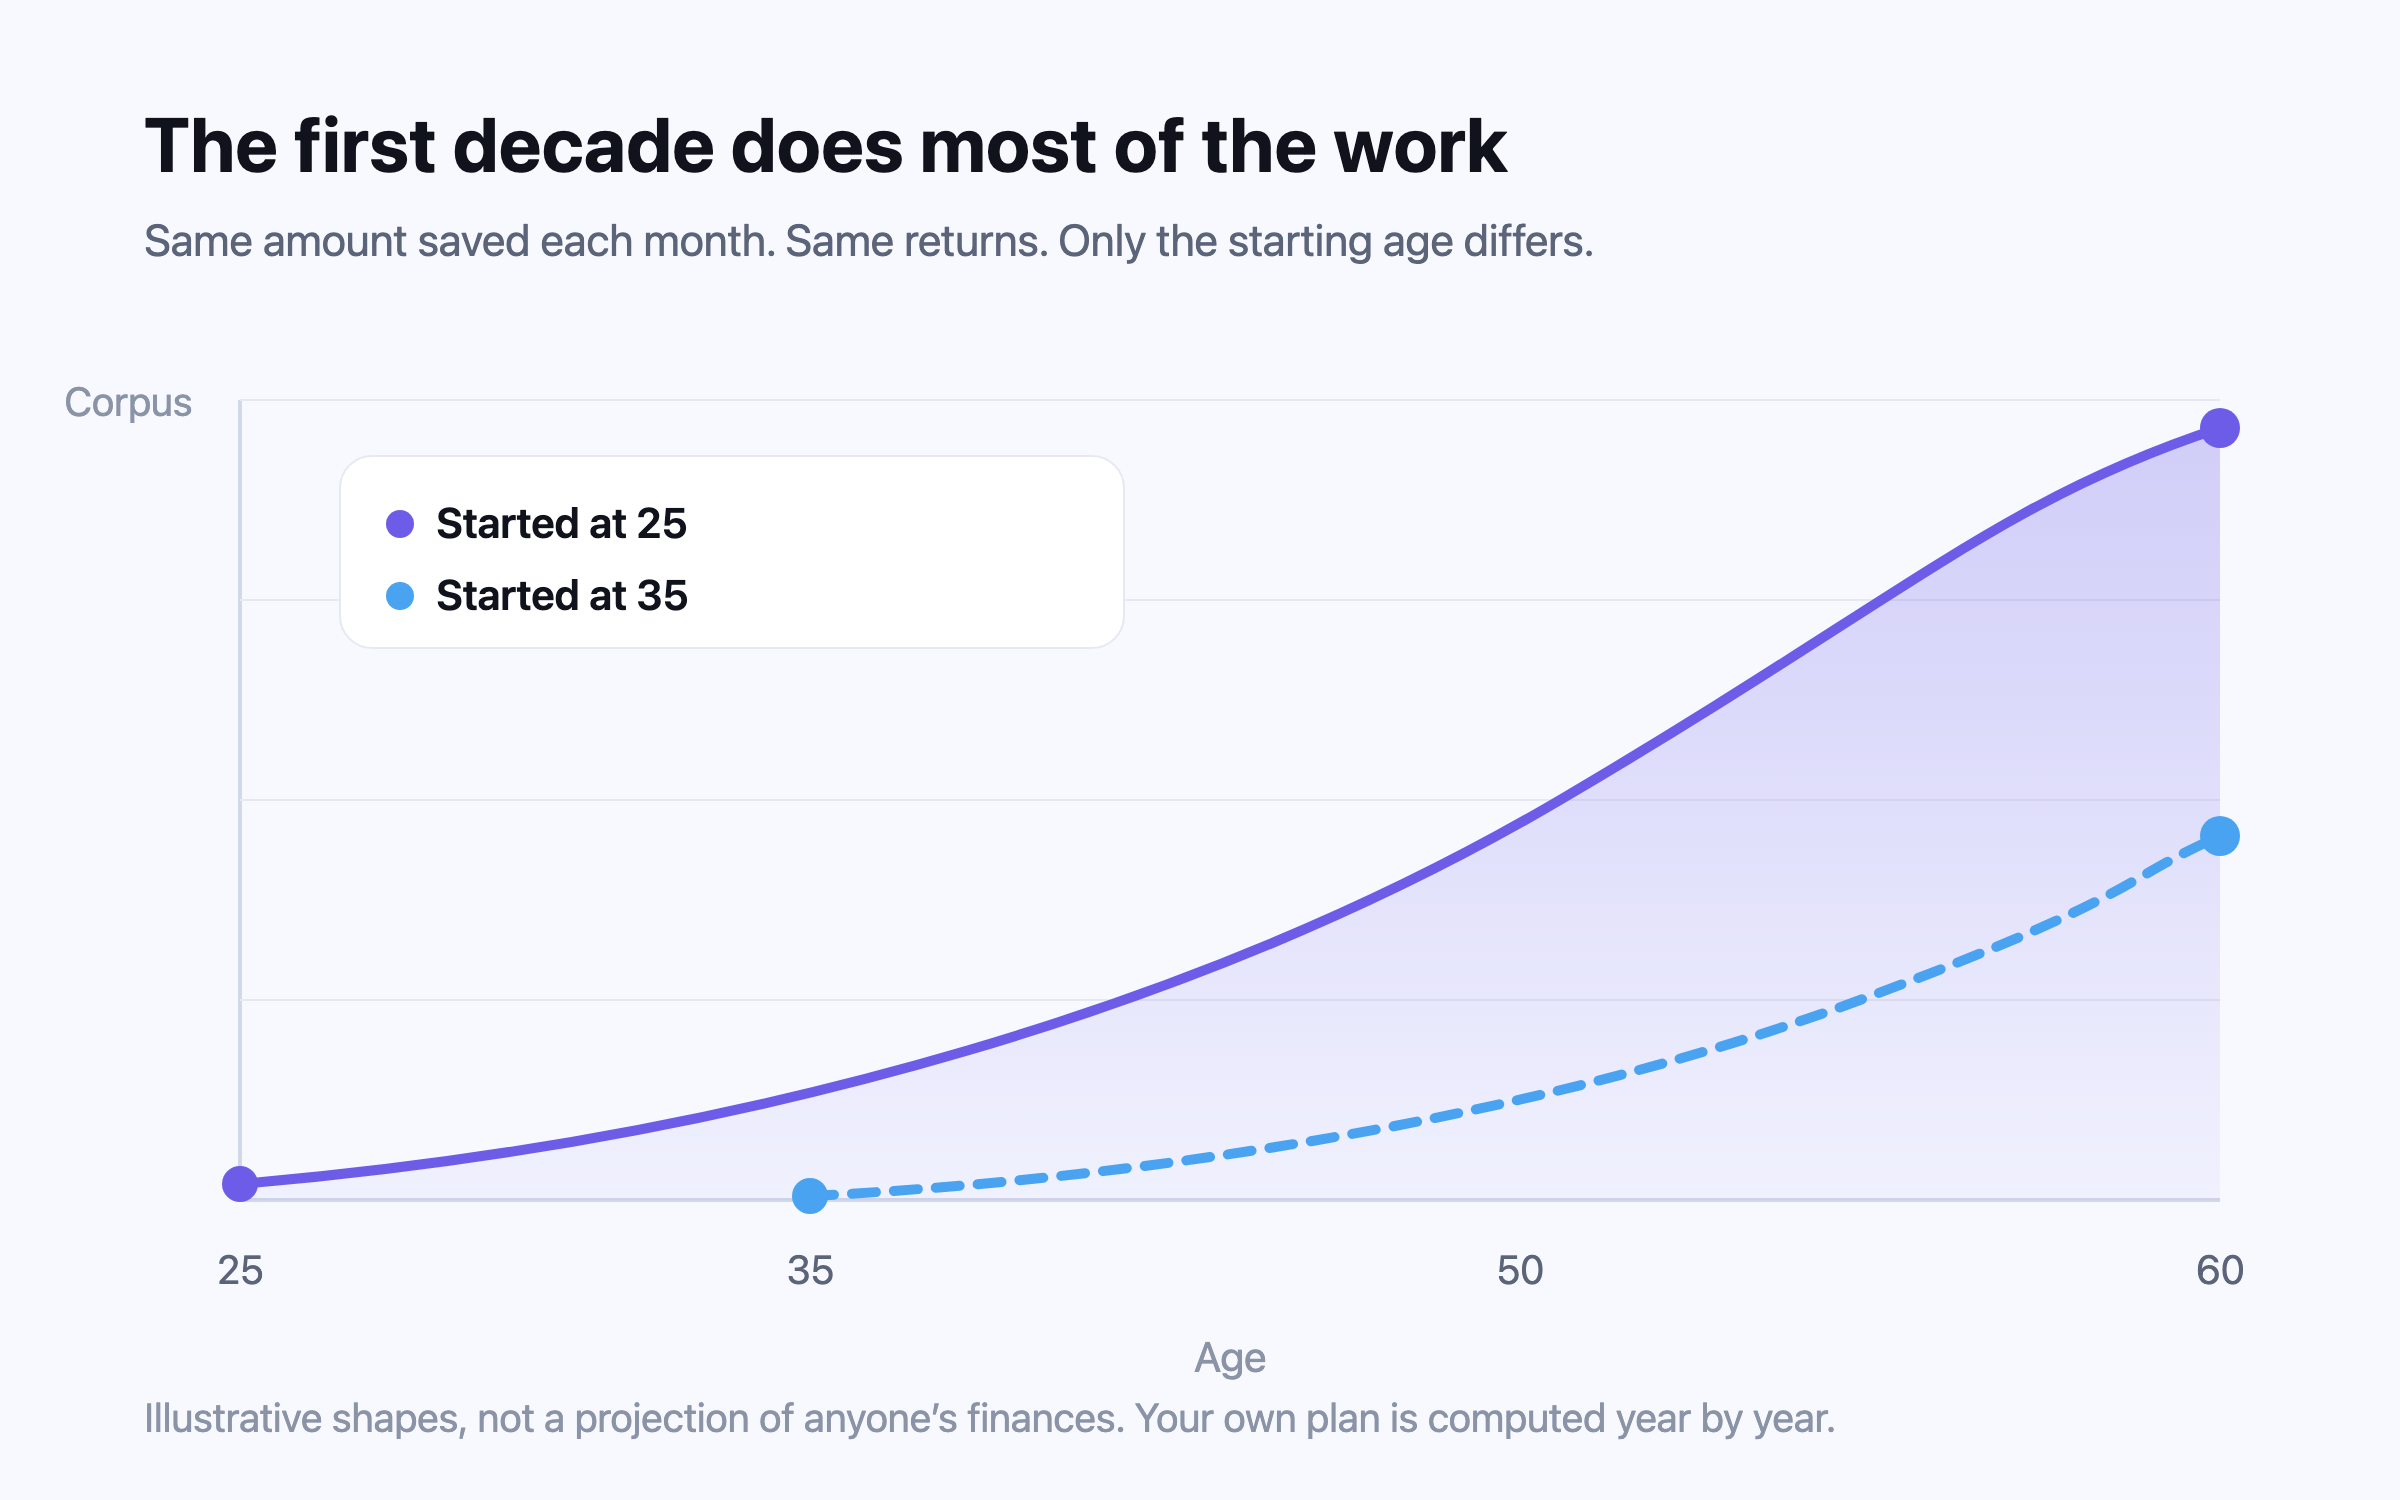
The first decade does most of the work.
Two people saving the same amount at the same return, ten years apart, do not end ten years apart. The gap widens the whole way, because the earlier money spends longer compounding on itself.
Which is why the useful question is not “how much should I save?” but “what does my plan look like if I start now, and how much worse is it if I start in five years?” That is a projection, and it takes about two minutes.
Where money sits
Different assets do different jobs.
Equities are the growth engine and the thing that falls hardest in a bad year. Deposits and provident funds are the buffer against a fall arriving early in drawdown. Statutory schemes are usually tax-favoured and usually locked until a set age.
That is the argument behind the Freedom Ladder: money you need next month and money you need in twenty years should not sit in the same thing, and the home you live in is somewhere to live, not a withdrawal.
The four rungs, explained →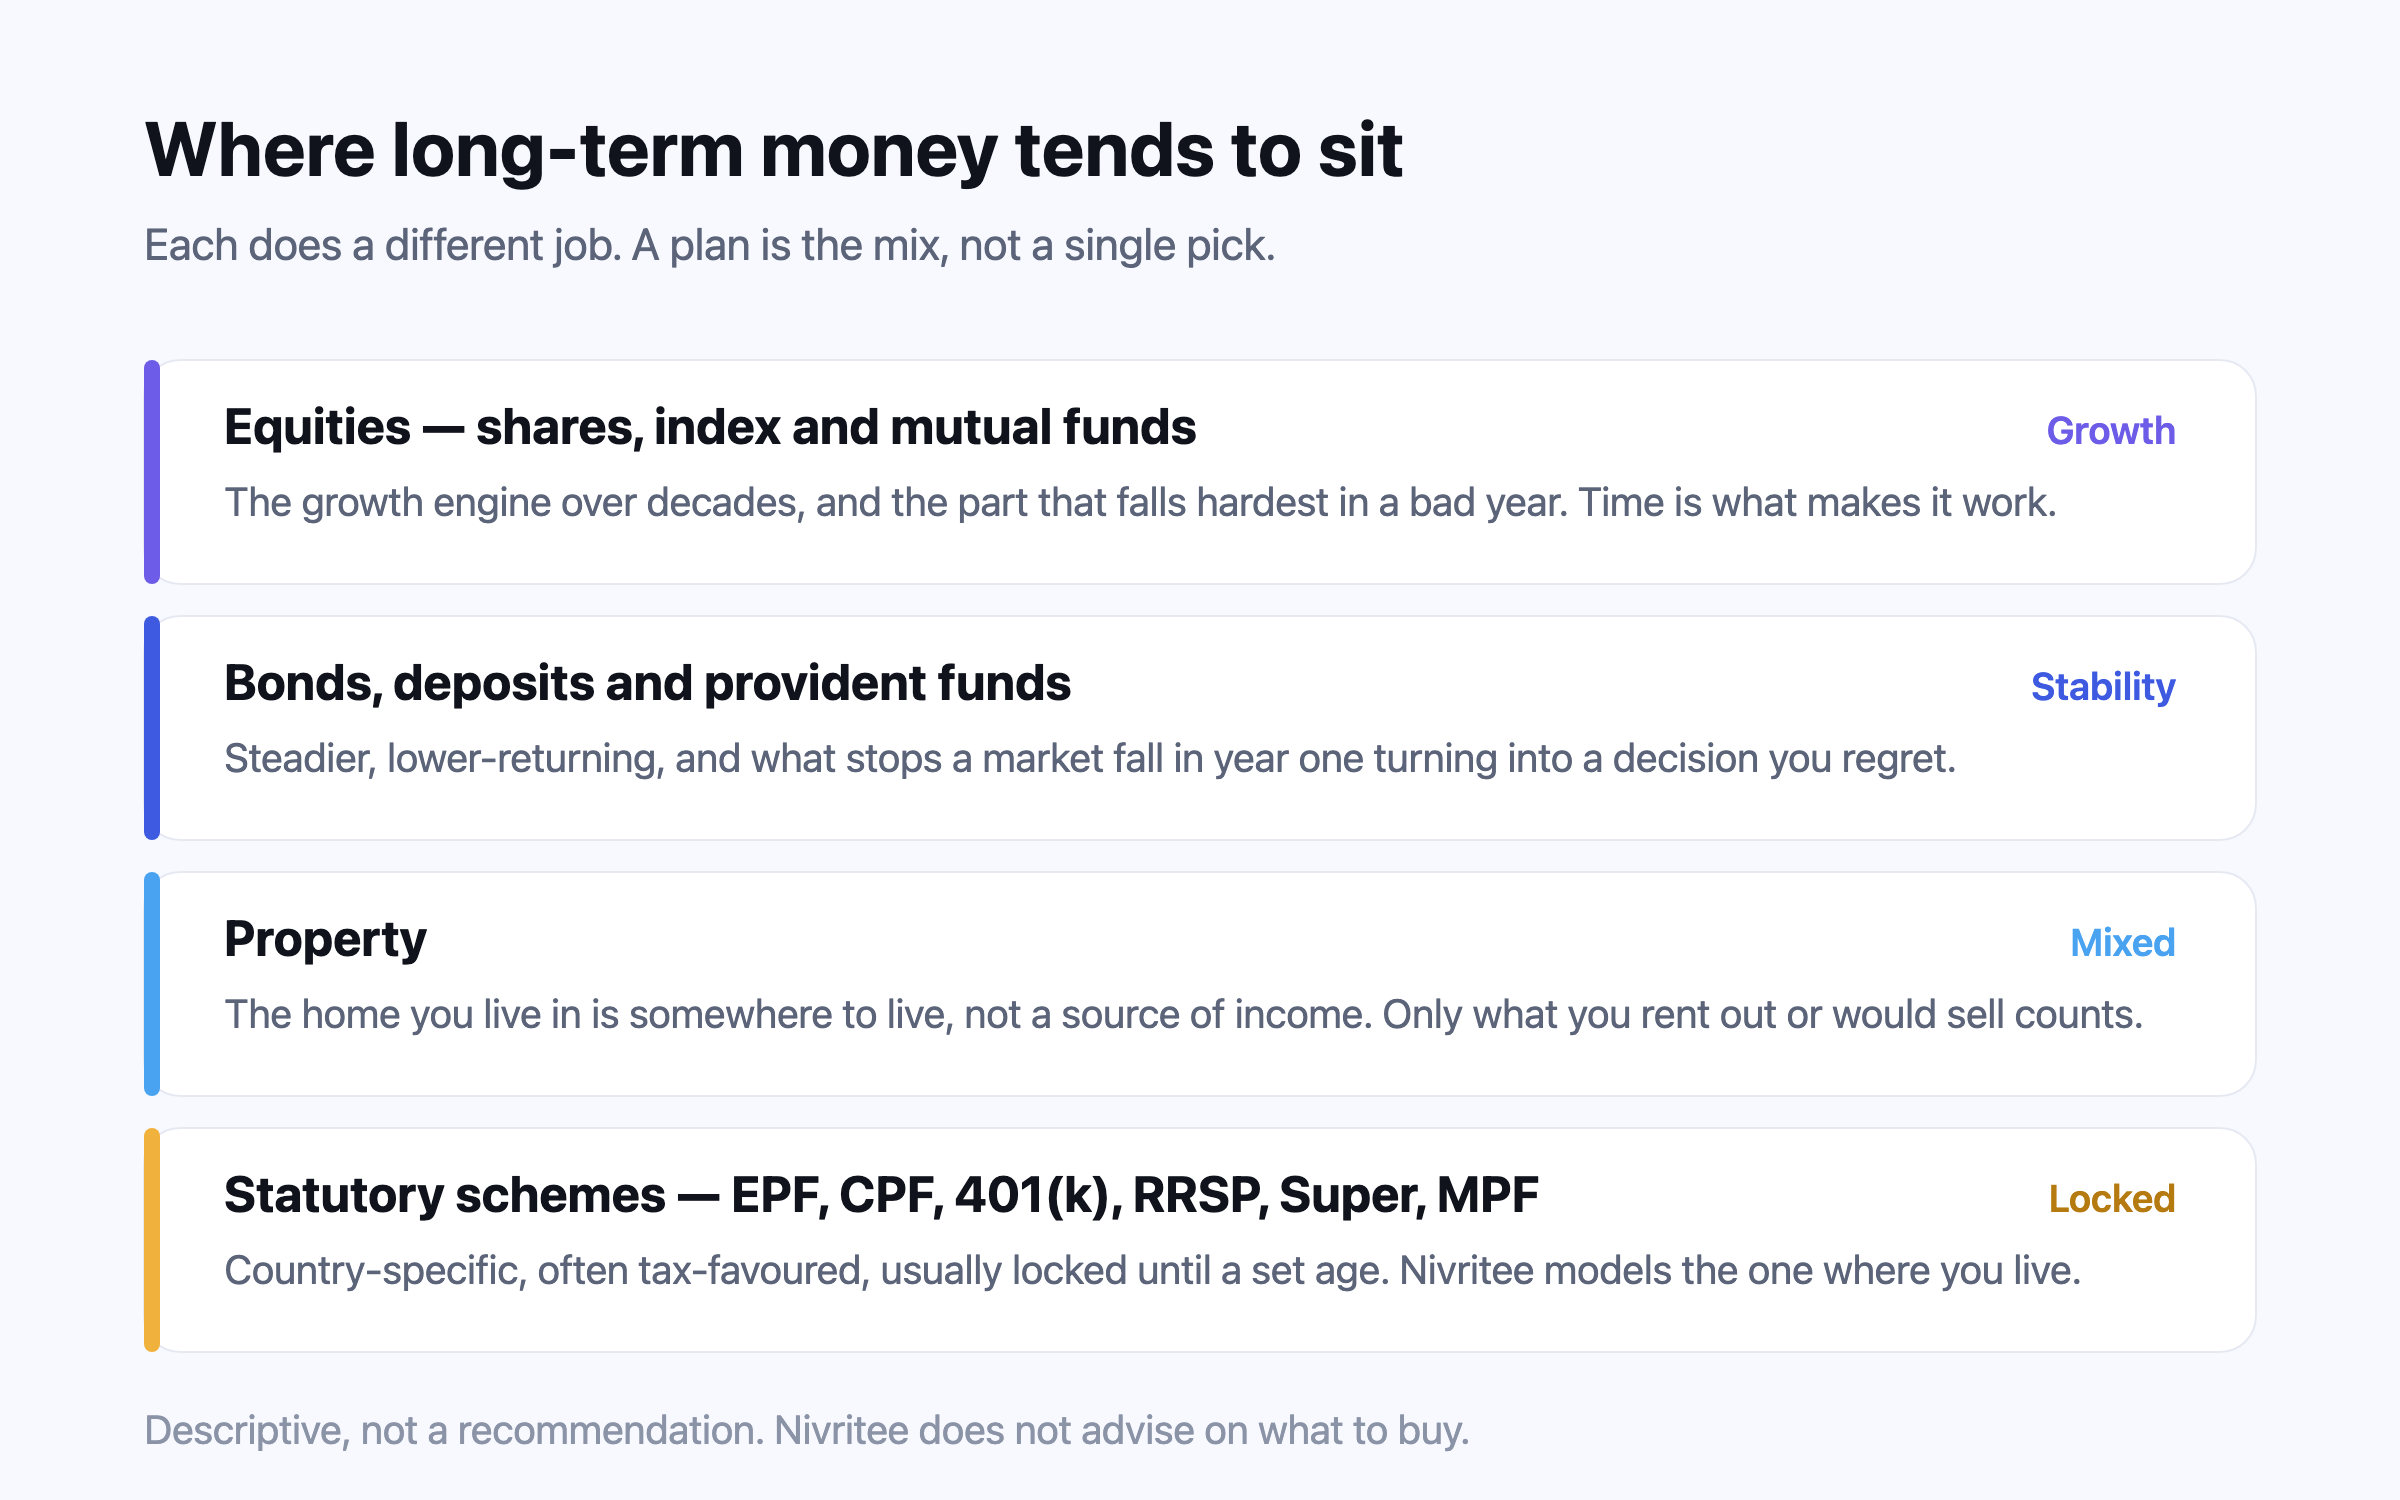
Sequence
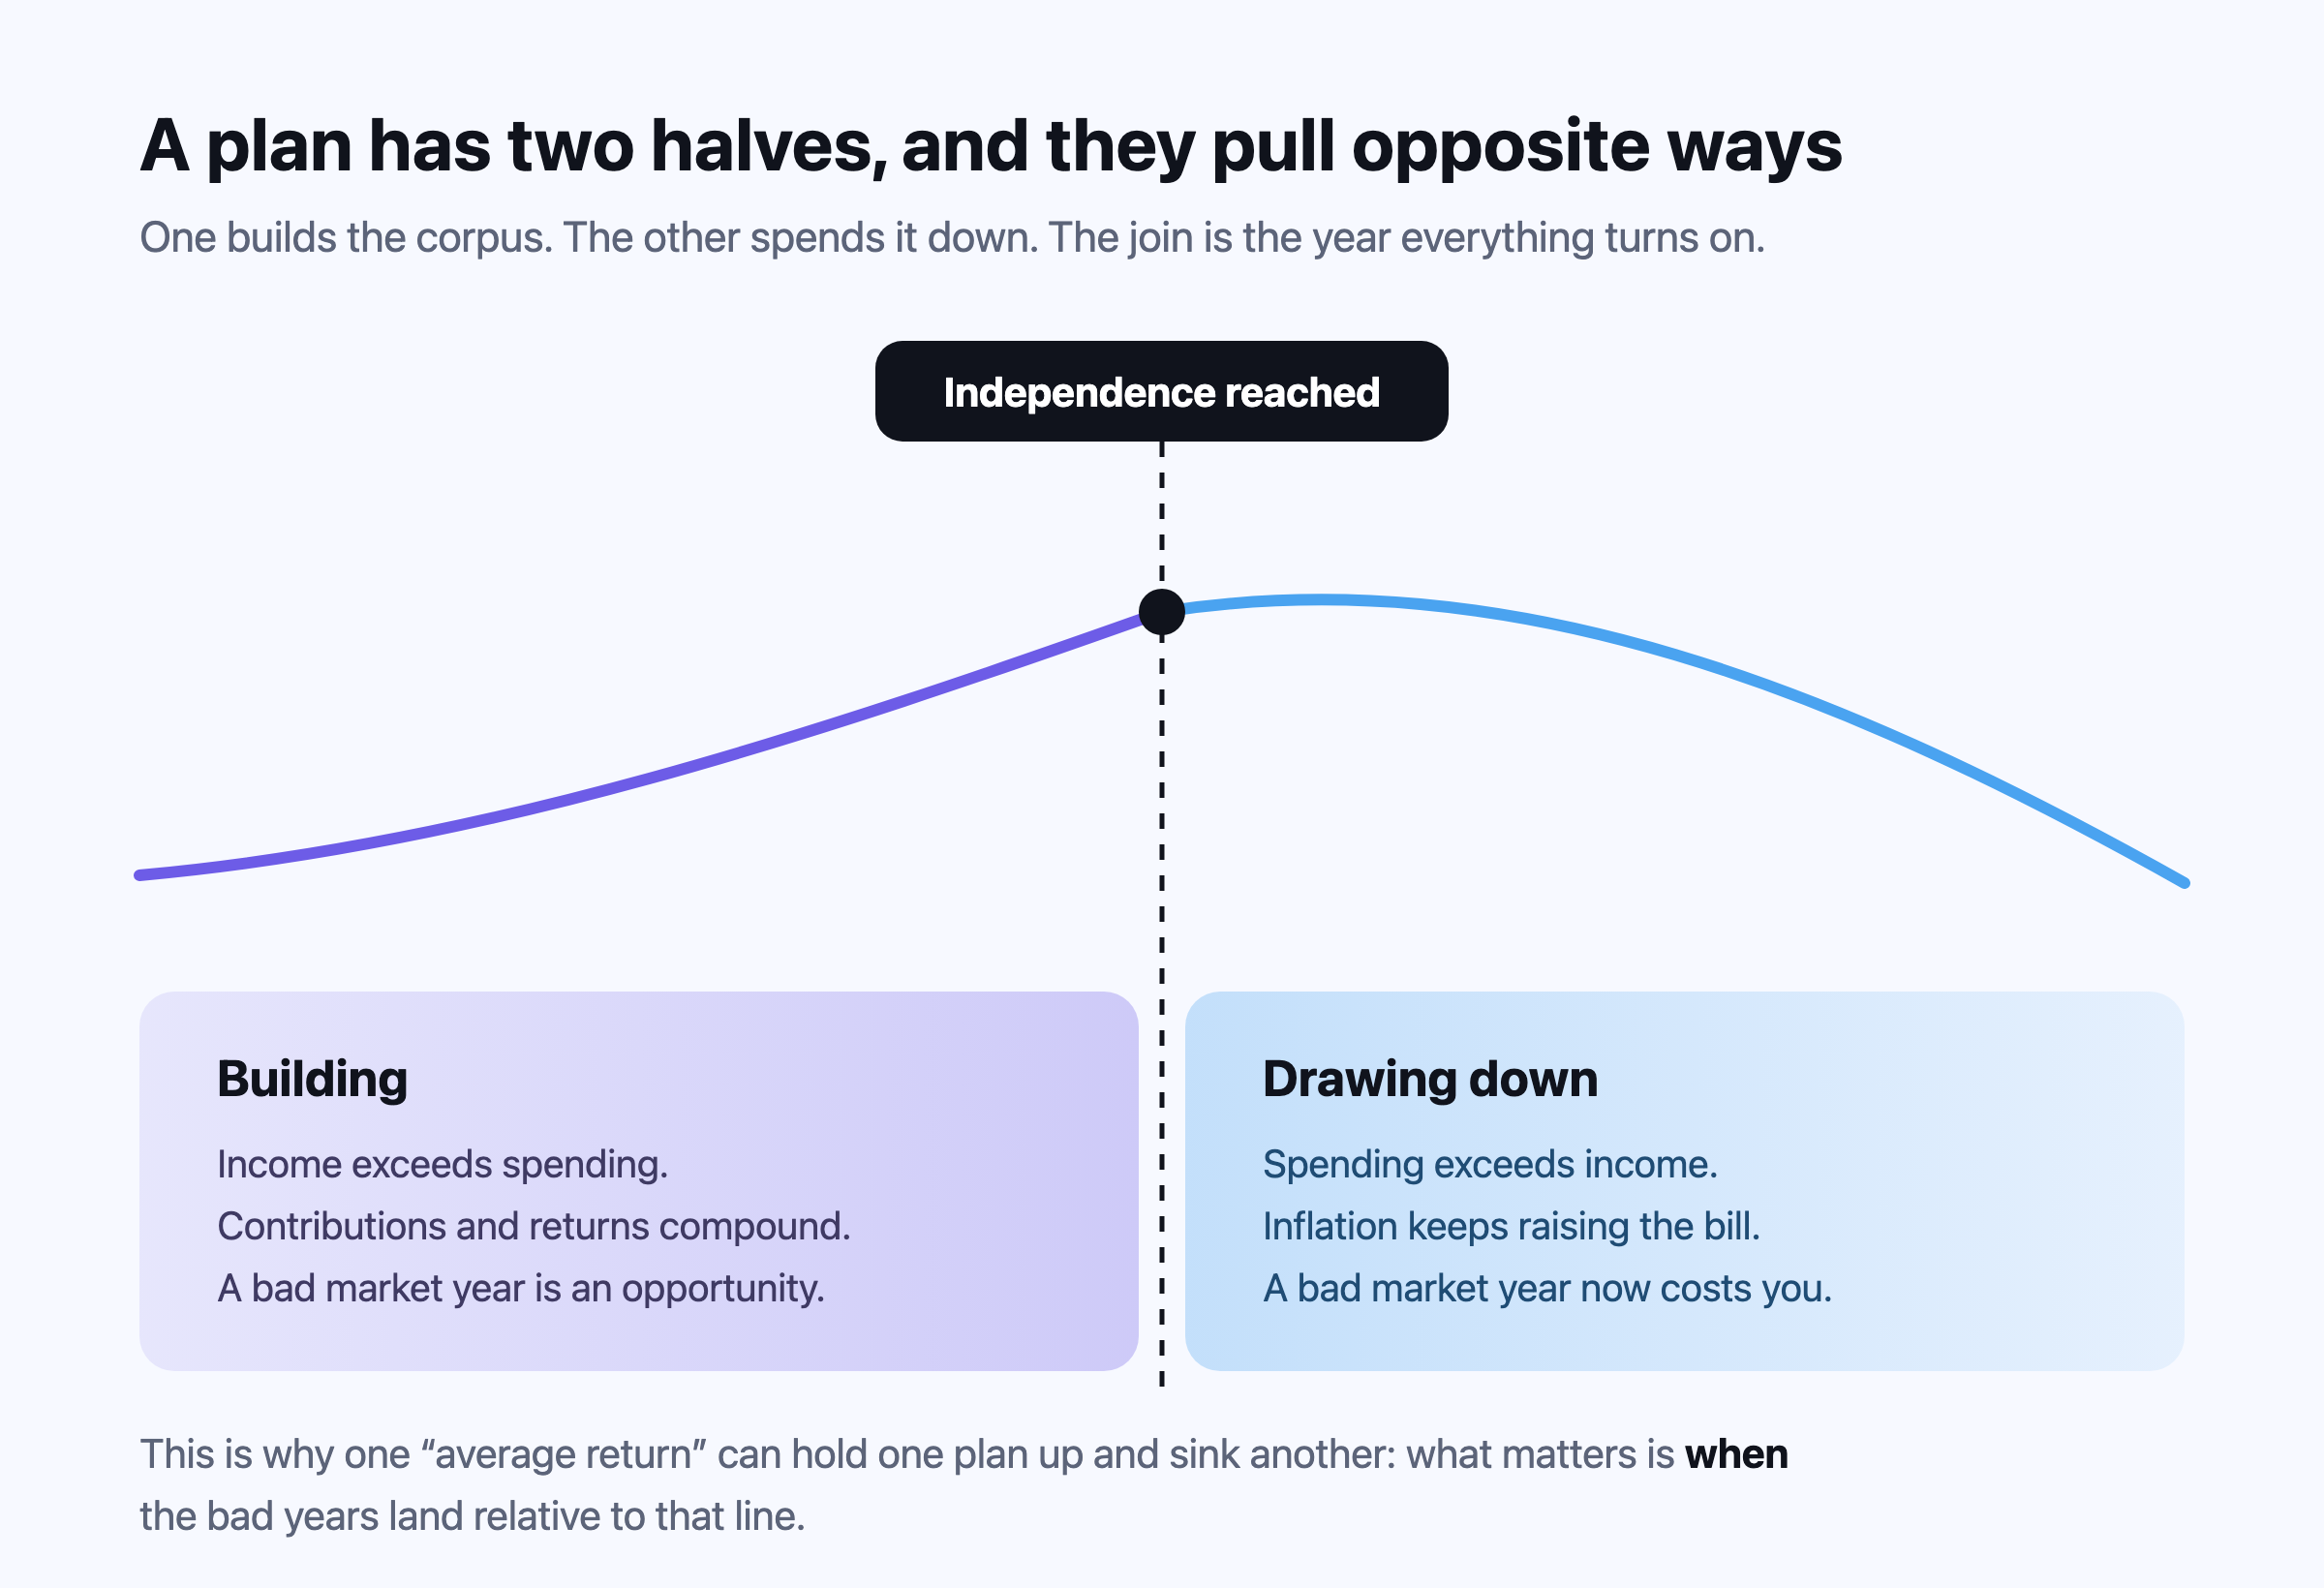
The same average return can hold one plan up and sink another.
While you are building, a bad year is a discount — the same contribution buys more. Once you are drawing down, a bad year is taken out of a corpus that has to last decades, and it is never made back.
That asymmetry is why an average return is not an answer, and why the stress tests here move a year rather than a percentage. What you want to know is when it breaks, not what it averages.
Where you live
A household is rarely in one country, and its plan should not be either.
A salary in one currency, a flat in another, a fund in a third, and a move somewhere in between. Eleven places to settle, each with its own inflation, returns, medical and education trends and statutory schemes — and none of them the same in any two.
Earning in one place and settling in another is a different plan rather than a conversion, and every row that names a country is priced at that country’s rates until it ends.
Planning across countries →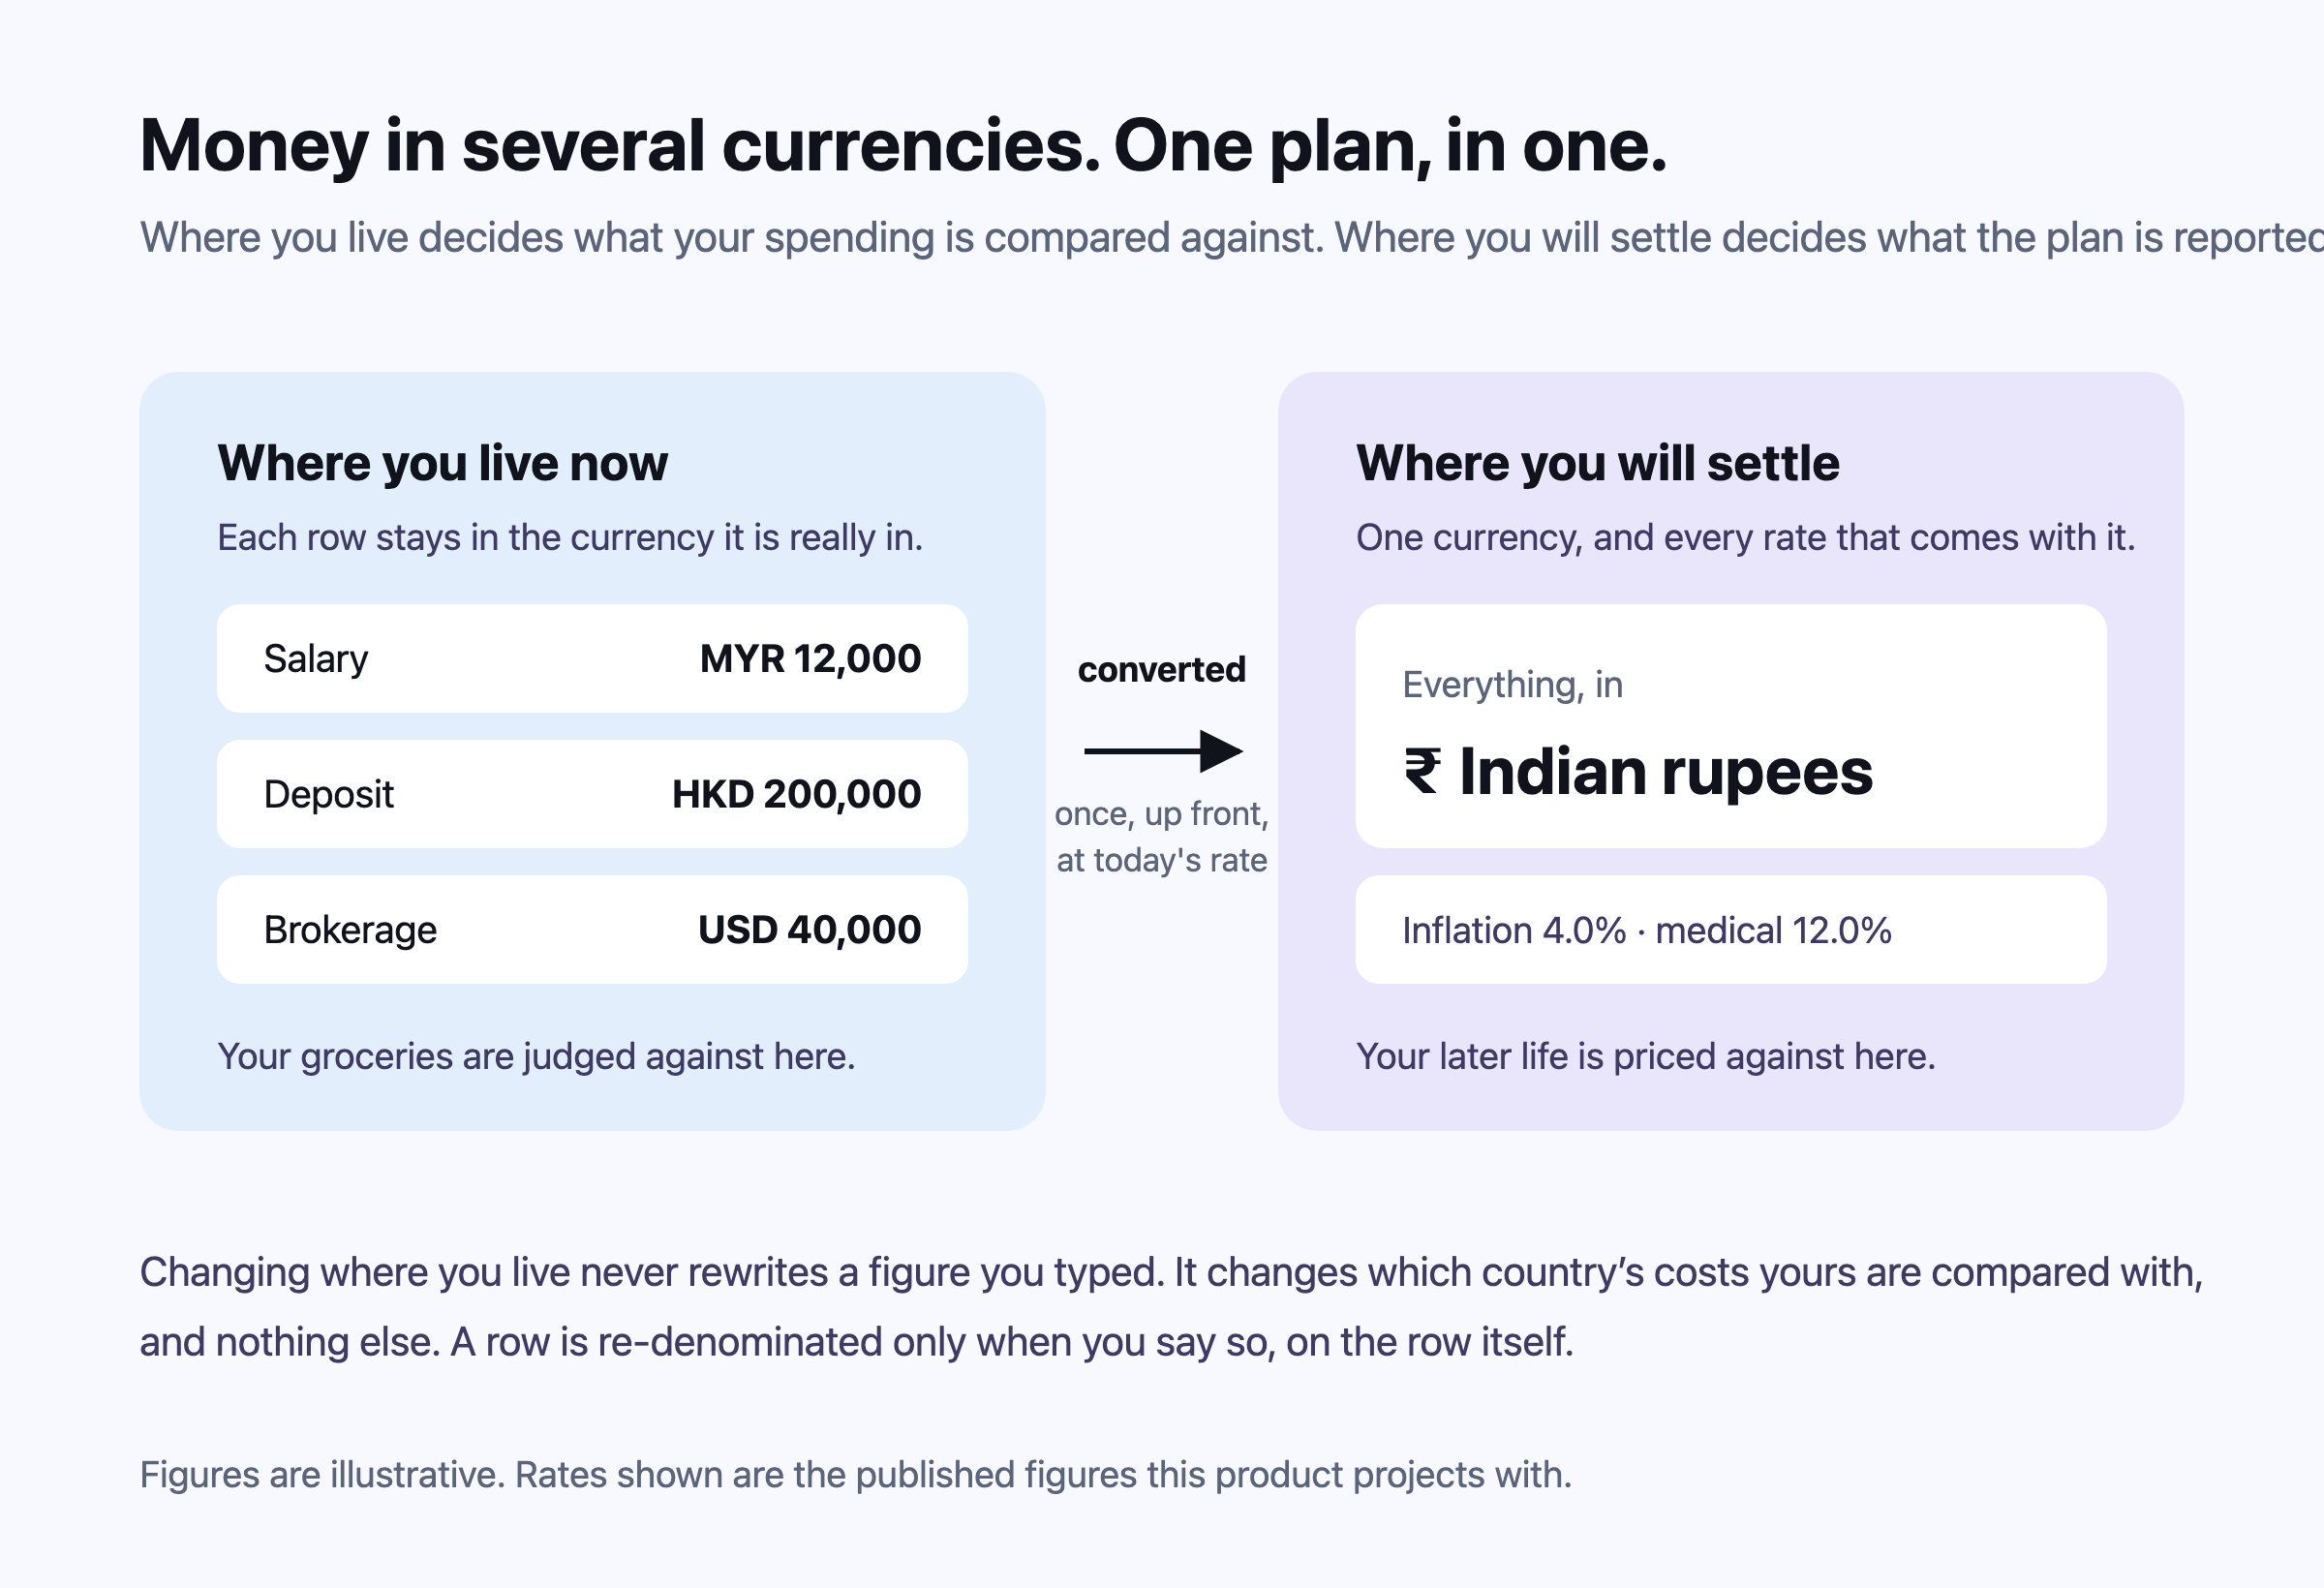
What you hold
A good return is not the same as enough.
Every plan assumes a return. If it assumes 11% and what you hold earns 10%, the corpus ends about a sixth smaller after twenty years — and nothing on the chart looks wrong while it happens. Beating an index somebody else chose does not answer that question.
So the useful reading is your actual return set against your own plan’s assumption, and whether the money is arranged for the years you have left and the currency you will spend.
How Investment Performance reads it →See what your own numbers say.
About two minutes to a first answer, and you can change every assumption we use. If the answer is uncomfortable, it is better to know now — that is the whole point of projecting it.
Start your plan