No budgeting method wins on the evidence. What works is making saving automatic and spending visible — and judging it against your own country, not a US rule of thumb.
Every popular budgeting method — 50/30/20, zero-based, envelopes and pay-yourself-first — can work, and no rigorous study shows one beating the others. What the research does support is saving automatically, keeping money in separate named pots and knowing where it goes by category. Fixed percentages travel badly: housing is a third of US household spending, while food alone is 47% of the average rural Indian household budget.
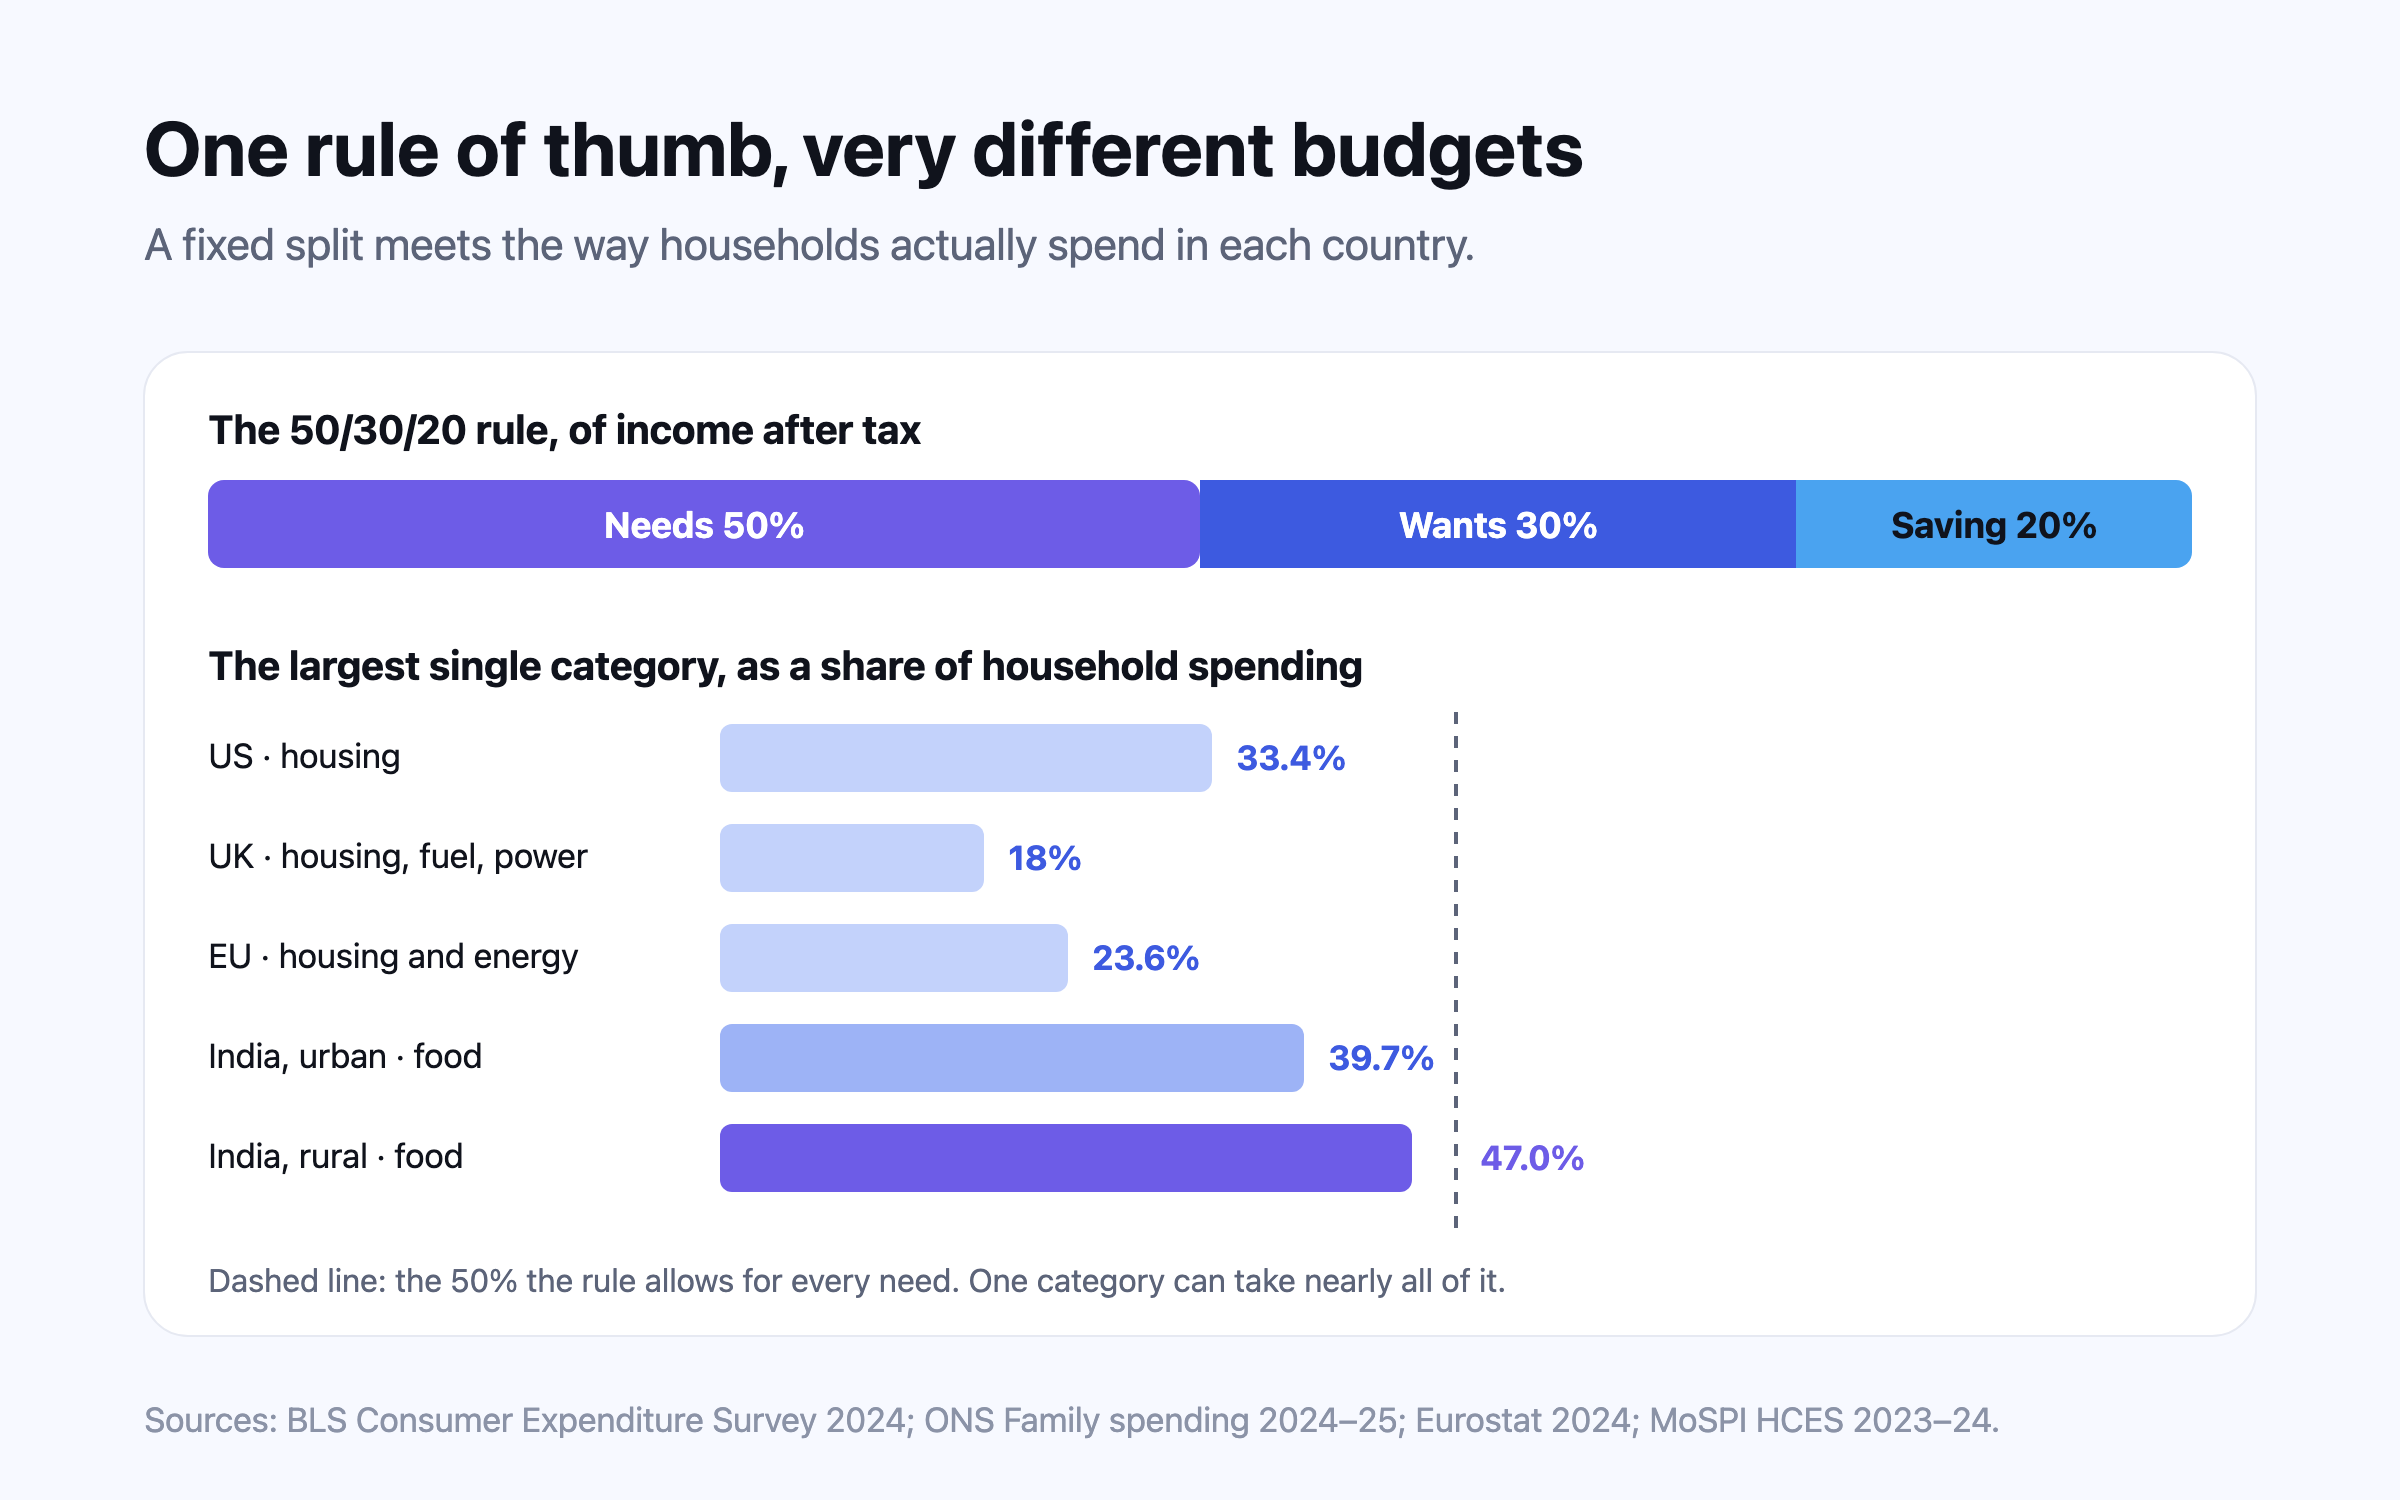
The short answer: pick the method you will keep doing, make saving happen before spending, and judge your categories against households like yours rather than against a fixed percentage. The best-known rule, 50/30/20, was written for American households in 2005.1 In the US today housing alone takes 33.4% of household spending2; in rural India food alone takes 47.0%.3 A rule that fits one of those households cannot fit both.
33.4%2
Housing’s share of US household spending, 2024
18%4
Housing (net), fuel and power in UK weekly spending, 2024–25
23.6%5
Housing, water, electricity and gas in EU household spending, 2024
47.0%3
Food’s share of average monthly spending, rural India, 2023–24
The four methods at a glance
| Method | How it works | Where it comes from | Suits | Weak spot |
|---|---|---|---|---|
| 50/30/20 | After-tax income split: 50% needs, 30% wants, 20% saving and debt repayment | Elizabeth Warren and Amelia Warren Tyagi, All Your Worth (2005) | A quick first check of balance | Fixed shares that ignore country, city and income |
| Zero-based | Every unit of income is assigned a job until nothing is unassigned | Zero-base budgeting in companies and government, associated with Peter Pyhrr | Tight months, irregular income, paying down debt | Time: it has to be redone every month |
| Envelopes | Money for each category is set apart; when an envelope is empty, spending stops | Household cash practice long before apps | Categories that leak: groceries, eating out | Cash is impractical; idle money earns nothing |
| Pay yourself first | Saving leaves on payday; the rest is spent without tracking | Personal-finance tradition | People who dislike tracking | Silent when spending or debt creeps up |
50/30/20: a useful rule of thumb from one country
Elizabeth Warren, then a Harvard law professor, and her daughter Amelia Warren Tyagi set out what they called a balanced money formula in *All Your Worth*: of income after tax, about 50% on must-haves, 30% on wants and 20% on savings and paying down debt.1 Its strength is that it is quick. It gives a household a sense of whether its fixed costs have grown too large without listing a single receipt.
Its weakness is that the shares are fixed while the cost of necessities is not. In the US Consumer Expenditure Survey for 2024, housing, transport and food together took 63.3% of all household spending — 33.4%, 17.0% and 12.9% respectively — before healthcare at 7.9%.2 In India, food takes 39.7% of average urban spending and 47.0% of rural spending.3 A family in an expensive city, or on a lower income, can be spending sensibly and still be well over a 50% needs line; a well-paid household can sit comfortably under it while saving far too little for its own goals. Use 50/30/20 as a first look, never as a verdict.
Zero-based budgeting: every unit has a job
Zero-based budgeting borrows its name from organisations. Peter Pyhrr described it for companies and then for governments in the 1970s: instead of starting from last year’s spending and adjusting, every budget is justified afresh from zero.6 The household version assigns every unit of the month’s income to a purpose — bills, groceries, saving, a holiday fund — until nothing is left unassigned.
It is the most thorough of the four and the most demanding. It suits a tight month, irregular income or a debt being cleared, because nothing slips through. It fails in the way all effortful systems fail: the month it is skipped, it stops working. The organisational version is criticised for the same reason — it is costly to redo from scratch every cycle.
Envelopes: why a physical limit works
The envelope method puts each category’s money somewhere separate, and stops spending when that place is empty. Two lines of research explain why it works. First, paying by card loosens the purse strings: in experiments with real purchases, Drazen Prelec and Duncan Simester found that people told to pay by credit card were willing to pay up to twice as much as those told to pay in cash.7 Second, partitions raise the cost of dipping in. In Dilip Soman and Amar Cheema’s experiment with labouring households in India, money split between two envelopes was saved about 72% more than money kept in one.8
Most people no longer carry envelopes of cash, and that is fine — the principle survives in separate accounts, a card used only for one category, or a pot with a name. The cost is that money sitting idle in a dozen small pots earns little, so keep envelopes for spending categories and let longer-term money be invested.
Pay yourself first: the reverse budget
Pay yourself first turns the budget upside down. Instead of tracking spending and saving what is left, a fixed share is saved on payday and the rest is spent without a ledger. It asks the least effort of any method and lines up with the strongest evidence in household finance — that automatic saving is the saving that happens. How to save more sets out that evidence.
Its blind spot is everything after payday. If rent rises or a loan creeps up, nothing in the method notices until the saving transfer starts to bounce. That is why many households combine it with a once-a-year look at category totals: automate the saving, then check that the spending underneath it still makes sense.
Where money actually goes: what household surveys show
National expenditure surveys are the best available picture of how households really spend. They are not targets — they describe averages, and averages include households very different from yours — but they show why one percentage rule cannot travel. Each office defines its categories differently, so read across a row, not down a column.
| Market | Source and period | Largest shares of spending |
|---|---|---|
| United States | BLS Consumer Expenditure Survey, 2024 | Housing 33.4% · Transport 17.0% · Food 12.9% · Personal insurance and pensions 12.5% · Healthcare 7.9% |
| United Kingdom | ONS Family spending, April 2024 to March 2025 | Housing (net), fuel and power 18% · Transport 14%, of an average £676.60 a week |
| European Union | Eurostat household consumption by purpose, 2024 | Housing, water, electricity and gas 23.6% · Food 13.2% · Transport 12.7% · Restaurants and accommodation 9.2% · Recreation 7.5% |
| India, urban | MoSPI HCES, August 2023 to July 2024 | Food 39.7% (of which beverages and processed food 11.1%) · Conveyance 8.5% · Rent about 7% · Miscellaneous goods and entertainment 6.9% · Durable goods 6.9% |
| India, rural | MoSPI HCES, August 2023 to July 2024 | Food 47.0% (of which beverages and processed food 9.8%, milk 8.4%) · Conveyance 7.6% · Medical 6.8% |
Three patterns stand out. Housing is the largest single line wherever it is measured as a category, from 18% of UK weekly spending to 33.4% in the US.42 Food shrinks as a share as incomes rise: 47.0% of rural Indian spending, 39.7% urban, and 13.2% in the EU.35 And some saving hides inside spending — the US figure for personal insurance and pensions, 12.5% of spending, includes contributions to pensions and Social Security.2 A budget that counts only what is left at the end of the month misses money the household is already putting aside.
Does budgeting work? What the evidence says
Fewer people budget than talk about it. In a 2013 Gallup poll, nearly one in three Americans said they prepared a detailed written or computerised household budget each month.9 The evidence on whether doing so pays off is thinner than the advice suggests: there is no large randomised trial showing that one method outperforms another.
What exists points in a consistent direction. The US Consumer Financial Protection Bureau’s research on financial well-being found a chain running from financial skill to day-to-day financial behaviour, from behaviour to a household’s financial situation, and from situation to how secure people feel — with confidence in one’s own ability to reach goals feeding behaviour too.10 Teaching alone fades: a meta-analysis of 201 studies found that financial education explained only 0.1% of the variance in later financial behaviour and had negligible effects 20 months on.11 Prompts tied to a goal work better — in field experiments, monthly reminders raised saving by about 6%.12
The honest reading is that the method matters less than three habits it should produce: saving that happens without a decision, money for different purposes kept apart, and a clear view of what each category costs — looked at often enough to notice change, not so often that it becomes a chore that gets dropped. This is information, not financial advice.
- Start with a total. Work out what you spend in a typical month from your statements, in a handful of categories. A rough, honest figure beats a precise budget nobody follows.
- Automate the saving first. Whichever method you choose, make saving leave on payday.
- Pick the method by temperament. Zero-based if you like detail or money is tight; envelopes for the one or two categories that leak; pay yourself first if tracking is what makes you give up.
- Compare categories with households like yours. A share far above typical for your country and city is worth a look; far below is often a cost that has not been counted.
- Look again when life changes — a move, a child, a new loan — and once a year regardless.
What Nivritee does instead of tracking transactions
Questions people ask
What is the 50/30/20 budget rule?
It splits income after tax into about 50% for needs, 30% for wants and 20% for saving and paying down debt. It comes from Elizabeth Warren and Amelia Warren Tyagi’s 2005 book All Your Worth.1
Does the 50/30/20 rule work in India?
Only as a rough first check. Food alone takes 39.7% of average urban and 47.0% of rural household spending in India, so many households cannot keep needs to 50% however carefully they spend.3 Comparing each category with a typical range for your city is more useful.
Which budgeting method is best?
No rigorous study shows one method beating another. The evidence supports automatic saving, separate pots for separate purposes and a regular look at category totals; choose the method that makes those habits easiest for you to keep.
What do households spend the most money on?
Housing, wherever it is measured as a category: 33.4% of US household spending in 2024 and 18% of UK weekly spending in 2024–25.24 In India, food is the largest share, at 39.7% of urban and 47.0% of rural spending.3
Is zero-based budgeting better than 50/30/20?
It is more thorough, because every unit of income is given a purpose, but it takes more time each month. It suits tight or irregular months; 50/30/20 is quicker but ignores how much necessities cost where you live.
Sources
- All Your Worth: The Ultimate Lifetime Money Plan — Elizabeth Warren and Amelia Warren Tyagi, Free Press (Internet Archive record), 2005.
- Consumer Expenditures — 2024 — US Bureau of Labor Statistics, 2025-12.
- Household Consumption Expenditure Survey: 2023–24 (press note and factsheet) — Ministry of Statistics and Programme Implementation, Government of India, 2024-12.
- Family spending in the UK: April 2024 to March 2025 — Office for National Statistics, 2026-06.
- Household consumption by purpose — Eurostat, Statistics Explained, 2025-11.
- The Zero-Base Approach to Government Budgeting (Public Administration Review 37:1) — Peter A. Pyhrr, American Society for Public Administration, 1977.
- Always Leave Home Without It: A Further Investigation of the Credit-Card Effect on Willingness to Pay (Marketing Letters 12) — Drazen Prelec and Duncan Simester, Springer, 2001.
- Earmarking and Partitioning: Increasing Saving by Low-Income Households (Journal of Marketing Research 48) — Dilip Soman and Amar Cheema, Rotman School of Management, University of Toronto, 2011.
- One in Three Americans Prepare a Detailed Household Budget — Gallup, 2013-06.
- Pathways to financial well-being: the role of financial capability — Consumer Financial Protection Bureau, 2018-09.
- Financial Literacy, Financial Education, and Downstream Financial Behaviors (Management Science 60:8) — Daniel Fernandes, John G. Lynch Jr. and Richard G. Netemeyer, INFORMS, 2014.
- Getting to the Top of Mind: How Reminders Increase Saving (Management Science 62:12) — Dean Karlan, Margaret McConnell, Sendhil Mullainathan and Jonathan Zinman, INFORMS, 2016.
This is general information, not financial, tax or legal advice for your circumstances. Rules and figures change; check the official source for your country, and consult a licensed professional before making financial decisions. Projections are estimates, not predictions.