Willpower is the weakest way to save. Defaults, pre-commitment and labelled pots move savings far more than good intentions.
The most reliable way to save more is to make saving happen without a decision each month. In one US company, 86% of staff hired under automatic enrolment were in its 401(k), against 49% of those hired the year before; in Great Britain, workplace pension participation rose from 55% to 89% after automatic enrolment; in Denmark, automatic contributions raised total saving while tax incentives mostly moved money between accounts. Commitment, reminders and clearly labelled pots add to that — information on its own adds surprisingly little.
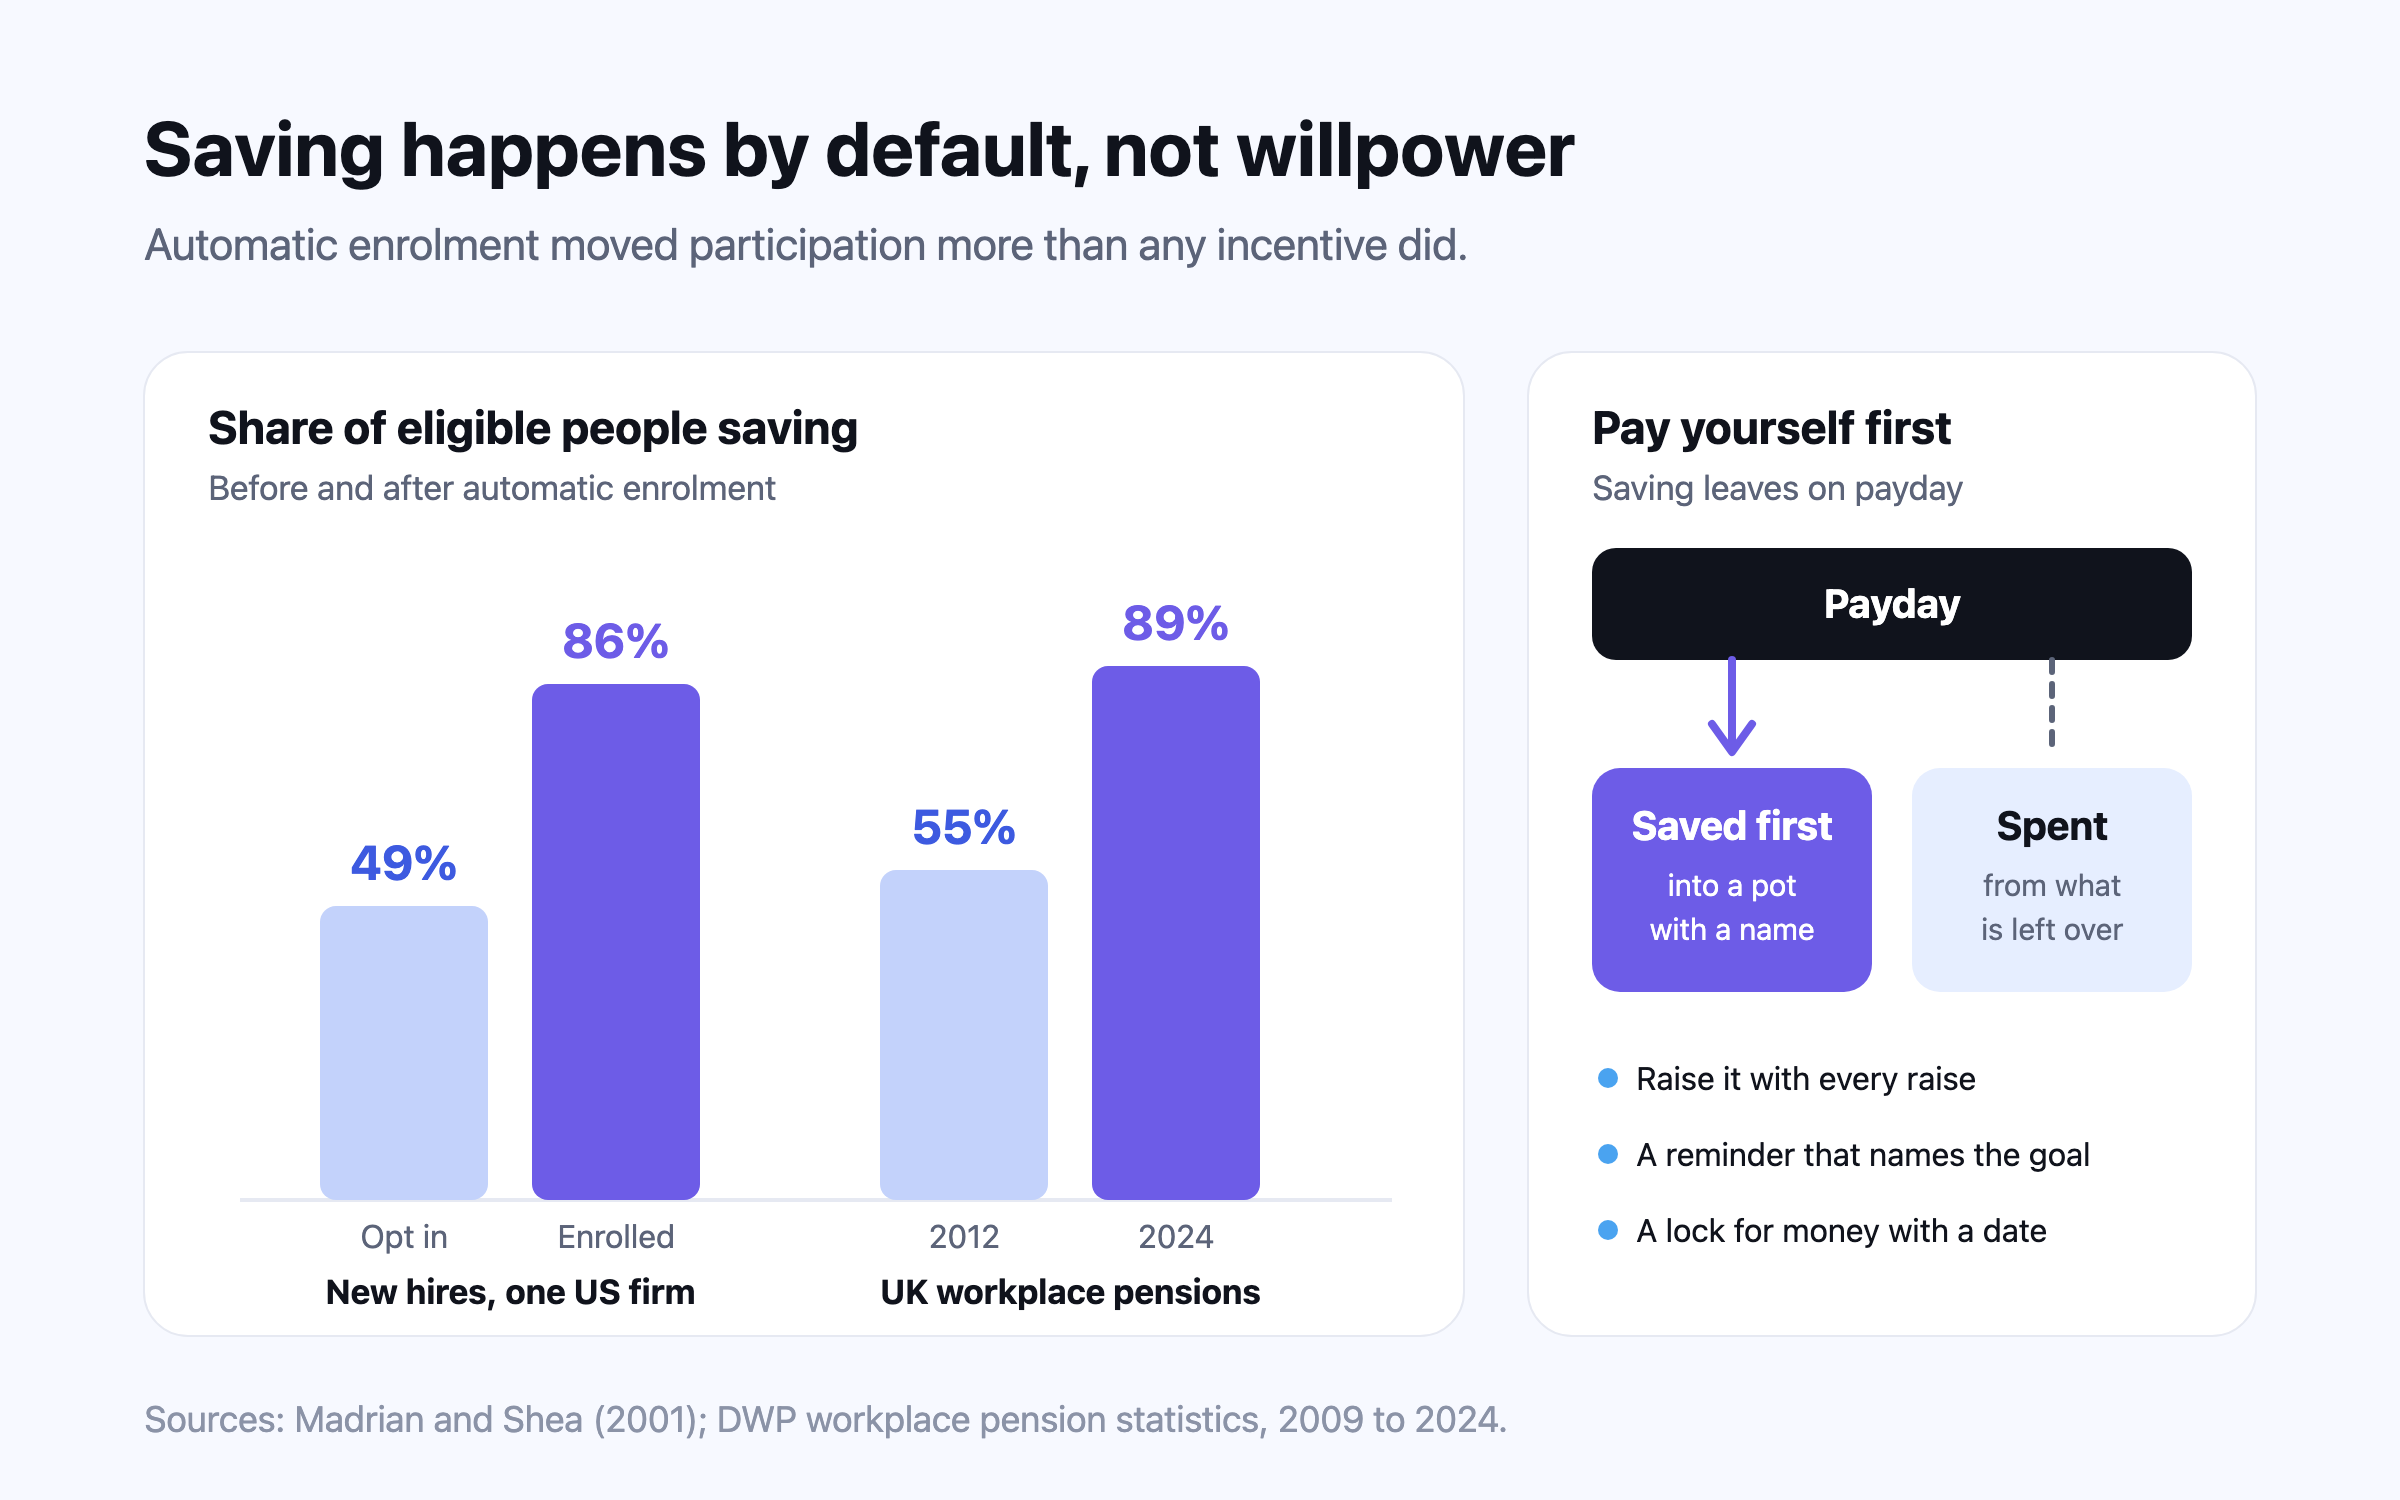
The short answer: stop relying on a monthly decision. The strongest evidence in household finance is that people save what they are set up to save. When a large US employer switched to enrolling new staff in its 401(k) automatically, 86% of those it hired under the new rule were in the plan, against 49% of those hired in the year before — with no change to the plan’s money at all.12 When the UK made automatic enrolment law, workplace pension participation among eligible employees in Great Britain rose from 55% in 2012 to 89% in 2024.34 The rest of this article sets out what else the research shows works, what it costs, and how to build it into your own month.
It builds on lifestyle inflation and knowing when it is enough, which covers why a raise stops feeling like a raise and why the savings rate, more than income, sets the timeline to financial independence. Here the question is narrower and more practical: once you have decided to save more, what actually makes it happen?
49% → 86%1
401(k) participation: staff hired the year before automatic enrolment, then those hired under it
55% → 89%4
Workplace pension participation of eligible employees in Great Britain, 2012 to 2024
85%5
Danes who are “passive savers”, moved by defaults rather than incentives
+82%6
Savings balances a year after a commitment account was offered, against a control group
Defaults do the heavy lifting
Brigitte Madrian and Dennis Shea’s 2001 study is the founding result. Their company changed one thing: instead of asking staff to opt in to the 401(k), it enrolled them unless they opted out. 86% of the staff hired under the new rule were in the plan, against 49% of those hired in the year before; compared at the same length of service, the gap was wider still — 86% against 37%.12 Just as striking, a large share of the automatically enrolled stayed exactly where they were put — at the default contribution rate and in the default fund — even though almost nobody hired earlier had chosen that combination.1 Inertia, the authors concluded, is powerful, and many people read a default as a recommendation.
The UK turned the idea into national policy from 2012. Employers must enrol eligible workers into a workplace pension; workers may opt out. Participation among eligible employees in Great Britain climbed from a low of 55% in 2012 to 88% by 2021; in the private sector it rose by 44 percentage points to 86%, and among 22- to 29-year-olds from 24% to 85%.3 In 2024 it stood at 89%, with eligible savers putting £149.7 billion a year into workplace pensions.4
What actually moves a savings rate
The clearest test of incentives against automation comes from Denmark. Raj Chetty, John Friedman and colleagues followed 41 million observations of Danish savers. They found that each $1 of government spending on retirement-saving subsidies raised total saving by only 1 cent: the people who responded mostly moved money they would have saved anyway into the subsidised account.5 Automatic contributions — money set aside from pay before it reached anybody — did raise total saving, because about 85% of people were “passive savers” who did not offset them by saving less elsewhere.5
Information on its own does less than most people expect. A meta-analysis of 201 studies by Daniel Fernandes, John Lynch and Richard Netemeyer found that interventions to improve financial literacy explained only 0.1% of the variance in the financial behaviours studied, and that even long courses had negligible effects 20 months on.7 Their conclusion was not that knowledge is useless, but that it works best “just in time”, tied to a decision being made now. Reading this article helps only if it ends in something set up today.
Pre-commit the future, not the present
Richard Thaler and Shlomo Benartzi’s Save More Tomorrow asked employees to commit, in advance, part of each future pay rise to saving. Because the money never reached their take-home pay, it was never felt as a cut. In the first company to use it, 78% of those offered the plan joined, and 80% of those stayed in it through the fourth annual raise.8 Its headline result on saving rates is covered in the lifestyle-inflation article; the lesson here is about timing. People find it far easier to promise future money than to give up present money, so the best moment to raise a saving rate is before the raise lands.
Commitment devices and reminders
Nava Ashraf, Dean Karlan and Wesley Yin tested a harder form of commitment with a bank in the Philippines: a SEED account that paid no extra interest and simply locked the money away until a goal date or a goal amount was reached. Only 28% of those offered it chose to open one — but among everybody offered it, average savings balances were 42% higher than in a comparison group after six months and 82% higher after a year.6 Many people, it turns out, want a lock on their own savings and will choose one when it is offered.
Something gentler also works. In field experiments with clients who had just opened commitment savings accounts at banks in Bolivia, Peru and the Philippines, Karlan and colleagues sent monthly reminders to save. Those who received them saved about 6% more than those who did not — an imprecise estimate — and in Peru, where each client had named what the money was for, reminders that mentioned that goal as well as the interest bonus raised saving by an estimated 10 to 11%, against both no reminder and a reminder of the bonus alone.9
The trade-off is real. Locked money cannot pay for an emergency, and a commitment that is too strict is one people abandon. The research supports locking away money set aside for a dated goal, while keeping a separate, accessible buffer — which is exactly the split a bucket strategy makes explicit.
Mental accounting: give every pot a name
Economic theory says money is fungible: a rupee is a rupee, whatever jar it sits in. People do not behave that way. Richard Thaler’s work on mental accounting describes how households sort money into accounts with their own rules — housekeeping, holidays, school fees — and spend differently from each.10 Usually this is described as a bias. For saving, it can be put to work.
Dilip Soman and Amar Cheema ran a 14-week experiment with labouring households in India whose wages were partly set aside for saving. Households whose earmarked money was split between two sealed envelopes saved an average of ₹414, against ₹241 for those given one envelope — about 72% more — and envelopes carrying a picture of the household’s children raised saving further.11 Breaking a pot open has a psychological cost, and a named purpose raises it.
The same habit has a known failure: keeping a labelled pot in a low-interest deposit while carrying expensive debt costs money every month. Labels are for keeping savings from being spent, not for deciding where savings should go — for that, see pay off debt or invest.
Pay yourself first: a practical order of operations
“Pay yourself first” is the oldest advice in personal finance, and the research above explains why it works: it turns saving from a decision made at the end of the month, against everything else, into a default made at the start. Here is the order the evidence supports. This is information, not financial advice.
- Automate on payday. Set a standing instruction or a monthly investment that leaves your account the day pay arrives. Join any workplace scheme, and contribute at least enough to collect an employer match.
- Raise it with every raise. Decide now what share of the next increase goes to saving, and change the instruction the month the raise starts. Pre-committing future money is the easiest commitment to keep.
- Name the pots. Separate accounts for separate purposes — the emergency buffer, a child’s education, financial independence — each with its own label and, where it helps, a lock.
- Keep a reminder that names the goal. A monthly note naming what the money is for did more than a generic nudge in the evidence.
- Watch the share, not the balance. A balance rises and falls with markets; the share of income you keep is the part you control.
- Review once a year, together if you share finances. See how couples can talk about money.
How much do households save? It depends who is counting
National saving rates are often quoted as a benchmark, but each statistics office measures something slightly different, and none of them describes your household. The table gives each one’s latest published figure in its own terms.
| Market | Latest period | Household saving | What is measured |
|---|---|---|---|
| United States | August 2026 | 4.1% | Personal saving as a share of disposable personal income (BEA) |
| Canada | Q2 2026 | 3.7% | Household saving rate (Statistics Canada) |
| Australia | June quarter 2026 | 6.5% | Household saving to income ratio (ABS) |
| United Kingdom | Q2 2026 | 8.8% | Households’ saving ratio, including pension saving (ONS) |
| Euro area | Q1 2026 | 14.3% | Gross saving as a share of gross disposable income (Eurostat) |
| India | 2024–25 | 7.0% of GNDI | Net financial saving of households only — excludes physical assets such as property and gold (RBI) |
Two lessons survive the differences. First, a national average of 4% to 14% is far below what a household aiming for early financial independence needs: under the simple arithmetic in the lifestyle-inflation article, a 10% savings rate implies about 51 years from zero to independence and 50% about 17.18 Second, averages hide the split that matters. In the UK, pension saving made up 4.3 percentage points of the 8.8% ratio in the second quarter of 2026 — saving that happens because it is automatic.15 In India, net financial saving rose to 7.0% of national disposable income in 2024–25 from 5.8% a year earlier, mainly because households borrowed less.17
How Nivritee helps you see what saving more buys
Questions people ask
What is the most effective way to save more money?
Make it automatic. Automatic enrolment raised 401(k) participation among new hires from 49% to 86% in one company, and in Denmark automatic contributions raised total saving while tax subsidies mostly moved money between accounts.15
Does auto-enrolment really increase pension saving?
Yes. In Great Britain, workplace pension participation among eligible employees rose from 55% in 2012 to 89% in 2024 after automatic enrolment, and eligible savers put £149.7 billion into workplace pensions in 2024.34 The catch is that many people stay at the minimum rate, which may not be enough for their own plan.
What does “pay yourself first” mean?
It means moving your saving out of your account on payday, before any spending, rather than saving whatever is left at the end of the month. It works because it replaces a monthly decision with a default.
Do commitment savings accounts work?
In a field experiment in the Philippines, only 28% of people offered a locked savings account took it, but average savings among everybody offered it were 82% higher than in a comparison group after a year.6 The cost is that locked money is not available in an emergency, so keep a separate buffer.
What is a good household savings rate?
National averages are low and measured differently — 4.1% in the US in August 2026 and 8.8% in the UK in the second quarter of 2026, for example.1215 What is enough depends on when you want to be financially independent, which is why it is worth projecting your own figures rather than matching an average.
Sources
- The Power of Suggestion: Inertia in 401(k) Participation and Savings Behavior (Quarterly Journal of Economics 116:4) — Brigitte C. Madrian and Dennis F. Shea, NBER, 2001.
- Will automatic enrollment reduce employer contributions to 401(k) plans? (Working Paper 2009-33) — Center for Retirement Research at Boston College, 2009-12.
- Workplace pension participation and savings trends of eligible employees: 2009 to 2021 — Department for Work and Pensions, 2022.
- Workplace pension participation and savings trends of eligible employees: 2009 to 2024 — Department for Work and Pensions, 2025-07.
- Active vs. Passive Decisions and Crowd-Out in Retirement Savings Accounts: Evidence from Denmark (Quarterly Journal of Economics 129:3) — Raj Chetty, John N. Friedman, Søren Leth-Petersen, Torben Nielsen and Tore Olsen, NBER, 2014.
- Commitment Savings Products in the Philippines (evaluation of Ashraf, Karlan and Yin, Quarterly Journal of Economics 121:2, 2006) — Abdul Latif Jameel Poverty Action Lab (J-PAL), 2006.
- Financial Literacy, Financial Education, and Downstream Financial Behaviors (Management Science 60:8) — Daniel Fernandes, John G. Lynch Jr. and Richard G. Netemeyer, INFORMS, 2014.
- Save More Tomorrow: Using Behavioral Economics to Increase Employee Saving (Journal of Political Economy 112) — Richard H. Thaler and Shlomo Benartzi, UCLA Anderson, 2004.
- Getting to the Top of Mind: How Reminders Increase Saving (Management Science 62:12) — Dean Karlan, Margaret McConnell, Sendhil Mullainathan and Jonathan Zinman, INFORMS, 2016.
- Mental Accounting and Consumer Choice (Marketing Science 4:3) — Richard H. Thaler, INFORMS, 1985.
- Earmarking and Partitioning: Increasing Saving by Low-Income Households (Journal of Marketing Research 48) — Dilip Soman and Amar Cheema, Rotman School of Management, University of Toronto, 2011.
- Personal Saving Rate — US Bureau of Economic Analysis, 2026-08.
- Gross domestic product, income and expenditure, second quarter 2026 — Statistics Canada, The Daily, 2026-08.
- Australian National Accounts: National Income, Expenditure and Product, June 2026 — Australian Bureau of Statistics, 2026-09.
- GDP quarterly national accounts, UK: April to June 2026 — Office for National Statistics, 2026-09.
- Household saving rate remains stable at 14.3% in the euro area — Eurostat, euro indicators, 2026-07.
- Annual Report 2025–26 — Reserve Bank of India, 2026-05.
- The shockingly simple math behind early retirement — Mr. Money Mustache, 2012-01.
This is general information, not financial, tax or legal advice for your circumstances. Rules and figures change; check the official source for your country, and consult a licensed professional before making financial decisions. Projections are estimates, not predictions.