Every country, one currency
Indian mutual funds, US stocks, a UK fund and a Gulf deposit in one household figure, converted daily into your home currency.
Portfolio Tracker · multi-currency portfolio and net-worth tracker
Stocks, ETFs and mutual funds in India, the US and London, deposits in any of 142 currencies, provident funds, pensions, gold and property — valued every weekday in the currency you will spend. The headline is your real return, an XIRR set against the rate your own FIRE plan assumes. Free, and no bank or broker login.
Portfolio Tracker
12.7%a year · your plan assumes 11.0%
+1.7% against the rate your plan projects with
You put in ₹49.4L Markets added ₹14.46L
Prices as of 11 September 2026 · exchange rates as of 11 September 2026
Portfolio Tracker · stock and mutual fund tracker
Search by name, ticker, scheme code or ISIN, choose what kind of investment it is, and enter the units and the price you paid. Buys, sells, bonuses, splits and transfers go in a ledger under each holding; a SIP is entered once and each instalment becomes a dated purchase on the day it actually settled.
Every row shows its value, its gain, its own XIRR and thirty days of closes, in your plan’s currency with its own beside it. A holding the feed has not priced yet is valued at what you paid, and the row says so rather than guessing.
How to add a holding, in the Help Centre →Investments
| Investment | Value | Gain | XIRR | 30 days |
|---|---|---|---|---|
| Nifty 50 index fund | ₹16.5L₹16,50,000 | +₹3.5L | 11.4% | |
| S&P 500 ETF | ₹22.52L$27,000 | +₹5.84L | 14.3% | |
| Nifty Next 50 ETF | ₹10L₹10,00,000 | +₹2L | 13.0% | |
| Sovereign Gold Bond | ₹7L₹7,00,000 | +₹2L | 15.0% | |
| FTSE 100 tracker | ₹7.84L£7,000 · quoted in pence | +₹1.12L | 8.1% |
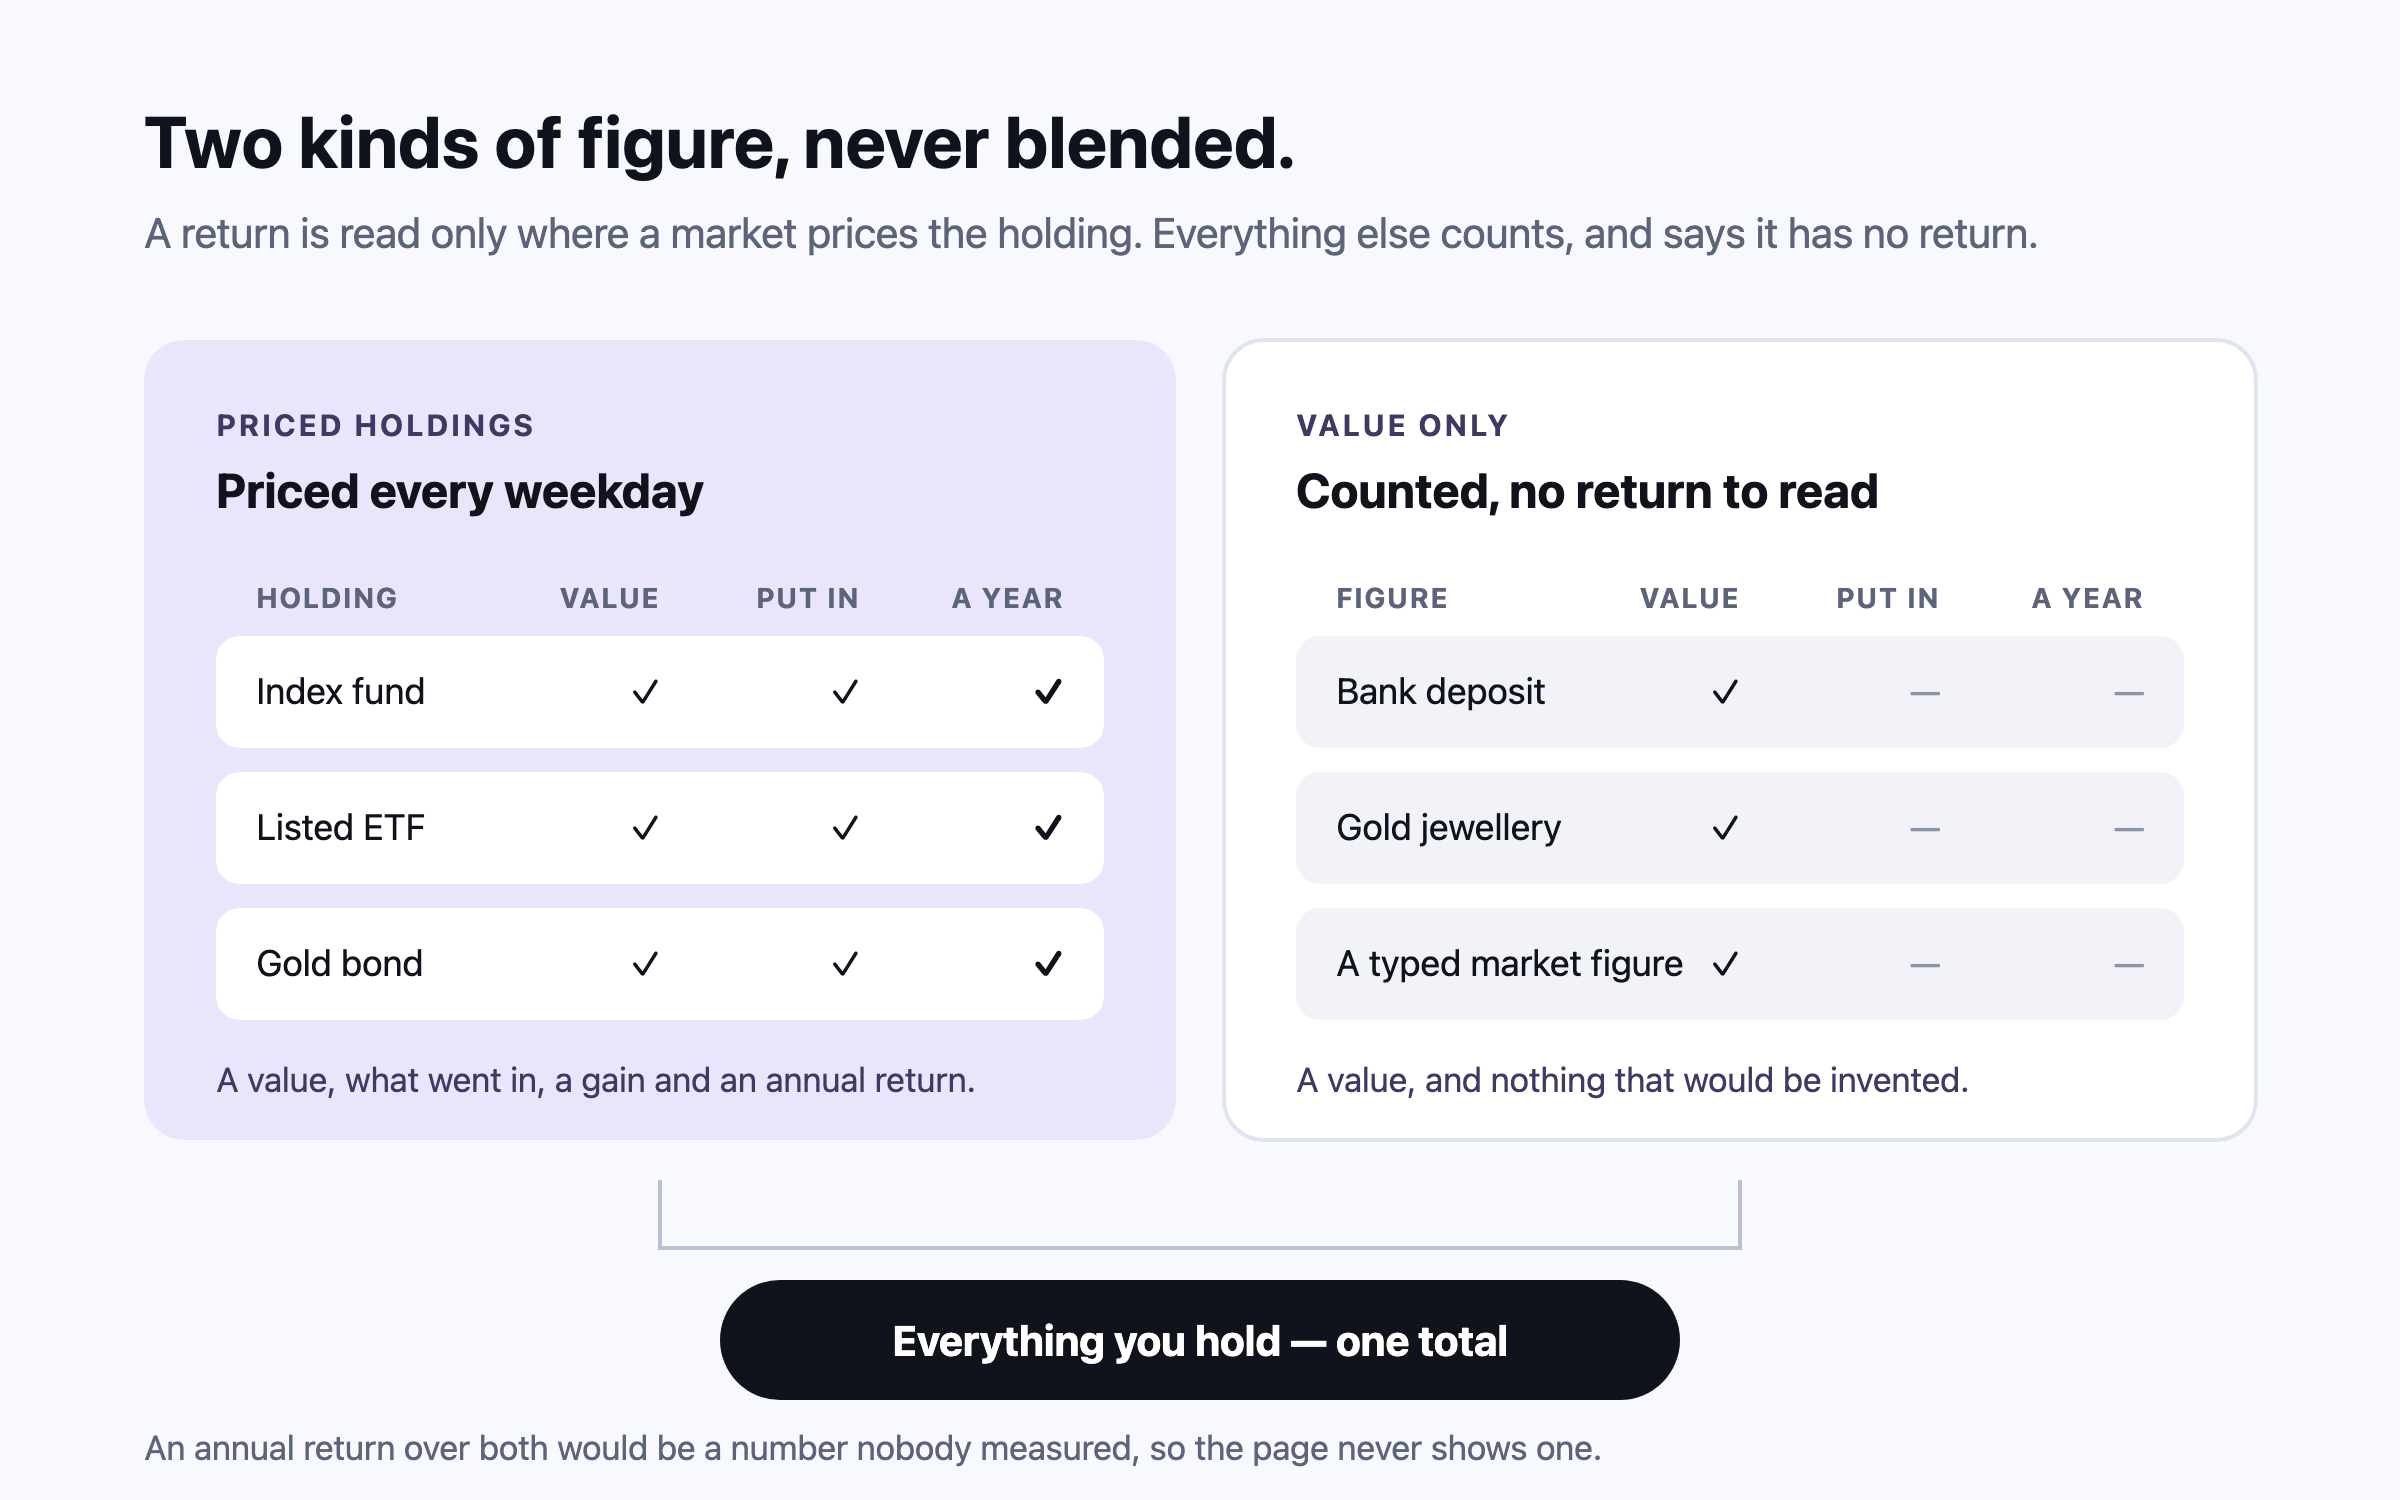
Not listed: ₹10,00,000 typed as one figure — counted in the plan, with no return to read until it is listed.
Portfolio Tracker · eight live markets
NSE and BSE from the exchanges’ own daily files, Indian mutual funds by scheme code, NASDAQ, NYSE, US mutual funds, the London Stock Exchange, and UK and European funds by ISIN. Prices are each market’s daily close — never real time.
Each holding keeps the currency its market quotes it in — a London price in pence is read as pence — and converts once, at a rate checked against a second published rate before it is used. Every page says which day the prices and the rates are from.
Investing in India from abroad? The NRI portfolio tracker →Portfolio Tracker
Converted once into INR, before anything is computed.
Portfolio Tracker · net-worth tracker
Savings accounts and fixed deposits in any of 142 currencies, named by the country they are banked in. EPF, PPF, NPS, 401(k), super, CPF, ISAs and the schemes of every market Nivritee plans for. Gold and jewellery. Property — with the home you live in counted for net worth and never as money to draw down.
Any class can stay one figure or be broken down, and all of it feeds the same plan: the FIRE Planner’s corpus, the Freedom Ladder’s buckets and the Financial Freedom Index. Add a holding and every one of them moves, because there is only one set of figures.
Investments
Portfolio Tracker · XIRR and six readings
The XIRR on everything priced daily, beside the return your plan projects with — here 12.7% against 11.0%. Then six readings: return against your plan, concentration, how much is priced daily, spread across asset classes, markets and currencies, and regular contributions, combined into one score out of 100 and each stated in words as well as colour.
Three of the six are measured against you: the return your plan assumes, the years you have left, and the currency you will be spending. Somebody decades from stopping is not marked down for holding equities, and every row says what it was measured against.
Portfolio Tracker
85out of 100
Portfolio Tracker · what would move this
The pointers are ordered by how much money each one is about: what is still typed as a single figure, a position carrying too much, contributions that have stopped. Niv reads the same list — she adds no number of her own and never names a security to buy or sell.
Once three years and half of what you hold are priced, the page re-runs your whole plan at your actual return. For the illustrative household that moves the projected stop from 54 to 52 — projected, not promised.
Overview
Each one re-run through your whole projection, against the 54 it currently projects.
1Ahead of plan ₹63.86L — Returning 12.7% against the 11.0% your plan assumes, over 4.3 years.
2Not yet listed ₹10L — ₹10,00,000 of what you hold is a single figure — list it as holdings to see its return.
Portfolio Tracker · priced and value-only
A holding with a ledger and a daily close has a real return. A deposit or a figure you typed has a value and nothing else — so the page shows both totals side by side, and never an XIRR “over everything” that would be a number nobody measured.
The return is shown from the first day, and its colour waits for a year: a few weeks’ return, annualised, can look spectacular, and painting it green would be calling noise a good result.
What only Nivritee does
Portfolio trackers do not plan and FIRE calculators do not know what you hold. Here the same holdings feed both, for a whole family, in one currency. See the full comparison →
Indian mutual funds, US stocks, a UK fund and a Gulf deposit in one household figure, converted daily into your home currency.
What you hold today feeds the projection of when you could stop. Portfolio trackers do not plan; FIRE calculators do not track.
Two people, one plan, each choosing what the other sees — and your CA or lawyer sees exactly what you share, read-only.
Eleven markets’ inflation, schemes and household surveys, so your spending and your percentile are measured where you live.
Ask Niv a what-if and she runs it on your own projection and reports both figures — she never guesses at arithmetic.
No fee, no commissions, no products. Nobody at Nivritee can open your plan.
| Kind of app | Portfolio Tracker | FIRE Planner | Money Manager | Family Finance | Niv | Freedom Ladder |
|---|---|---|---|---|---|---|
| Portfolio trackers | Yes | No | No | Partly | Partly | No |
| FIRE calculators | No | Yes | Partly | Partly | No | No |
| Budgeting apps | Partly | Partly | Yes | Partly | Partly | No |
| Document vaults | No | No | No | Partly | No | No |
| Nivritee | Yes | Yes | Yes | Yes | Yes | Yes |
Questions people ask
Nivritee is one: free, with no paid tier. Add holdings from eight live venues and deposits in any of 142 currencies, and everything is converted into one currency — the one your plan is set in — at a checked daily rate.
No. There is no broker login, no account linking and no statement upload. You search for a holding and enter the units and the price you paid — or a SIP — once, and it is priced from the exchange’s own daily close every weekday after that.
NSE and BSE, Indian mutual funds, NASDAQ, NYSE, US mutual funds, the London Stock Exchange, and UK and European funds by ISIN — stocks, ETFs, index funds, ELSS, REITs, bonds, gold ETFs and Sovereign Gold Bonds. Prices are daily closes, not real time, and every page says which day they are from.
From your own ledger: every purchase, sale and SIP instalment on the date it happened, against today’s value. It is set beside the return your own plan assumes, so it answers whether what you hold is earning what your plan needs — not whether it beat an index somebody else chose.
Yes. Enter the SIP once — the amount, how often and when it started — and each instalment becomes a dated purchase on the day the mandate actually settled, at that day’s price. Weekly, fortnightly, monthly and quarterly SIPs are all supported.
No. No internal tool opens a holding or a transaction, and the administrative panel has no path that reads one. The daily price job fetches a security’s close without knowing who holds it.
Free, with no bank or broker login. About two minutes to a first plan from eight answers, then add holdings whenever you like — every reading updates from the same figures.
Start free