Across eleven markets, medical costs are projected to rise several times faster than general prices — and education sits in between
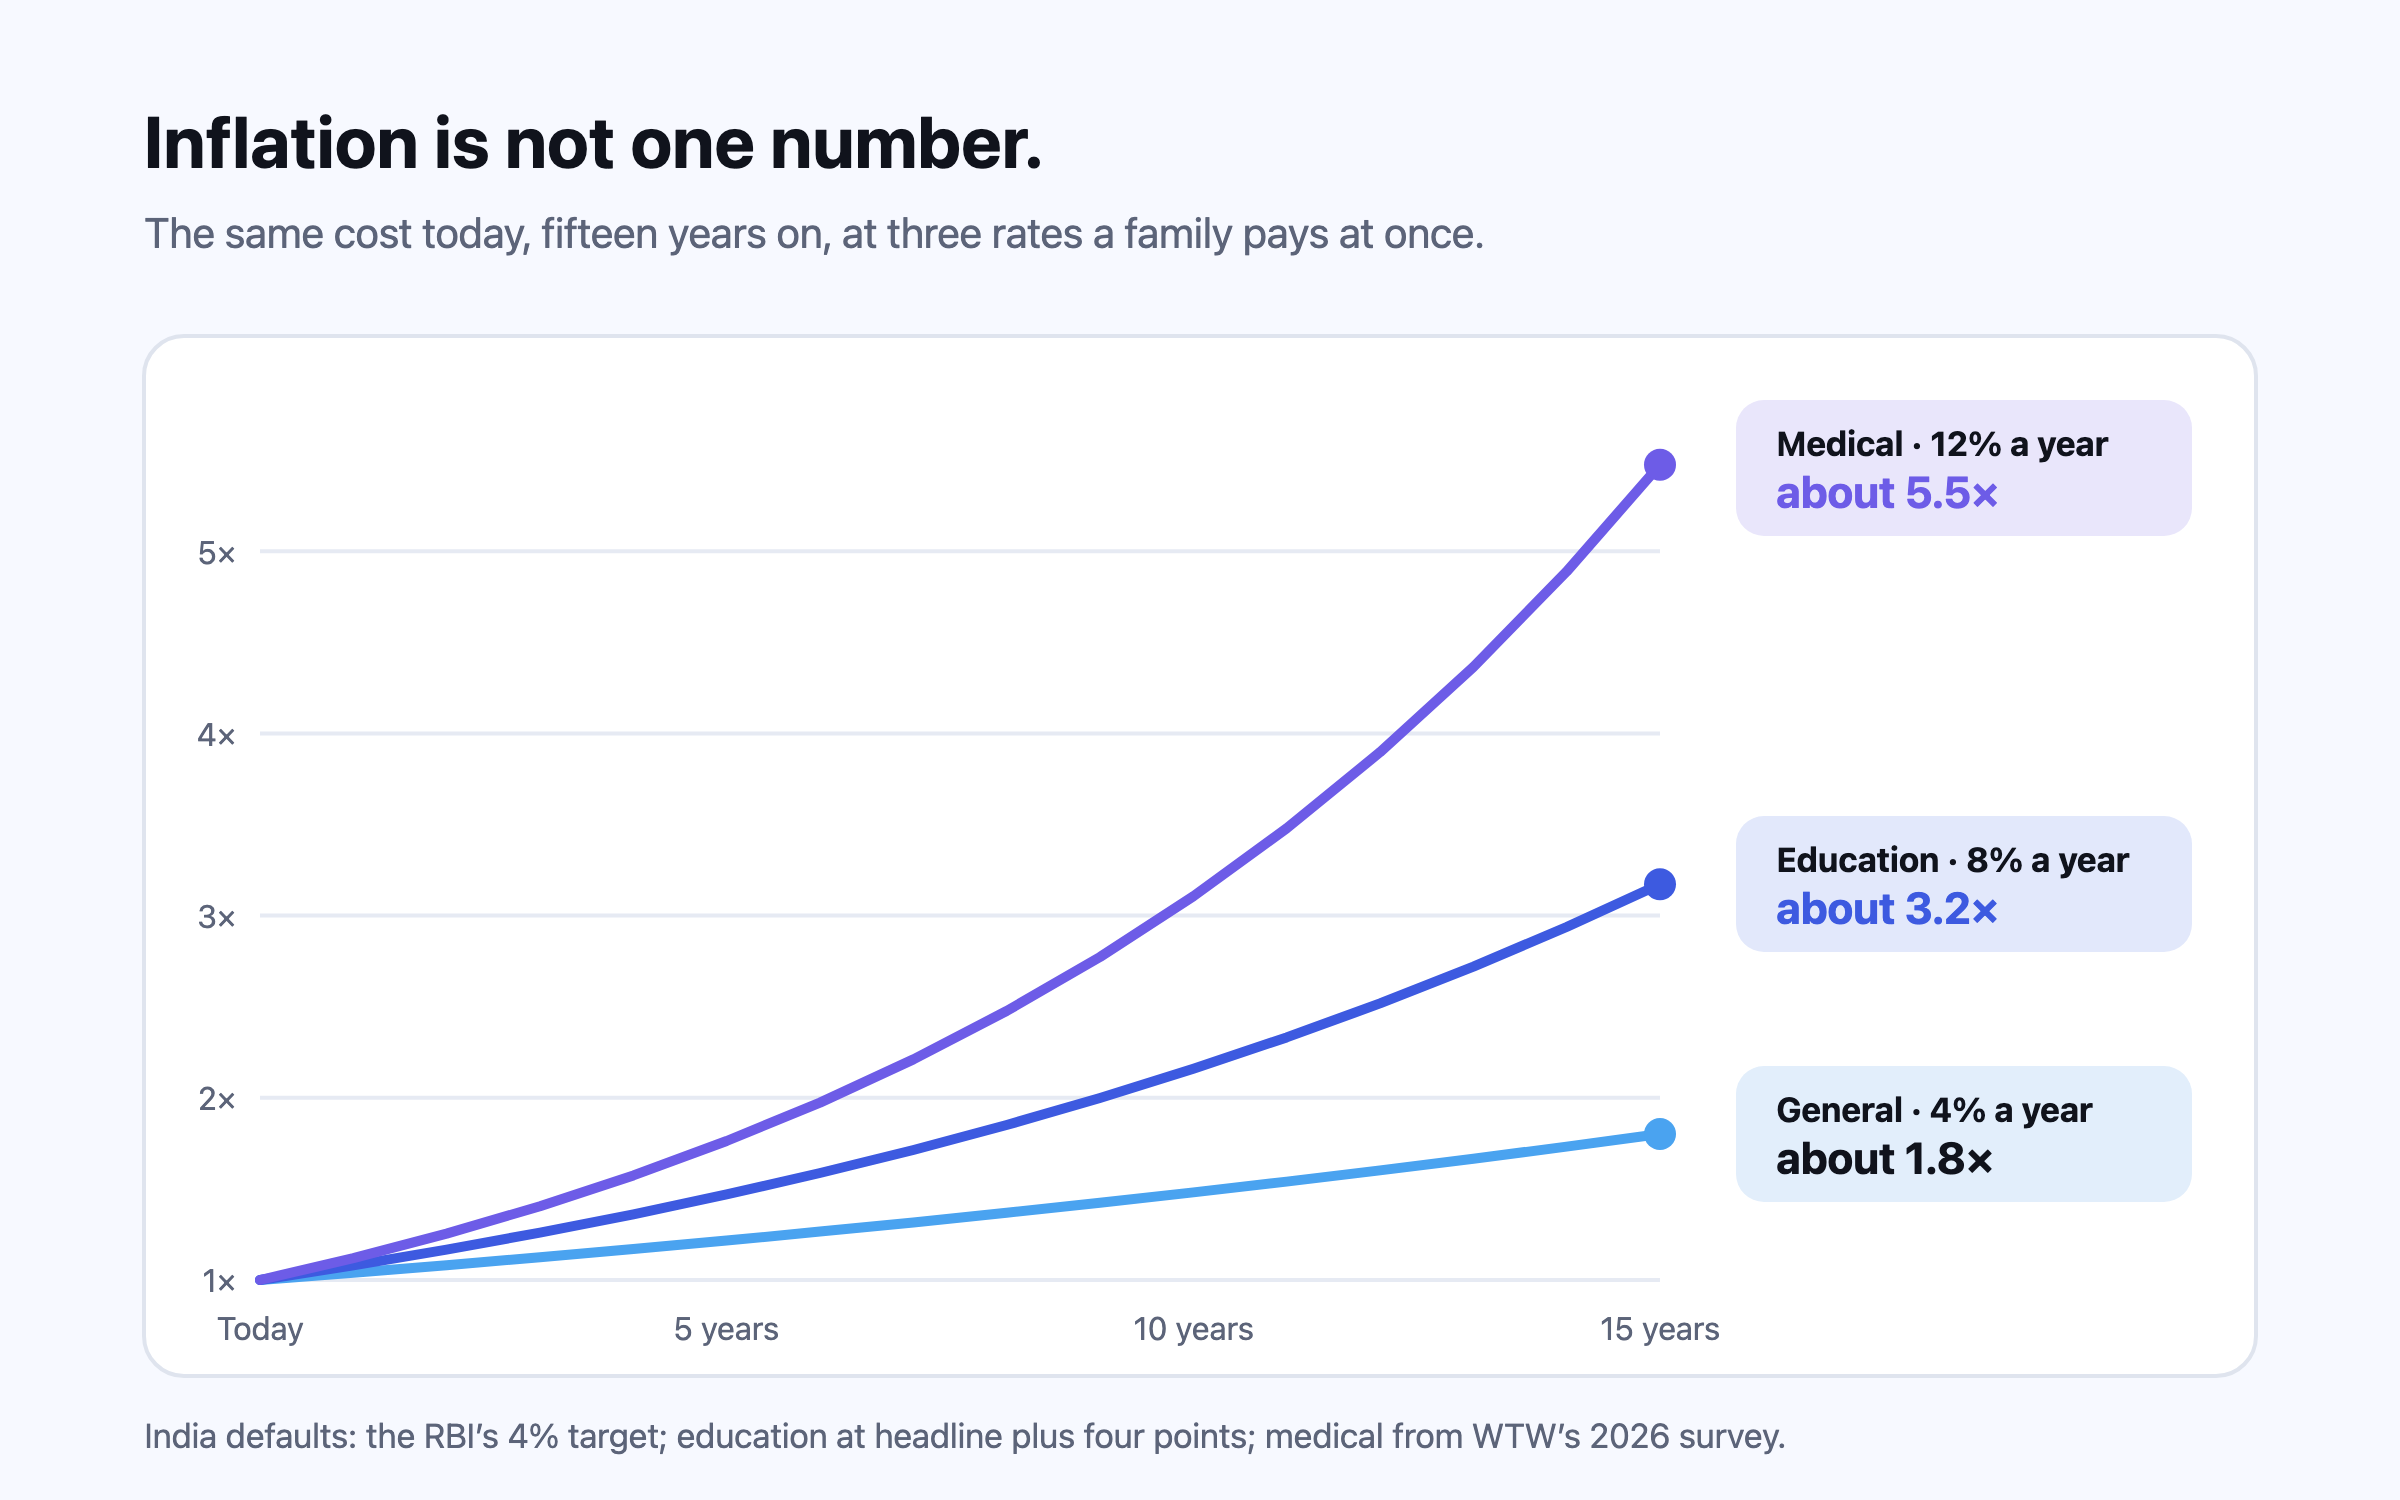
One inflation rate understates the costs that matter most to families. In the defaults Nivritee projects with, general inflation runs 2.0–4.0% across eleven markets, education 3.0–8.0% and medical 5.0–12.0%. Over fifteen years, a cost rising at 12% grows to more than five times today’s figure; at 4%, to less than twice.
Ask how fast prices are rising and most people quote one figure: the headline consumer price index. That number is the right anchor for groceries, utilities and most of a household’s spending. It is the wrong anchor for school fees and hospital bills, which in almost every economy rise faster — and which are exactly the costs families most often save for in advance.
This report sets out the three inflation rates Nivritee projects with for each of the eleven markets it plans for, where each comes from, and what the gap between them does over a planning horizon. Every figure in the table below is the product’s own default, so the rates you read here are the rates a plan starts with.
The rates, market by market
| Market | General inflation | Education inflation | Medical inflation | Return while working |
|---|---|---|---|---|
| India | 4.0% | 8.0% | 12.0% | 11.0% |
| Malaysia | 2.5% | 5.5% | 12.0% | 8.0% |
| Singapore | 2.0% | 4.5% | 11.0% | 7.0% |
| Hong Kong | 2.5% | 5.0% | 11.0% | 7.0% |
| Australia | 2.5% | 4.5% | 9.5% | 7.5% |
| New Zealand | 2.0% | 4.0% | 9.5% | 7.0% |
| United States | 2.0% | 4.5% | 9.2% | 7.5% |
| Canada | 2.0% | 4.0% | 9.2% | 7.0% |
| United Kingdom | 2.0% | 4.0% | 8.2% | 7.0% |
| Europe (euro area) | 2.0% | 3.5% | 8.2% | 6.5% |
| Japan | 2.0% | 3.0% | 5.0% | 6.0% |
2.0–4.0%1
General inflation across the eleven markets
3.0–8.0%1
Education inflation
5.0–12.0%1
Medical inflation
10.3%13
Global medical cost trend projected for 2026
General inflation: the central bank’s target
For everyday prices the defaults use the rate each central bank is mandated or committed to steer toward, rather than whatever the last few years happened to print. Over a plan that runs for decades, the target is the better anchor. The Federal Reserve, the European Central Bank, the Bank of England and the Bank of Japan each aim at 2%311129. The Bank of Canada targets the 2% midpoint of a 1–3% range4, and the Reserve Bank of New Zealand works to a 1–3% range too6. The Reserve Bank of Australia’s band is 2–3%, so its default takes the 2.5% midpoint5.
India’s 4% is the target the government has set the RBI, with a tolerance band of 2–6%, retained in March 2026 for the five years to March 20312. Three markets have no formal inflation target, and their defaults say so. Singapore’s MAS manages the exchange rate to keep core inflation low, and the default uses 2.0%7. Hong Kong’s dollar is linked to the US dollar8, importing US policy while local costs run hotter, so its default is 2.5%1. Bank Negara Malaysia pursues price stability without a numerical target; the default is 2.5%101.
Why medical costs compound faster
The medical column comes from WTW’s 2026 Global Medical Trends Survey of insurers, which projects the cost of employer medical benefits rising 10.3% globally in 2026: 14.0% in Asia Pacific, 9.2% in North America and 8.2% in Europe13. That is a benefit cost trend — what claims cost per insured person — not the medical line of the consumer price index. It includes people using more care and more expensive treatments, not only higher prices for the same visit, which is why it runs well above CPI and why it is the more useful figure for a family budgeting for its own healthcare.
The consumer price index tells the same story more quietly. In the United States, the medical care index rose about 80% between January 2005 and January 2025, against about 66% for all items1415. Japan is the deliberate exception in the table: its default of 5.0% sits well below the Asia Pacific trend of 14.0%, because a regional figure of that size does not fit an economy that spent two decades near zero inflation113.
Why education does too
There is no comparable multi-country education price series, so the education column is derived: headline inflation plus a spread of one to four points, widest where schooling and higher education are mostly private and narrowest where they are mostly state-funded1. India’s 8.0% is its 4.0% general rate plus four points; Japan’s 3.0% is its 2.0% plus one1. The direction is well established even where the size is a judgement: in the United States, the price index for tuition, other school fees and childcare roughly doubled between January 2005 and January 2025, rising about 105% while all prices rose about 66%1615.
What a few points do over fifteen years
Fifteen years is a typical distance to a child’s university fees, or from a mid-career decision to the first years after work stops. Compounded over that span, the gap between rates becomes a gap between multiples. At 4% a year a cost grows to about 1.80 times today’s figure; at 7% to about 2.76 times; at 8% to about 3.17 times; and at 12% to about 5.47 times1.
- At India’s defaults, ₹10 lakh of everyday spending today becomes about ₹18.0 lakh in fifteen years at 4.0%1.
- The same ₹10 lakh of school and college fees becomes about ₹31.7 lakh at 8.0%1.
- And ₹10 lakh of medical costs becomes about ₹54.7 lakh at 12.0% — three times the general figure from the same start1.
A plan that inflates everything at the general rate understates the education goal by roughly 43% and the medical cost by roughly two-thirds in that example1. Those are the two costs least likely to be optional when they arrive.
Projecting each cost at its own rate
The practical fix is simple to describe: tag every cost with the kind of inflation that drives it, and project each one at its own rate. That is how Nivritee’s projection works. Each expense row and each life goal carries an inflation class — general, education or medical — and every year of the projection inflates it at that class’s rate as a running price level, so a high-inflation stretch leaves prices permanently higher. A cost in another of the eleven markets rises at that country’s own rates, so UK school fees in a plan settling in India move at UK education inflation, adjusted for the inflation gap between the two countries.
Questions people ask
What is the education inflation rate in India?
There is no single official figure. Nivritee’s default for India is 8.0% a year — its 4.0% general rate plus four points, because private education costs have long outrun consumer prices1.
What is medical inflation in India?
WTW’s 2026 survey of insurers projects medical benefit costs in Asia Pacific rising 14.0% in 2026; Nivritee’s default for India is 12.0%, moderated slightly from that regional figure131.
Why is medical inflation higher than general inflation?
Because it measures what care costs per person, which rises with prices, with how much care people use and with newer, more expensive treatments. WTW projects a 10.3% global medical trend for 2026, against central bank targets of around 2–4%131.
What inflation rate should I use for financial planning?
More than one. Use your central bank’s target for everyday spending, and higher rates for education and healthcare — then test what happens if each runs higher than you assumed.
Sources
- Should I change the six assumptions? (Nivritee’s default rates by country, with their basis) — Nivritee Help Centre, 2026-10.
- Monetary Policy: overview of the flexible inflation targeting framework — Reserve Bank of India, 2026-03.
- Why does the Federal Reserve aim for inflation of 2 percent over the longer run? — Board of Governors of the Federal Reserve System, 2026.
- Inflation-control target — Bank of Canada, 2026.
- Inflation overview — Reserve Bank of Australia, 2026.
- Inflation — Reserve Bank of New Zealand, 2026.
- Monetary policy — Monetary Authority of Singapore, 2026.
- Linked Exchange Rate System — Hong Kong Monetary Authority, 2026.
- Price Stability Target of 2 Percent — Bank of Japan, 2026.
- Monetary stability — Bank Negara Malaysia, 2026.
- Monetary policy strategy — European Central Bank, 2026.
- Inflation and the 2% target — Bank of England, 2026.
- Double-digit healthcare cost increases projected to persist into 2026 and beyond (2026 Global Medical Trends Survey) — WTW, 2025-11.
- Consumer Price Index for All Urban Consumers: Medical Care in U.S. City Average (CPIMEDSL) — U.S. Bureau of Labor Statistics, via FRED, 2025-01.
- Consumer Price Index for All Urban Consumers: All Items in U.S. City Average (CPIAUCSL) — U.S. Bureau of Labor Statistics, via FRED, 2025-01.
- Consumer Price Index for All Urban Consumers: Tuition, Other School Fees, and Childcare in U.S. City Average (CUSR0000SEEB) — U.S. Bureau of Labor Statistics, via FRED, 2025-01.
This is general information, not financial, tax or legal advice for your circumstances. Rules and figures change; check the official source for your country, and consult a licensed professional before making financial decisions. Projections are estimates, not predictions.