How much is enough? What households of your age hold, in 11 countries
In every survey here, household wealth climbs steeply from the under-35s to a peak somewhere between 55 and 74, and the median sits far below the mean. Singapore, Malaysia and Hong Kong publish household income rather than wealth, so for them the honest comparison is income.
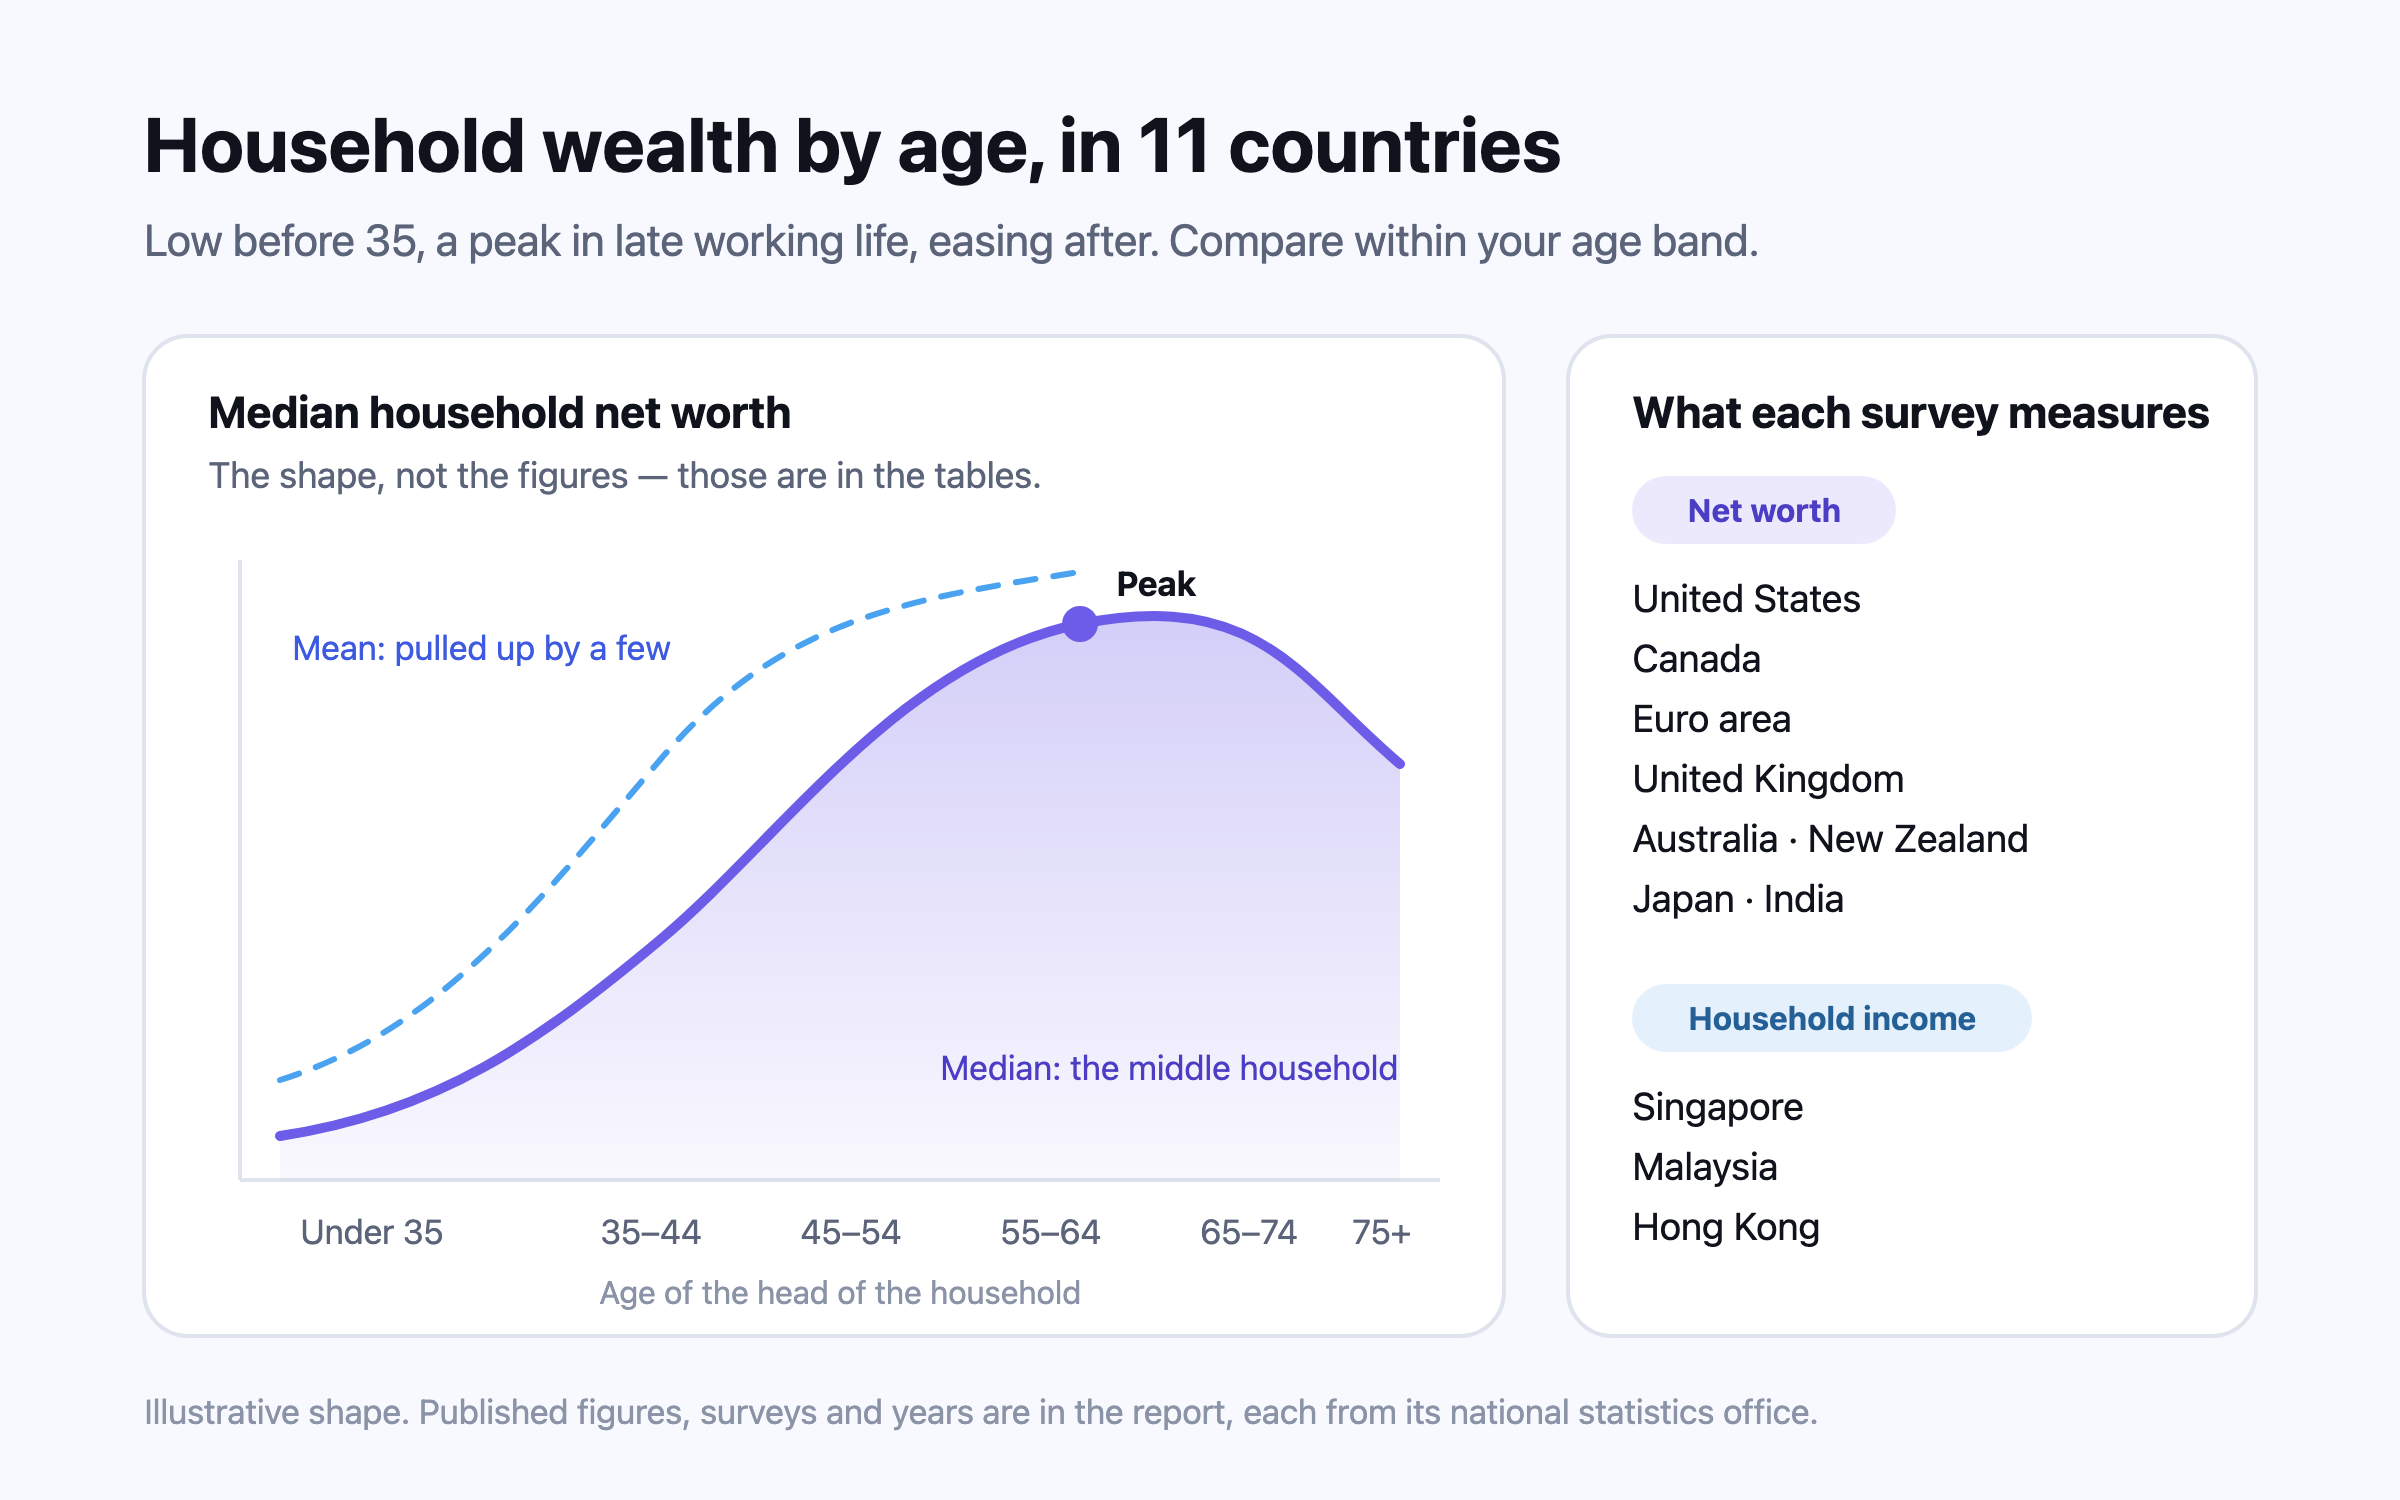
The short answer: the typical household holds very little before 35 and most of its wealth after 55. In the United States the median household headed by someone under 35 had a net worth of $39,000 in 2022, against $409,900 for those aged 65 to 741. In the euro area the same climb runs from €21,700 to a peak of €195,200 at 55 to 642. Neither figure is a target. Each is a reference point — the household exactly in the middle of its age group — and this report sets out what eleven official surveys publish, in their own currency and their own year, and what a comparison against them can and cannot tell you.
Net worth by age: the three surveys that publish medians for every band
Three of the eleven sources publish a median net worth for each decade of age: the Federal Reserve’s Survey of Consumer Finances1, Statistics Canada’s Survey of Financial Security3 and the European Central Bank’s Household Finance and Consumption Survey2. Net worth here is everything a household owns, its home included, minus everything it owes. Age is that of the person each survey treats as the head of the household.
| Age of household head | United States (SCF 2022) | Canada (SFS 2023) | Euro area (HFCS 2021) |
|---|---|---|---|
| Under 35 | $39,000 | C$159,100 | €21,700 |
| 35–44 | $135,600 | C$409,300 | €88,400 |
| 45–54 | $247,200 | C$675,800 | €146,800 |
| 55–64 | $364,500 | C$873,400 | €195,200 |
| 65–74 | $409,900 | C$738,900 (65 and over) | €185,300 |
| 75 and over | $335,600 | Included in 65 and over | €144,400 |
| All households | $192,900 | C$519,700 | €123,500 |
The shape is the same in all three, and it is the most useful thing in the table. Wealth rises roughly tenfold in the United States between the under-35 band and its peak, from $39,000 to $409,9001, and about ninefold in the euro area, from €21,700 to €195,2002. Canada’s young households start higher, at C$159,100, and peak at C$873,400 between 55 and 643. After the peak the median eases as households begin living on what they built. So a 32-year-old comparing themselves with the national figure for all ages is comparing themselves with people who have had thirty more years to save — which is why every comparison worth making is made within an age band.
Japan publishes averages, not medians
Japan’s Statistics Bureau measures total family assets — financial assets minus financial liabilities, plus residential land and the house itself — which is a household net worth. It publishes the average for each age group of household head, not the median, and it uses its own age bands, which are kept here rather than re-cut into decades nobody measured4.
| Age of household head | Japan, average total family assets (2019) |
|---|---|
| Under 30 | ¥2,568,000 |
| 30–39 | ¥8,701,000 |
| 40–49 | ¥19,035,000 |
| 50–59 | ¥29,067,000 |
| 60–69 | ¥40,351,000 |
| 70–79 | ¥40,903,000 |
| 80 and over | ¥43,860,000 |
Japan’s profile has a different character from the American one: it keeps rising into the oldest band, reaching ¥43,860,000 for households headed by someone 80 or over4. Because these are averages, they sit well above what the typical household in each band holds — the next section explains by how much that can matter.
Every market at a glance
The remaining markets publish less detail by age, and three of them publish no household wealth survey at all. The table below gives the headline figure each source publishes, what it actually measures, and whether Nivritee treats the comparison as measured or as provisional — meaning some part of the distribution around the figure is derived rather than published.
| Market | Source and year | What it measures | Published figure | Comparison |
|---|---|---|---|---|
| United States | Federal Reserve, SCF 2022 | Median household net worth | $192,900 | Measured |
| Canada | Statistics Canada, SFS 2023 | Median household net worth | C$519,700 | Measured |
| Australia | ABS, Survey of Income and Housing 2019–20 | Median household net worth | A$579,200 | Measured |
| United Kingdom | ONS, Wealth and Assets Survey, April 2020 to March 2022 | Median household total wealth (65–74: £502,500) | £293,700 | Measured |
| New Zealand | Stats NZ, year ended June 2024 | Median household net worth | NZ$529,000 | Provisional |
| Euro area | ECB, HFCS wave 2021 | Median household net wealth | €123,500 | Provisional |
| Japan | Statistics Bureau of Japan, 2019 survey | Average total family assets by age (no median published) | See table above | Provisional |
| India | NSO, All India Debt and Investment Survey (as on 30 June 2018) | Average value of assets per urban household (gross, not net) | ₹27,17,081 | Provisional |
| Singapore | SingStat, Key Household Income Trends 2025 | Median monthly household market income | S$12,446 | Provisional |
| Malaysia | DOSM, Household Income Survey 2022 | Median monthly household income (urban RM7,243; rural RM4,094) | RM6,338 | Measured |
| Hong Kong | Census and Statistics Department, General Household Survey | Household income (no wealth survey) | Not shown | Provisional |
- United Kingdom. The Office for National Statistics put median household wealth in Great Britain at £293,700, rising to £502,500 where the head of the household was 65 to 746. The survey covers Great Britain, so Northern Ireland is not included, and the ONS has suspended the survey’s accredited status while quality work is done.
- Australia and New Zealand. The Australian Bureau of Statistics published a median of A$579,200 for 2019–20, its most recent full wealth release5. Stats NZ put the median at NZ$529,000 for the year to June 20247. Neither publishes a median for every age band, so the age profile Nivritee uses for both is estimated rather than measured.
- India. The All India Debt and Investment Survey publishes the average value of assets per household — ₹27,17,081 in urban India — not net worth, not a median and not by age8. It is the best public picture available, and every reading built on it is marked provisional.
- Singapore, Malaysia and Hong Kong. None publishes a household wealth distribution, so Nivritee compares household income there instead. SingStat’s median monthly household market income was S$12,446 in 20259; Malaysia’s median monthly household income was RM6,338 in 202210. Hong Kong’s Census and Statistics Department publishes household income but no wealth survey11; its figure is left out of this table while our reference row is re-verified against the department’s latest annual median.
Medians, means, and why the household is the unit
A median is the household in the middle: half hold more, half hold less. A mean is the total divided by the number of households, and a few very wealthy households pull it far upward. In the United States the mean household net worth in 2022 was $1,063,700, about five and a half times the median of $192,9001. In the euro area the gap is narrower but still large: a mean of €292,100 against a median of €123,5002. For the question most people are really asking — am I roughly where people like me are? — the median is the right yardstick, and an average will make almost everybody feel behind.
The second rule is the unit. Every survey here measures households, not individuals, and the difference is not small: a household balance sheet usually includes two adults’ savings, one home and one set of debts. Some widely quoted cross-country reports measure wealth per adult, and comparing a family against a per-adult figure flatters the family. Nivritee compares households with households and nothing else, which is also why the comparison it shows a couple is for the two of them together.
What a peer percentile can and cannot tell you
A percentile turns one of these distributions into a single sentence: your household holds more than about N in every hundred households of your age in your country. Used well, it answers one narrow question with real evidence. It is worth knowing what it leaves out.
- It is a fact, not a verdict. Sitting below the median at 30 says nothing about whether a plan will work; a household with a modest balance and a high savings rate can be in a far stronger position than one with more money and no surplus.
- Surveys age. The newest source here is from 2025 and the oldest from 2018–19. Comparing a balance sheet today with prices from several years ago overstates where you stand, so Nivritee ages each survey forward at that country’s general inflation rate before comparing, and states how many years it adjusted for. It does not pretend to know whether wealth grew faster than prices.
- National figures include everyone, including households that are not saving at all. Somebody planning for financial independence is usually well above the middle, so a high national percentile is common among Nivritee’s users and is not, by itself, a reason to relax.
- The top is thin. Surveys capture few very wealthy households, so above a certain level any percentile is approximate, and Nivritee says so on the card rather than claiming a precise rank.
- Zero or negative net worth has no percentile. A household whose debts exceed its assets is not placed on a curve at all; it is told why, never shown a zero.
- Some markets compare income. In Singapore, Malaysia and Hong Kong the comparison is of what a household earns, because that is what those statistics offices measure.
Net worth is the difference between families’ assets and liabilities.
So how much is enough?
Enough is not the median for your age. It is the figure that pays for the life you intend to live once work becomes optional — your own spending, in your own country, inflating at its own rates, for as long as you plan to need it. That number can sit far above or well below a national median, and two households with identical net worth can be in very different places. The survey tells you where you stand; your own plan tells you whether where you stand is enough.
This report describes published statistics. It is not financial advice, and nothing in it describes any individual household.
Questions people ask
What is the median net worth by age in the US?
In the Federal Reserve’s 2022 Survey of Consumer Finances, median household net worth was $39,000 under 35, $135,600 at 35–44, $247,200 at 45–54, $364,500 at 55–64, $409,900 at 65–74 and $335,600 at 75 and over1.
What is the median net worth by age in India?
India publishes no median net worth by age. The All India Debt and Investment Survey gives the average value of assets per household — ₹27,17,081 in urban India as on 30 June 2018 — which counts assets without subtracting debts8.
Is it better to compare with the median or the average net worth?
The median, for most purposes. A few very wealthy households pull the average up: in the US the 2022 mean of $1,063,700 was about five and a half times the median of $192,9001.
Why does Singapore compare household income instead of net worth?
Singapore publishes no distribution of household wealth, so the comparison uses what SingStat does measure: median monthly household market income, S$12,446 in 20259. Malaysia and Hong Kong are compared on income for the same reason.
How much net worth should I have at my age?
No survey can say. The median for your age band is a reference point; the amount you actually need depends on the life you intend to fund, which only a plan of your own can work out.
Sources
- Survey of Consumer Finances 2022 — Changes in U.S. Family Finances from 2019 to 2022, Table 2 — Board of Governors of the Federal Reserve System, 2022.
- Household Finance and Consumption Survey, wave 2021 — Statistical Tables A3 and A4, net wealth medians and means by age of reference person, euro area — European Central Bank, 2021.
- Survey of Financial Security 2023, Table 1 — net worth by age of main income earner — Statistics Canada, 2023.
- 2019 National Survey of Family Income, Consumption and Wealth — total family assets by age group of household head — Statistics Bureau of Japan, 2019.
- Household Income and Wealth, Australia, 2019-20 — household net worth — Australian Bureau of Statistics, 2020.
- Household total wealth in Great Britain, April 2020 to March 2022 (Wealth and Assets Survey, Round 8) — Office for National Statistics, 2022.
- Household net worth statistics: year ended June 2024 — Stats NZ (Tatauranga Aotearoa), 2024.
- All India Debt and Investment Survey, NSS 77th round — average value of assets per household — National Statistical Office, Ministry of Statistics and Programme Implementation, 2019.
- Key Household Income Trends, 2025 — median monthly household market income, resident households — Singapore Department of Statistics (SingStat), 2025.
- Household Income Survey Report 2022 — household income by state, urban and rural — Department of Statistics Malaysia (DOSM), 2022.
- Household income distribution, General Household Survey — Census and Statistics Department, Hong Kong SAR, 2025.
This is general information, not financial, tax or legal advice for your circumstances. Rules and figures change; check the official source for your country, and consult a licensed professional before making financial decisions. Projections are estimates, not predictions.