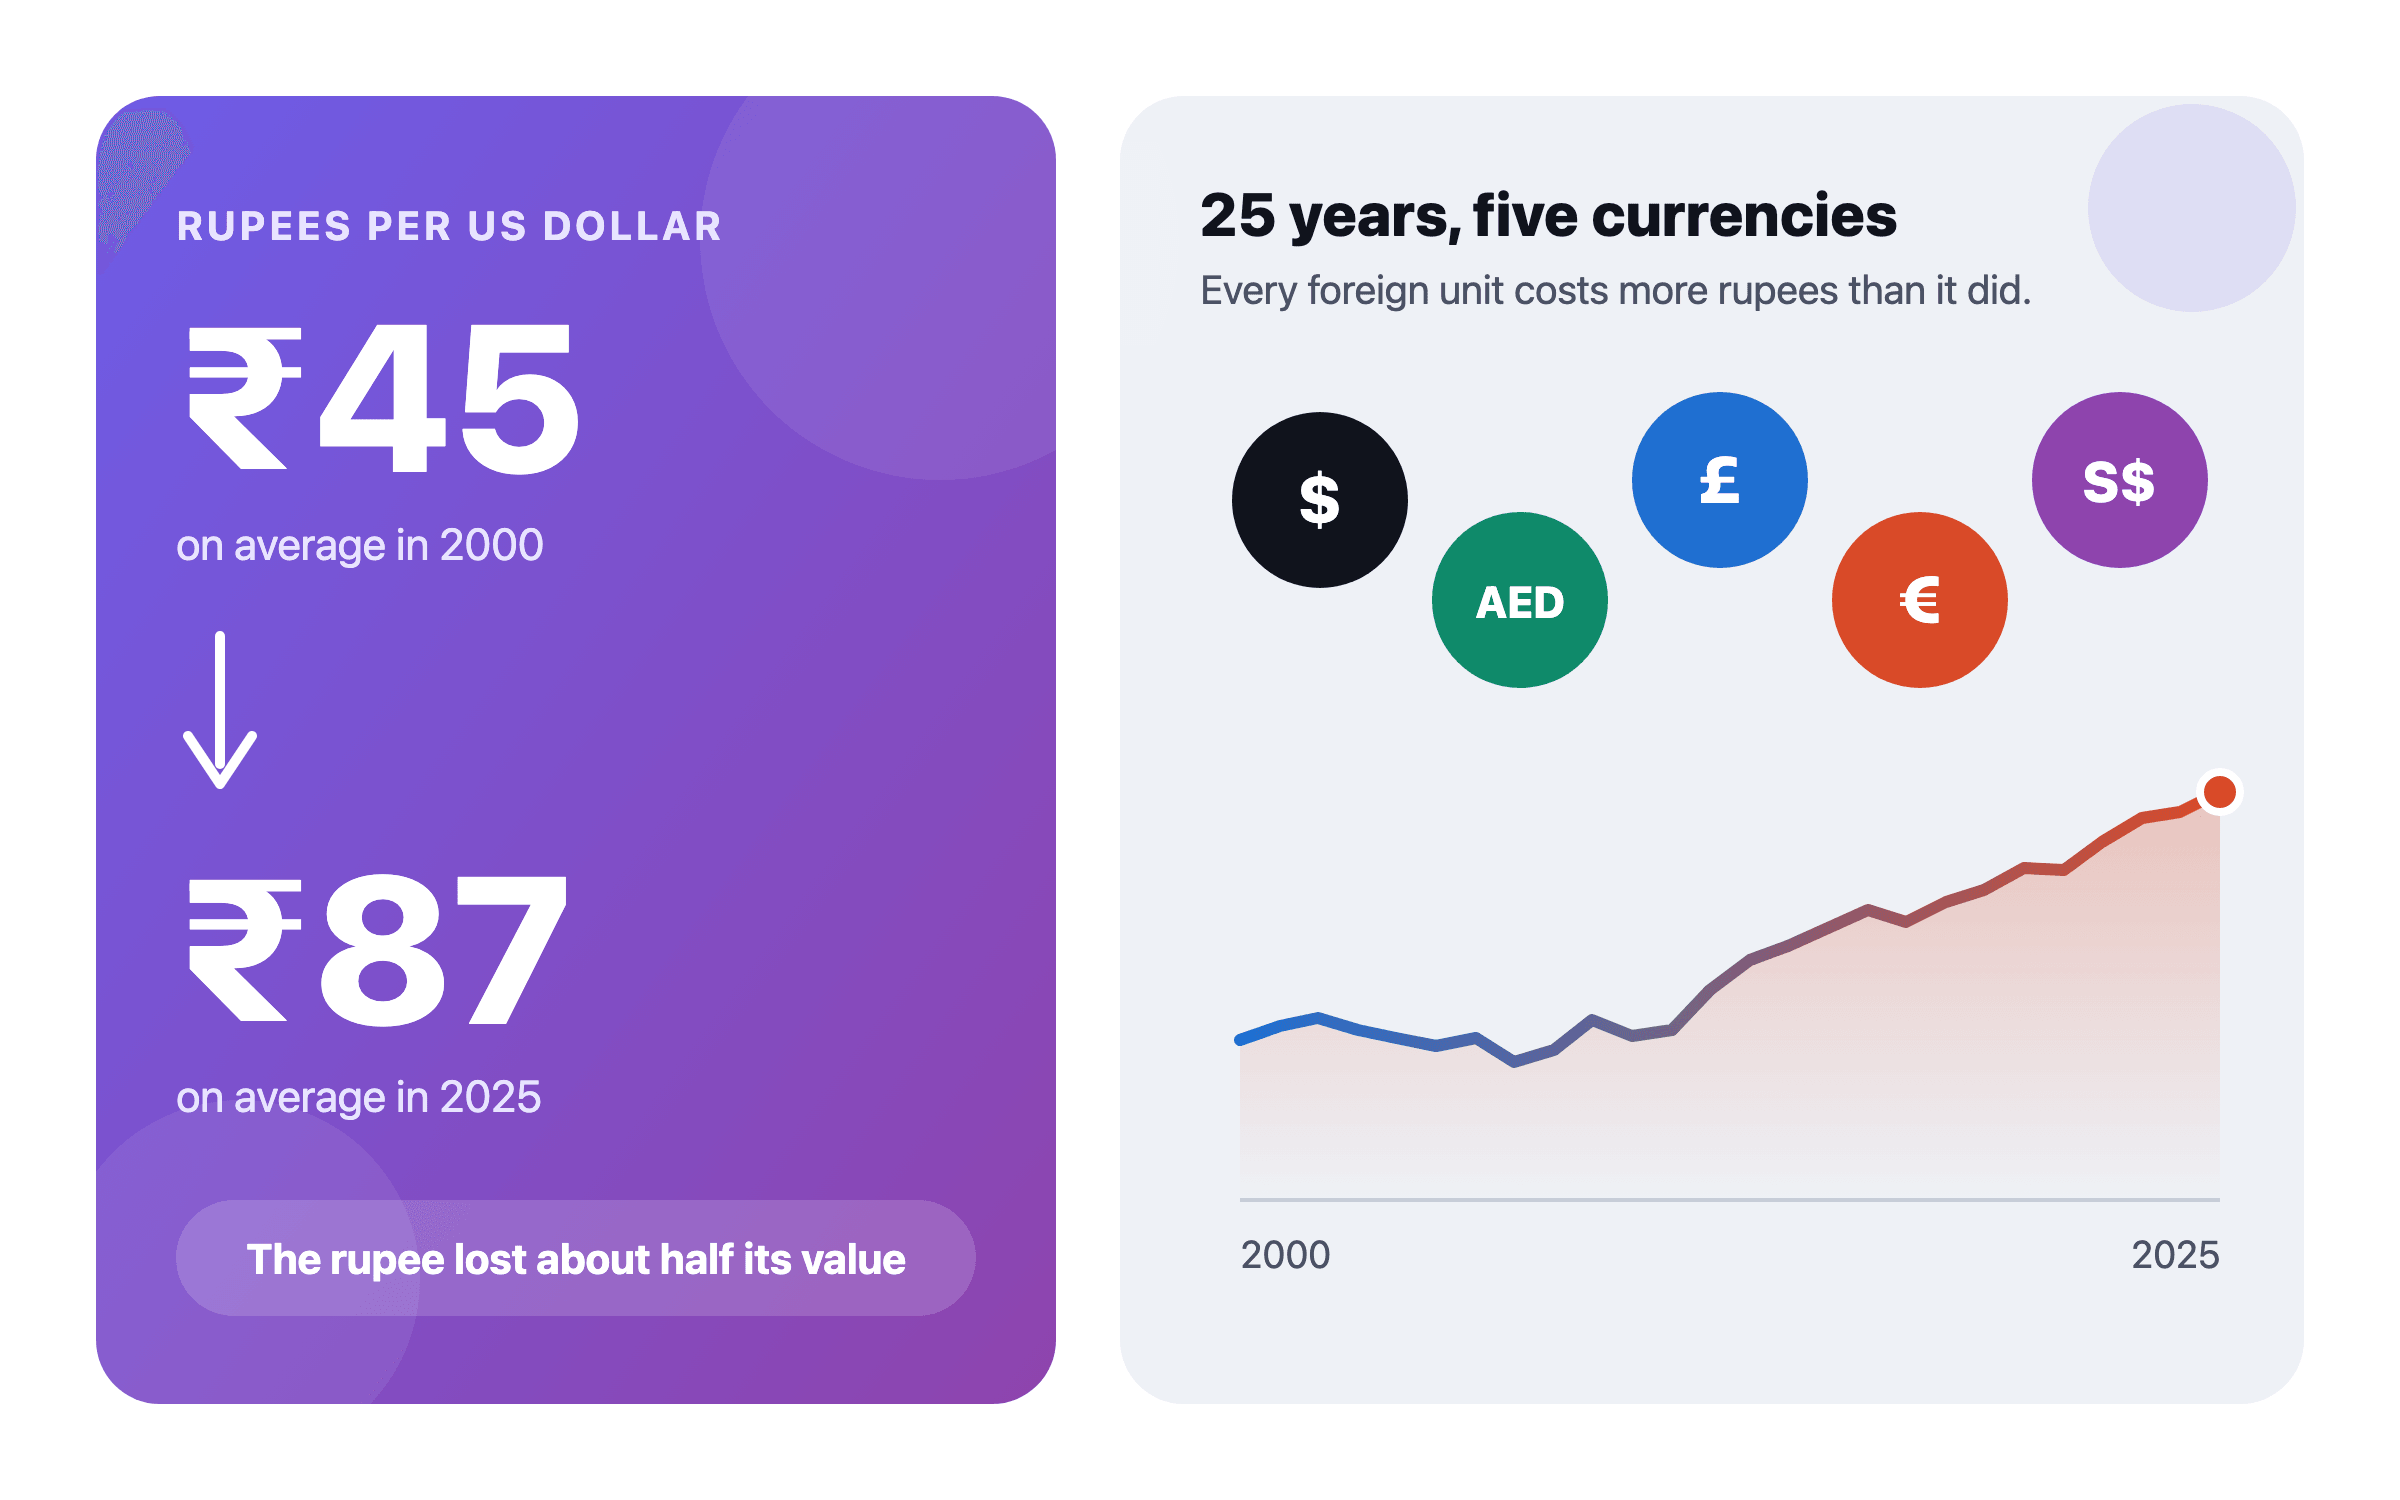
Since 2000 the rupee has lost about half its value against the dollar, but less than the gap between Indian and American inflation would predict.
A dollar bought ₹45 on average in 2000 and ₹87 in 2025, a fall of about 2.7% a year, and the dirham moved exactly with it. The pound fell less and the euro and Singapore dollar more. Higher inflation in India explains the direction; for an NRI the lesson is to judge savings in the currency they will finally be spent in.
Nivritee Research · 17 July 2026 · updated 15 October 2026 · 5 min read
In 2000 a US dollar bought ₹45.00 on average. In 2025 it bought ₹87.151. In 2026 to early October the average was ₹94.05, and on 9 October a dollar bought ₹96.732. Over the 25 years to 2025 the rupee lost about 48% of its value against the dollar; put the other way, the rupee price of a dollar rose by 2.68% a year on average1. This report sets out the rupee against five currencies Indian families abroad earn in, explains why it has fallen, and works through what that did to savings held on each side.
Twenty-five years in five currencies
Annual averages of daily rates. The dollar column is the Federal Reserve’s rupee-dollar series; the others are derived from it and from the Federal Reserve’s pound, euro and Singapore dollar series, and from the dirham’s fixed rate of 3.6725 to the dollar. 2026 is the average of the published days to 9 October. 1,2,3,4,5,6
Year
Rupees per US dollar
per UAE dirham
per UK pound
per euro
per Singapore dollar
2000
45.00
12.25
68.20
41.54
26.09
2005
44.00
11.98
80.10
54.78
26.44
2010
45.65
12.43
70.54
60.54
33.50
2015
64.11
17.46
97.98
71.13
46.64
2020
74.14
20.19
95.12
84.60
53.73
2025
87.15
23.73
114.96
98.53
66.70
2026 (January to 9 October)
94.05
25.61
126.42
109.07
73.56
Rupees needed to buy one unit of five foreign currencies, yearly averages, 2000 to 2025.
UK pound
Euro
US dollar
Singapore dollar
UAE dirham
A rising line is a weaker rupee. Every line rose, but not evenly: the rupee barely moved against the dollar in the 2000s and fell fastest from 2011 to 2013. The dirham line is the dollar line divided by 3.6725, because the dirham is fixed to the dollar. 1,3,4,5,6The figures in this chart
UK pound
Euro
US dollar
Singapore dollar
UAE dirham
2000
₹68.20
₹41.54
₹45.00
₹26.09
₹12.25
2001
₹67.98
₹42.27
₹47.22
₹26.34
₹12.86
2002
₹73.06
₹45.97
₹48.63
₹27.15
₹13.24
2003
₹76.16
₹52.75
₹46.59
₹26.73
₹12.69
2004
₹82.96
₹56.30
₹45.26
₹26.78
₹12.32
2005
₹80.10
₹54.78
₹44.00
₹26.44
₹11.98
2006
₹83.30
₹56.77
₹45.19
₹28.45
₹12.30
2007
₹82.44
₹56.46
₹41.18
₹27.33
₹11.21
2008
₹80.46
₹63.89
₹43.39
₹30.68
₹11.81
2009
₹75.69
₹67.35
₹48.33
₹33.23
₹13.16
2010
₹70.54
₹60.54
₹45.65
₹33.50
₹12.43
2011
₹74.73
₹64.89
₹46.58
₹37.07
₹12.68
2012
₹84.61
₹68.63
₹53.37
₹42.73
₹14.53
2013
₹91.53
₹77.71
₹58.51
₹46.77
₹15.93
2014
₹100.54
₹81.11
₹61.00
₹48.16
₹16.61
2015
₹97.98
₹71.13
₹64.11
₹46.64
₹17.46
2016
₹91.03
₹74.36
₹67.16
₹48.66
₹18.29
2017
₹83.87
₹73.53
₹65.07
₹47.14
₹17.72
2018
₹91.37
₹80.80
₹68.37
₹50.70
₹18.62
2019
₹89.86
₹78.78
₹70.38
₹51.59
₹19.16
2020
₹95.12
₹84.60
₹74.14
₹53.73
₹20.19
2021
₹101.76
₹87.47
₹73.94
₹55.02
₹20.13
2022
₹97.21
₹82.78
₹78.58
₹57.00
₹21.40
2023
₹102.72
₹89.32
₹82.57
₹61.49
₹22.48
2024
₹106.92
₹90.52
₹83.66
₹62.60
₹22.78
2025
₹114.96
₹98.53
₹87.15
₹66.70
₹23.73
The dirham line is the dollar line in miniature. The UAE dirham has been formally pegged to the US dollar at 3.6725 since November 1997, by Gulf News’s account of the currency’s history7, and the Central Bank of the UAE still published that rate in 20266, so the rupee’s path against the dirham is the same, to the decimal, as its path against the dollar. The same is broadly true of the other Gulf currencies tied to the dollar, which is why a Gulf salary is, for this purpose, a dollar salary.
The average yearly fall, and why the average misleads
The usual way to state a currency’s fall is the yearly rise in what the other currency costs in it. Measured from the 2000 average to the 2025 average, the rupee price of a dollar or a dirham rose by 2.68% a year, of a pound by 2.11%, of a euro by 3.51% and of a Singapore dollar by 3.83%1,3,4,5. The pound itself weakened against the dollar over the period, so the rupee lost least to it; the euro and especially the Singapore dollar strengthened against the dollar, so the rupee lost more to them.
How fast the rupee price of each currency rose, on average, from 2000 to 2025.
Compound yearly rate of change between the 2000 and 2025 annual averages. A taller bar means the rupee weakened faster against that currency. 1,3,4,5,6The figures in this chart
Average yearly rise in rupees per unit, %
UK pound
2.11%
US dollar
2.68%
UAE dirham
2.68%
Euro
3.51%
Singapore dollar
3.83%
An average of 2.68% a year never happened in any particular year. Between the 2000 and 2005 averages the rupee price of a dollar actually fell slightly, by 0.45% a year, and from 2006 to 2007 it fell by about 9% as the rupee strengthened1. Then from 2010 to 2015 it rose by 7.03% a year, and a dollar cost 14.6% more rupees on average in 2012 than in 20111. Anyone who planned in 2007 on the rupee holding steady, or in 2013 on it collapsing, was wrong both times.
How fast the rupee price of a dollar changed in each five-year period.
Compound yearly rate between annual averages. The long-run figure is an average of quiet stretches and sharp falls, which is why a plan should allow for both rather than assume a steady slide. 1The figures in this chart
Average yearly change in rupees per dollar, % (negative: the rupee rose)
2000 to 2005
−0.45%
2005 to 2010
0.74%
2010 to 2015
7.03%
2015 to 2020
2.95%
2020 to 2025
3.28%
Why the rupee falls: the inflation gap
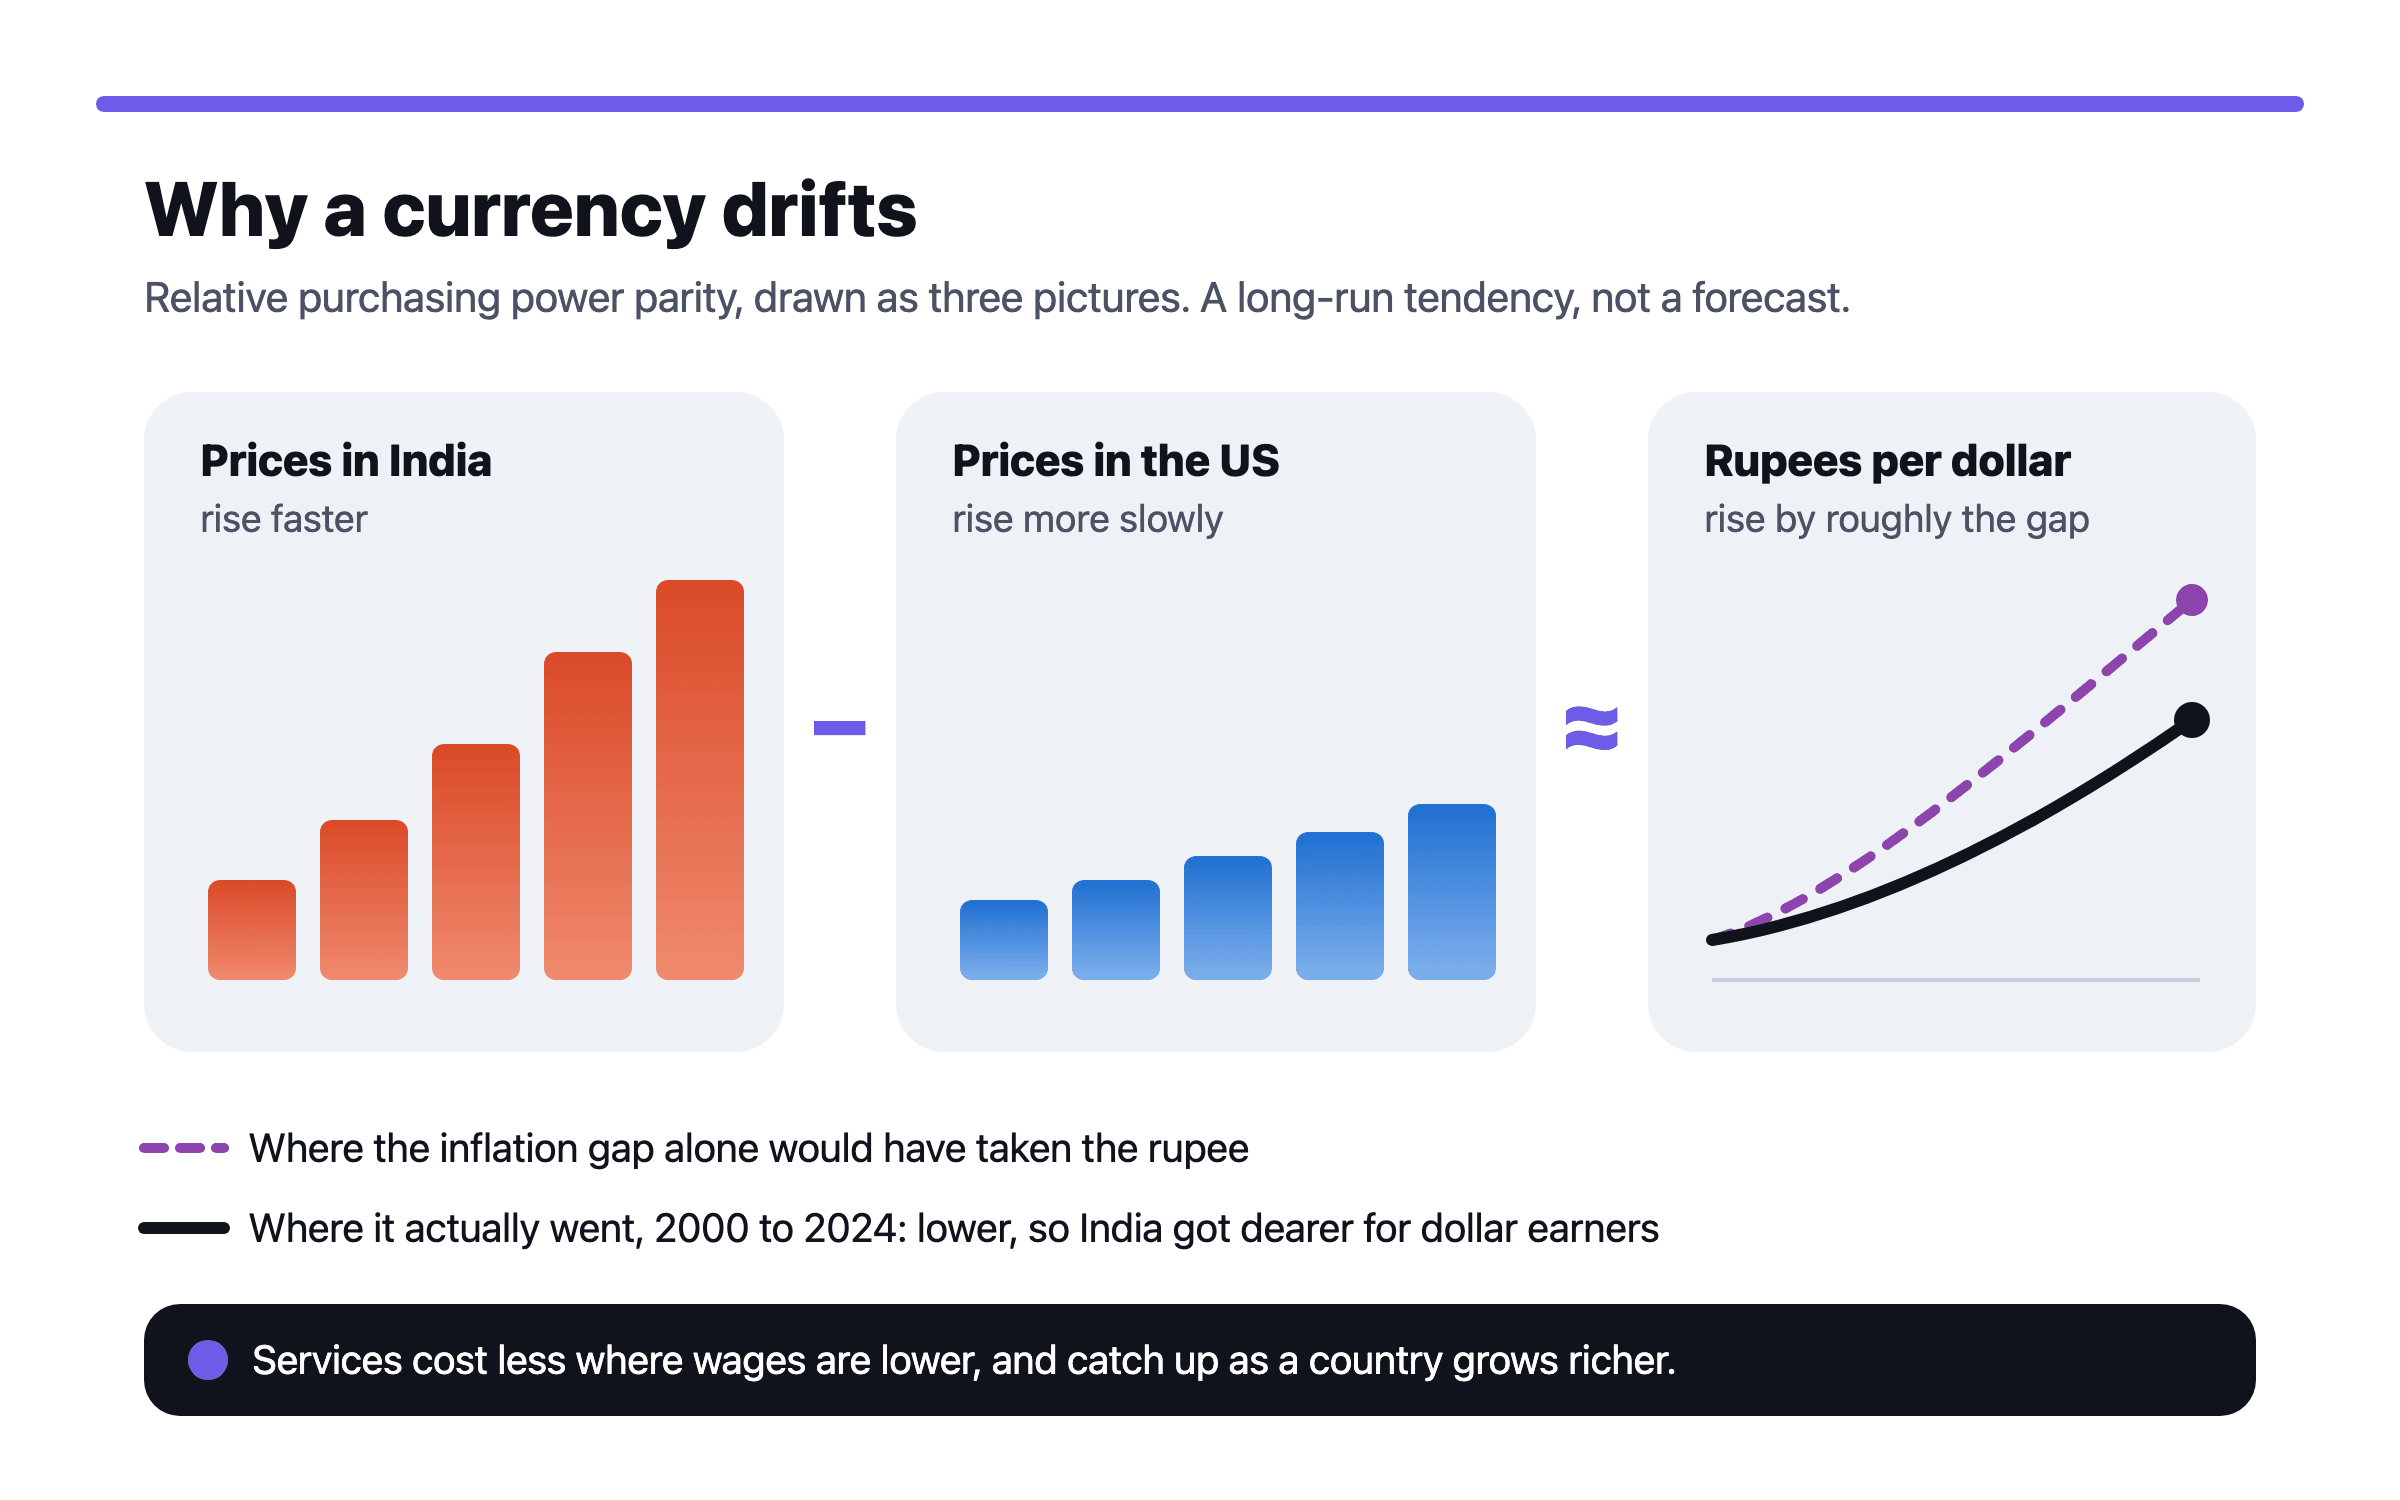
The usual explanation is relative purchasing power parity: over long periods, a currency tends to weaken against another by roughly the gap between their inflation rates, because otherwise goods in one would keep getting cheaper than in the other. From 2001 to 2024 consumer prices in India rose by 6.15% a year on average, and in the US by 2.53%, so India’s price level multiplied by 4.19 while America’s multiplied by 1.828,9.
Average yearly rise in the rupee price of a dollar, 2000 to 2024
If the exchange rate had tracked that gap exactly, a dollar would have cost about ₹103.47 in 2024. It cost ₹83.661,8,9. The rupee fell, but by less than the inflation gap implied, so over these years India became more expensive for a dollar earner, not less. Part of the usual explanation is that services, which are labour-intensive and depend on local wages, cost less in lower-income countries10. As a country grows richer, those prices tend to rise towards richer countries’ levels, which lifts its inflation without a matching fall in its currency.
Relative purchasing power parity: when one country’s prices rise faster than another’s, its currency tends to weaken by roughly the difference. It is a long-run tendency, not a forecast for any one year.
That catching up still has a long way to run. The World Bank’s purchasing power parity for household consumption in India was ₹19.90 per international dollar in 2024, against a market rate of ₹83.6611,1. Put simply, converted at the market rate, what Indian households buy cost about 24% of what the same basket cost in the US. And if the inflation gap narrows, so may the pace of the rupee’s fall. India has targeted 4% consumer price inflation, within a band of 2% to 6%, since August 2016, and in March 2026 the target was kept for the five years to March 203112. Indian inflation was 2.40% in 20258.
What it did to an NRI’s savings
Take two illustrative siblings who each set aside $10,000 in 2000, when that was worth ₹4,49,975 at the year’s average rate1. One keeps dollars; the other converts to rupees. To isolate the currency, assume neither earns any interest. By 2025 the dollars were worth ₹8,71,468, nearly twice the rupee sibling’s unchanged ₹4,49,9751.
Now ask what each could buy. Indian consumer prices rose 4.29 times from 2000 to 2025, so a basket that cost ₹4,49,975 in 2000 cost about ₹19.30 lakh in 20258. In India the dollar sibling could buy 45% of that basket and the rupee sibling 23%. Spent in the US instead, and measured in 2024, the latest year of US inflation in the series, the rupee sibling’s money was worth $5,379 at the 2024 rate, against prices that had risen 1.82 times since 2000, so it bought 30% of the original basket and the dollar sibling’s $10,000 bought 55%1,9.
Judge savings in the currency you will spend
The question is never whether the rupee is strong or weak. It is which currency your later life will be paid in. A household that will settle in India carries rupee costs; dollar or dirham savings are a bet that the rupee keeps falling, which has usually paid but not in every five-year stretch. A household that will stay in Dubai, London or Singapore carries costs in that currency, and rupee savings are the bet. Our article on home bias and currency risk works through how to hold both without losing the match.
Measure the corpus in the spending currency. A balance that grew in dollars grew by more in rupees whenever the rupee fell; only the figure in the currency of your future shopping says how far it will go.
Do not plan on a steady slide. In the five-year stretches above, the rupee price of a dollar changed by anything from a fall of 0.45% a year to a rise of 7.03% a year1. A plan that only works if the rupee keeps falling at its average rate is a currency bet.
Keep near-term money in the currency it will be spent in. Money for a home purchase in India in two years has no time to recover from a bad exchange-rate year.
Remember the cost of crossing. Every conversion costs something, and small, frequent transfers cost more; see what sending money home costs.
Reading the rupee from here
Nobody can tell you where the rupee will be next year, and the history above is a record, not a forecast. What it does support is a habit: plan in the currency you will spend, assume costs abroad rise with that country’s inflation, and treat any gain from the rupee’s fall as a bonus rather than a foundation. If you expect to move back, the moving-back checklist covers what happens to NRE and FCNR accounts, and Gulf earners can see how gratuity and pensions behave when you move.
Questions people ask
How much has the rupee fallen against the dollar since 2000?
From ₹45.00 per dollar on average in 2000 to ₹87.15 in 2025, a loss of about 48% of its dollar value; the rupee price of a dollar rose by 2.68% a year1. In 2026 to early October the average was ₹94.052.
Why does the rupee keep falling against the dollar?
Mainly because prices in India have risen faster than in the US: 6.15% a year against 2.53% from 2001 to 20248,9. Over long periods currencies tend to weaken by roughly their inflation gap, though the rupee fell by less than that gap implied.
Why is the AED to INR rate the same pattern as USD to INR?
The UAE dirham is pegged to the dollar at 3.6725, so rupees per dirham are rupees per dollar divided by 3.67256. A dirham bought ₹12.25 on average in 2000 and ₹23.73 in 2025.
Should an NRI keep savings in rupees or dollars?
It depends on where the money will be spent, not on a view about the rupee. Savings that match the currency of your future costs remove one risk; anything else is a currency bet, and over five-year stretches the rupee price of a dollar has changed by anything from a 0.45% yearly fall to a 7.03% yearly rise1.
What was the rupee’s average annual depreciation?
Measured as the yearly rise in the rupee price of each currency between the 2000 and 2025 annual averages, it was 2.68% against the dollar, 2.11% against the pound, 3.51% against the euro and 3.83% against the Singapore dollar1,3,4,5.
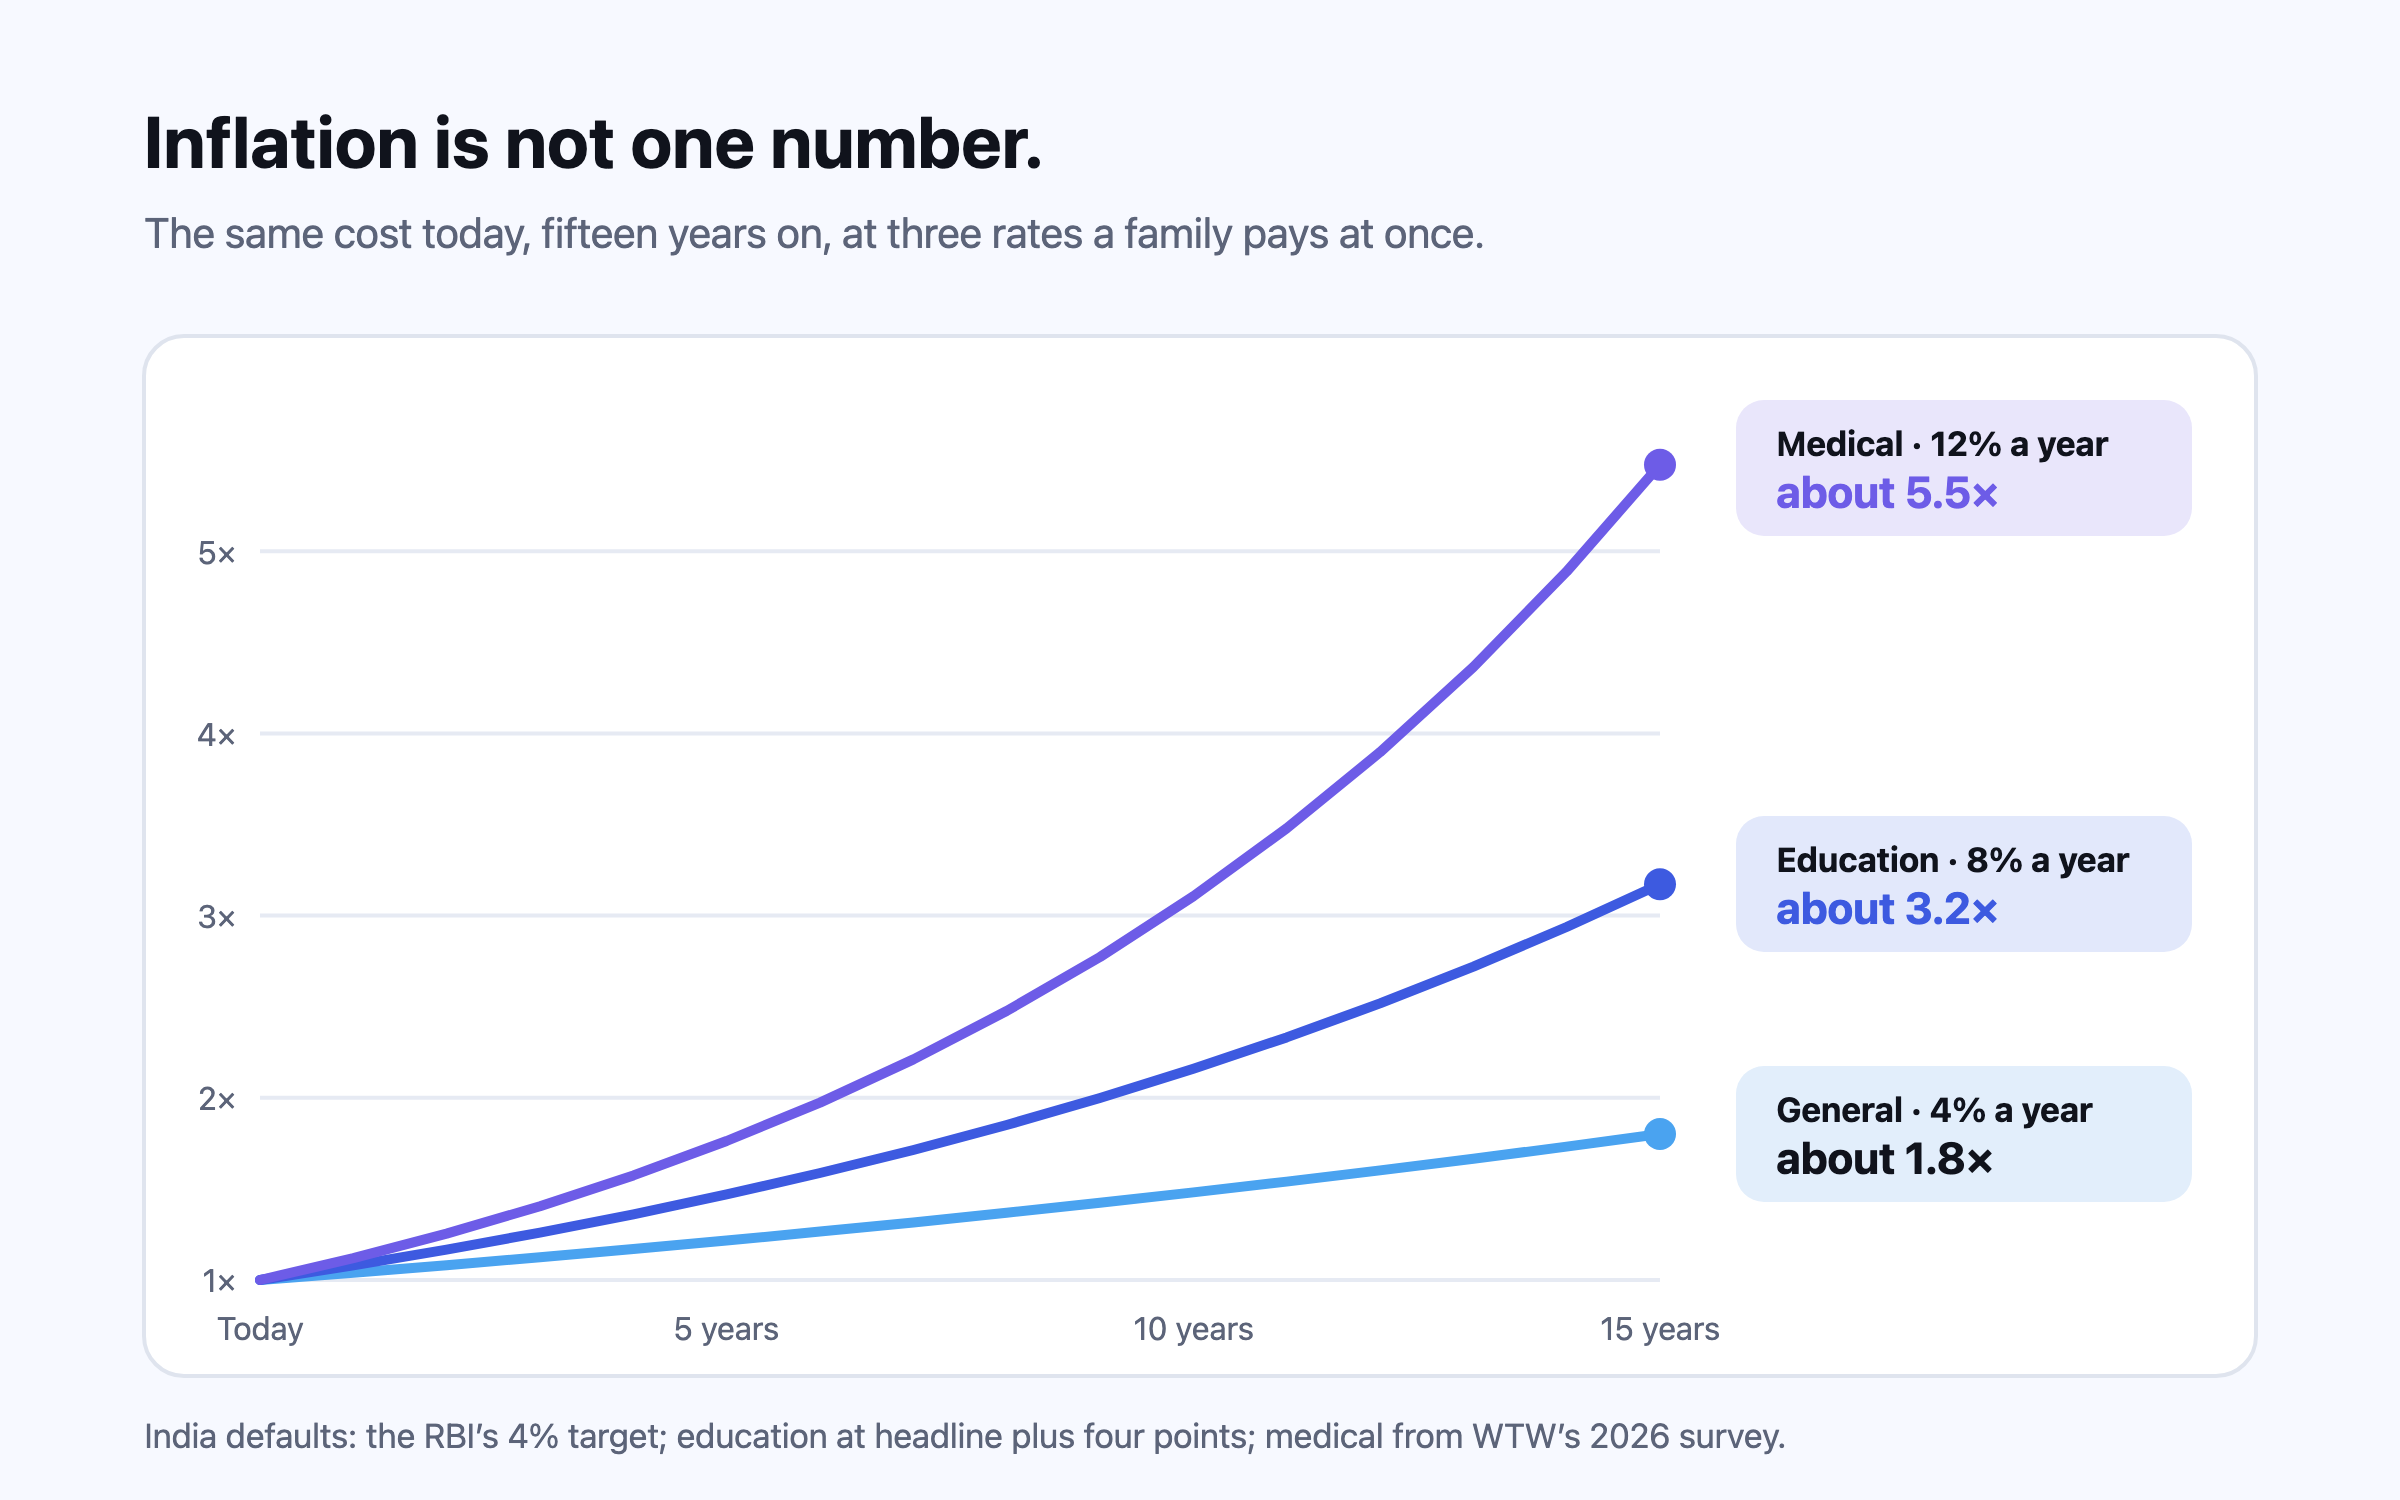
One inflation rate understates the costs that matter most to families. In the defaults Nivritee projects with, general inflation runs 2.0–4.0% across eleven markets, education 3.0–8.0% and medical 5.0–12.0%. Over fifteen years, a cost rising at 12% grows to more than five times today’s figure; at 4%, to less than twice.
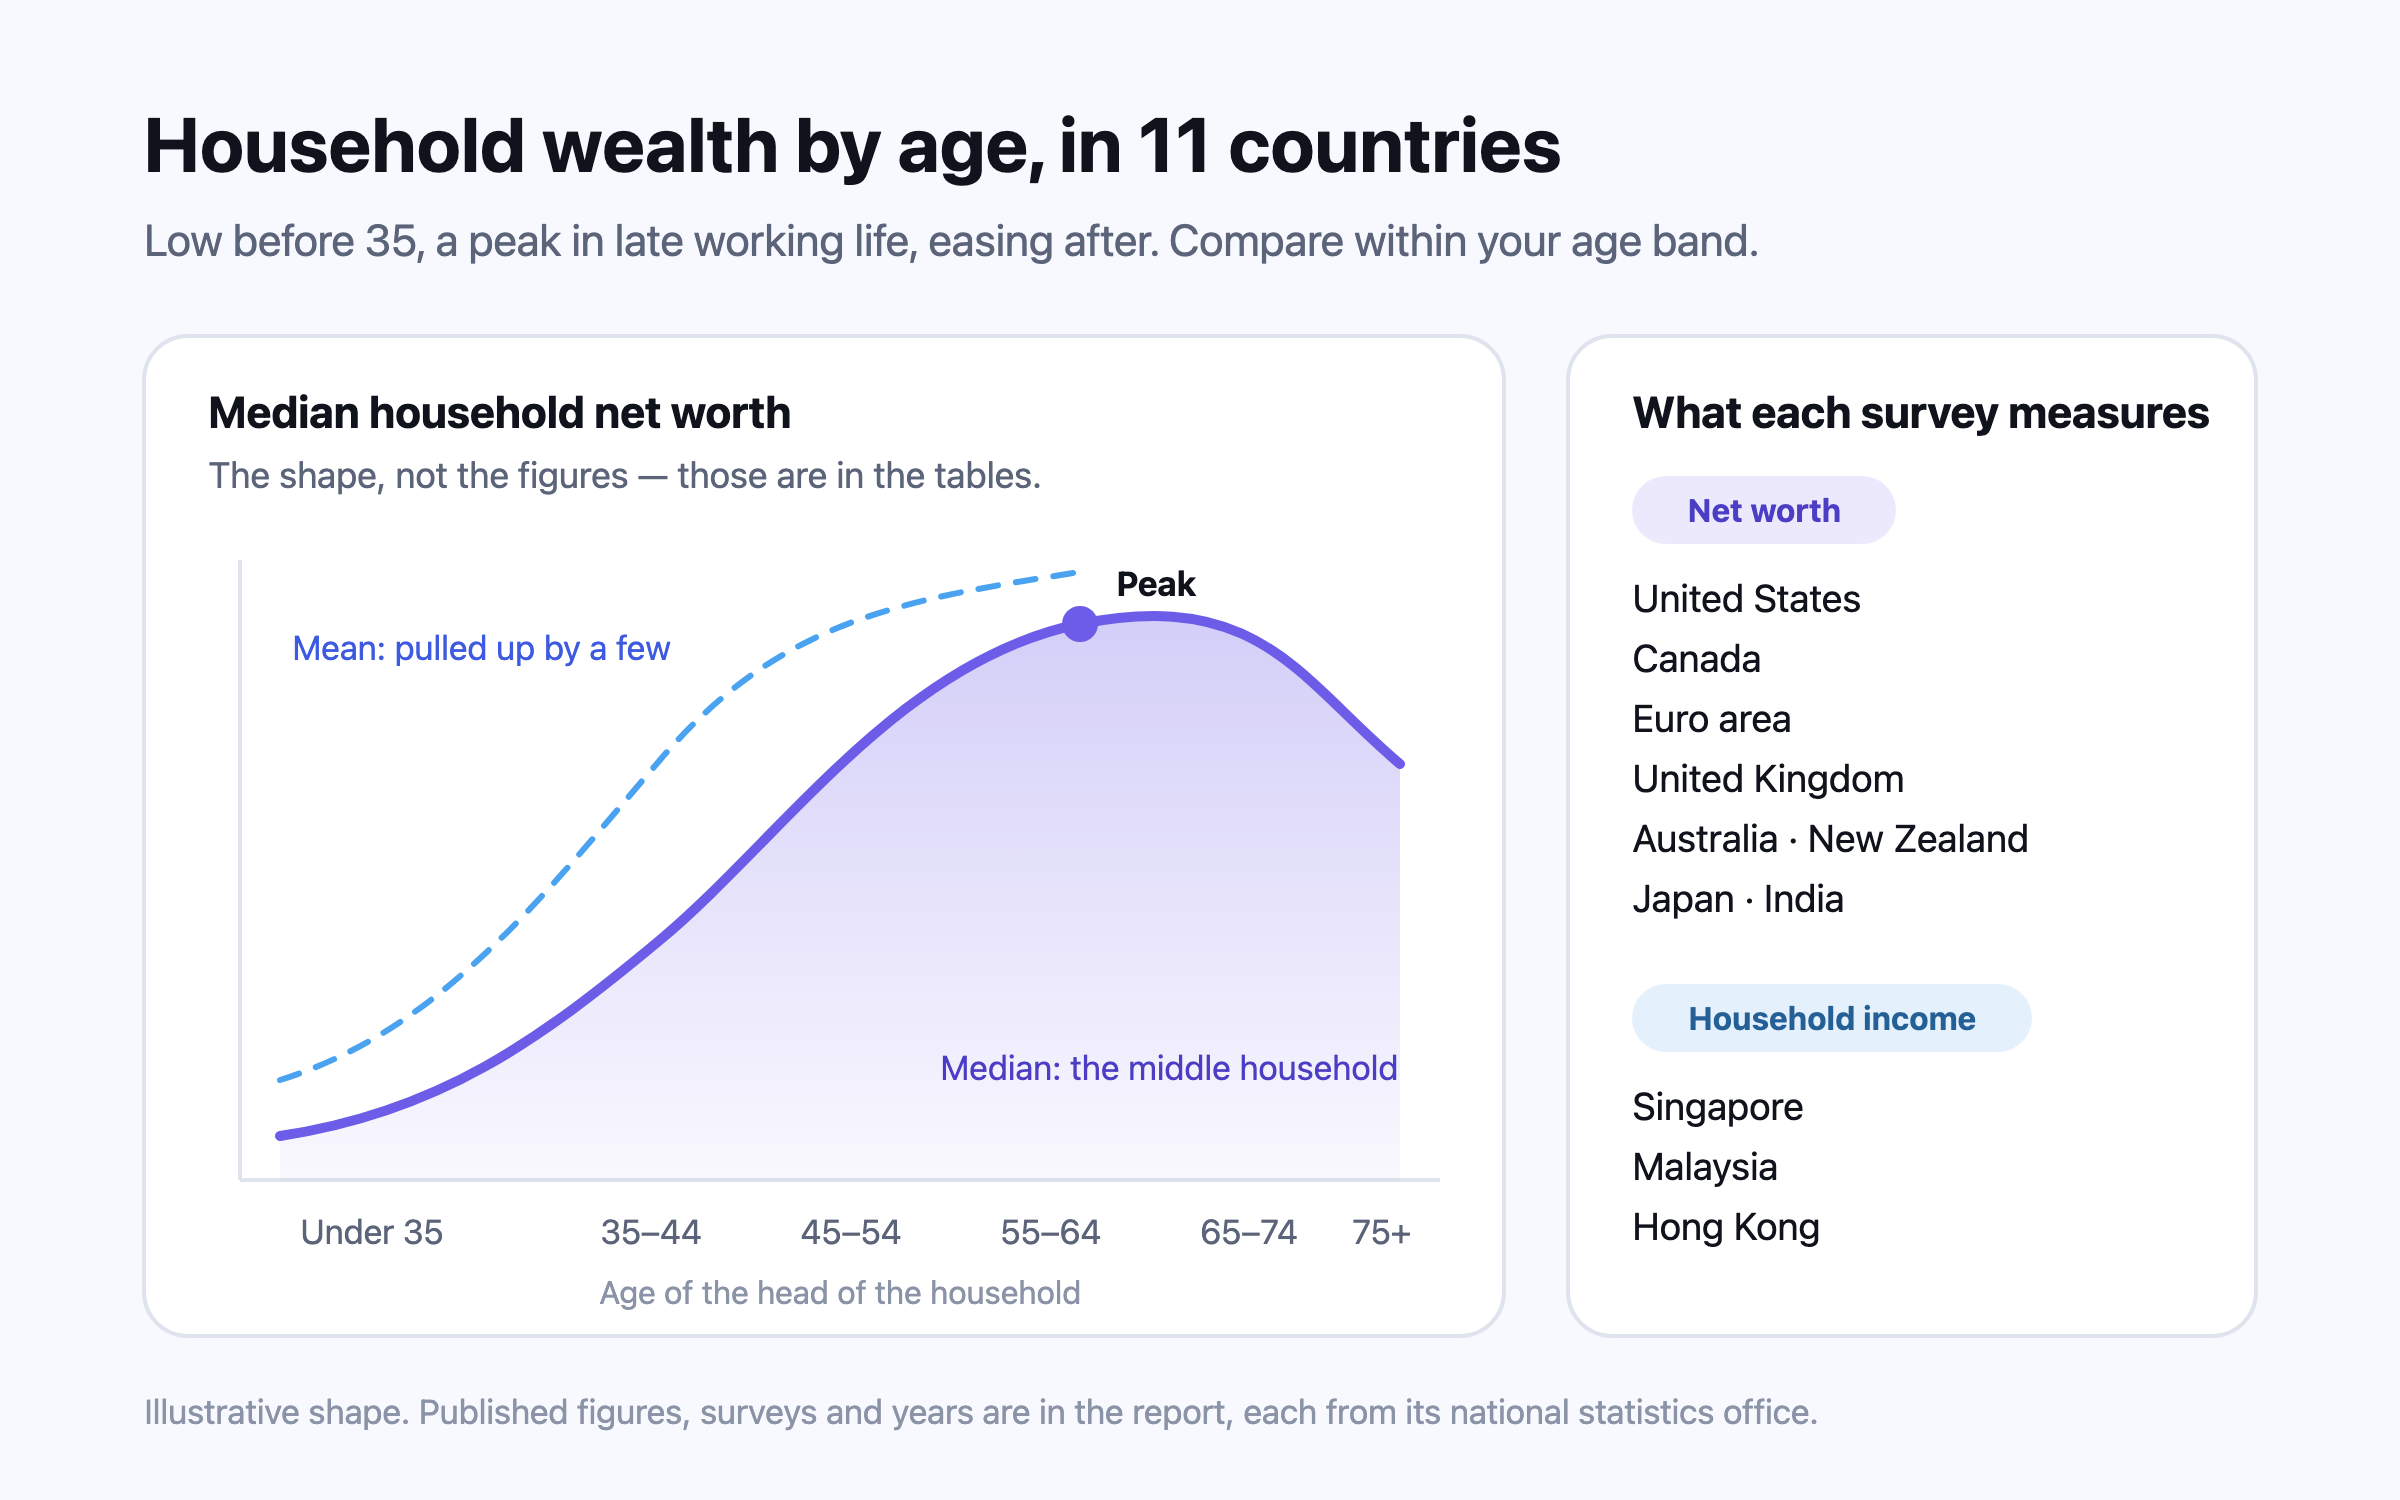
In every survey here, household wealth climbs steeply from the under-35s to a peak somewhere between 55 and 74, and the median sits far below the mean. Singapore, Malaysia and Hong Kong publish household income rather than wealth, so for them the honest comparison is income.
This is general information, not financial, tax or legal advice for your circumstances. Rules and figures change; check the official source for your country, and consult a licensed professional before making financial decisions. Projections are estimates, not predictions.