Sending money home costs less than it did, and still more than it needs to: most of the difference is the provider and the exchange rate it gives you.
Sending the equivalent of $200 across a border cost 6.36% on average in the World Bank’s latest survey, more than twice the 3% the world has set as its 2030 target. Corridors into India are cheaper than that, but inside a single corridor quotes run from under 1% to over 20%. The fee you see is only part of the price, so compare the amount that arrives.
Nivritee Research · 16 August 2026 · 6 min read
For a family living abroad, the transfer home is often the most regular money decision of the month. The World Bank has priced it since September 2008 in Remittance Prices Worldwide, which tracks the cost of sending the equivalent of $200 and $500 along 367 country corridors1. Its latest edition, for the third quarter of 2025, puts the global average cost of sending $200 at 6.36% of the amount sent2. This article explains what that price is made of, what it is on the routes into India, and how to work out what your own transfers cost.
The world average, and the target
The global average fell from 9.67% in the first quarter of 2009 to 6.36% in the third quarter of 2025, and has stayed below 7% since early 20192. The world’s target is lower still. Sustainable Development Goal 10.c commits countries, by 2030, to cut the cost of migrant remittances to less than 3% and to eliminate corridors that cost more than 5%3. The World Bank estimates that cutting prices by at least five percentage points could save senders up to $16 billion a year1.
Size matters too. Sending $500 cost 4.08% on average in the same quarter, well below the $200 figure, because part of every price is a fixed fee that weighs less on a larger amount2.
Banks, money transfer operators and apps
The survey sorts providers into banks, money transfer operators (MTOs, which include both the long-established names and the newer app-based firms), mobile operators and post offices2. Banks were the most expensive kind by a distance, at 14.99% on average, against 4.72% for MTOs. Services you start online or in an app and that pay into an account averaged 4.59%, against 7.30% for everything else, and five digital-only operators together averaged 3.54%2.
The average cost of sending $200 depends heavily on the kind of service, Q3 2025.
Each bar is the World Bank’s average total cost (fee plus exchange-rate margin) for sending the equivalent of $200. “Cheapest three per corridor” is its SmaRT measure: the average of the three cheapest qualifying services in each corridor. The last bar is the 2030 target, not a price. 2,3The figures in this chart
Total cost, % of the amount sent
Banks
14.99%
Non-digital services
7.30%
Global average
6.36%
Money transfer operators
4.72%
Digital services
4.59%
Digital-only operators
3.54%
Cheapest three per corridor
3.29%
SDG target for 2030
3.00%
The most useful bar is the second from the right. The World Bank’s SmaRT measure averages the three cheapest qualifying services in each corridor, the price an informed sender could actually find, and it was 3.29%2. In most corridors the target price already exists; it is simply not what most people pay.
The kind of provider is a clue, not the answer. In the UAE-to-India corridor in the same quarter, the cheapest service priced was a bank’s online transfer at 0.77%, and the dearest was another bank’s, at 21.06%4. New payment rails help as well: since February 2023 India’s UPI and Singapore’s PayNow have been linked, so money can move between the two countries from a phone using a UPI ID or mobile number, with an initial limit of ₹60,000 a day for Indian users5.
What it costs to send to India
India is the largest recipient of remittances in the world6. It received $138 billion in 2024, up from $22 billion in 2005; Mexico, second, received $68 billion7. Across all low- and middle-income countries, officially recorded remittances were estimated at $685 billion in 20246. The Reserve Bank of India’s survey of 2023-24 found that the United States had become the largest source, at 27.7% of inward remittances, ahead of the UAE at 19.2% and the UK at 10.8%8.
Where India’s remittances came from in 2023-24, as a share of the total.
The ten largest sources in the RBI’s sixth remittances survey, which covered 30 banks plus two money transfer operators and two fintech firms. The UAE’s share was 26.9% in 2016-17; the share from advanced economies has grown since. 8The figures in this chart
Share of inward remittances, %
United States
27.7%
UAE
19.2%
United Kingdom
10.8%
Saudi Arabia
6.7%
Singapore
6.6%
Qatar
4.1%
Kuwait
3.9%
Canada
3.8%
Oman
2.5%
Australia
2.3%
How much of each transfer is lost in transit depends on where it starts. The World Bank’s report puts the average cost of sending $200 to India, across all the corridors it tracks, at 5.30% in the third quarter of 20252. Each corridor’s own page shows a wide range for the same collection: 1.91% from the UK and 2.92% from Singapore, 3.68% from the US and 3.72% from the UAE, up to 6.53% from Germany and 8.72% from Japan9. The three largest sources, the US, the UAE and the UK, all sit below the 5.30% average9.
The average cost of sending $200 to India from twelve countries, Q3 2025.
Each bar is the “total average” on the World Bank’s page for that corridor, for the equivalent of $200 sent in the July to September 2025 collection. Inside every corridor the individual quotes spread far wider than the averages between corridors. 9The figures in this chart
Corridor average total cost, %
United Kingdom
1.91%
Qatar
2.50%
Singapore
2.92%
Malaysia
3.33%
United States
3.68%
UAE
3.72%
Canada
4.28%
New Zealand
4.68%
Saudi Arabia
5.59%
Australia
6.15%
Germany
6.53%
Japan
8.72%
The RBI survey points the same way from the receiving end. For transfers to India below $200 the weighted average cost was 4.6%, against 2.4% for transfers between $200 and $500, and the largest number of transactions fell in the smallest bracket8. The people sending the least are paying the most for it.
The fee is only part of the price
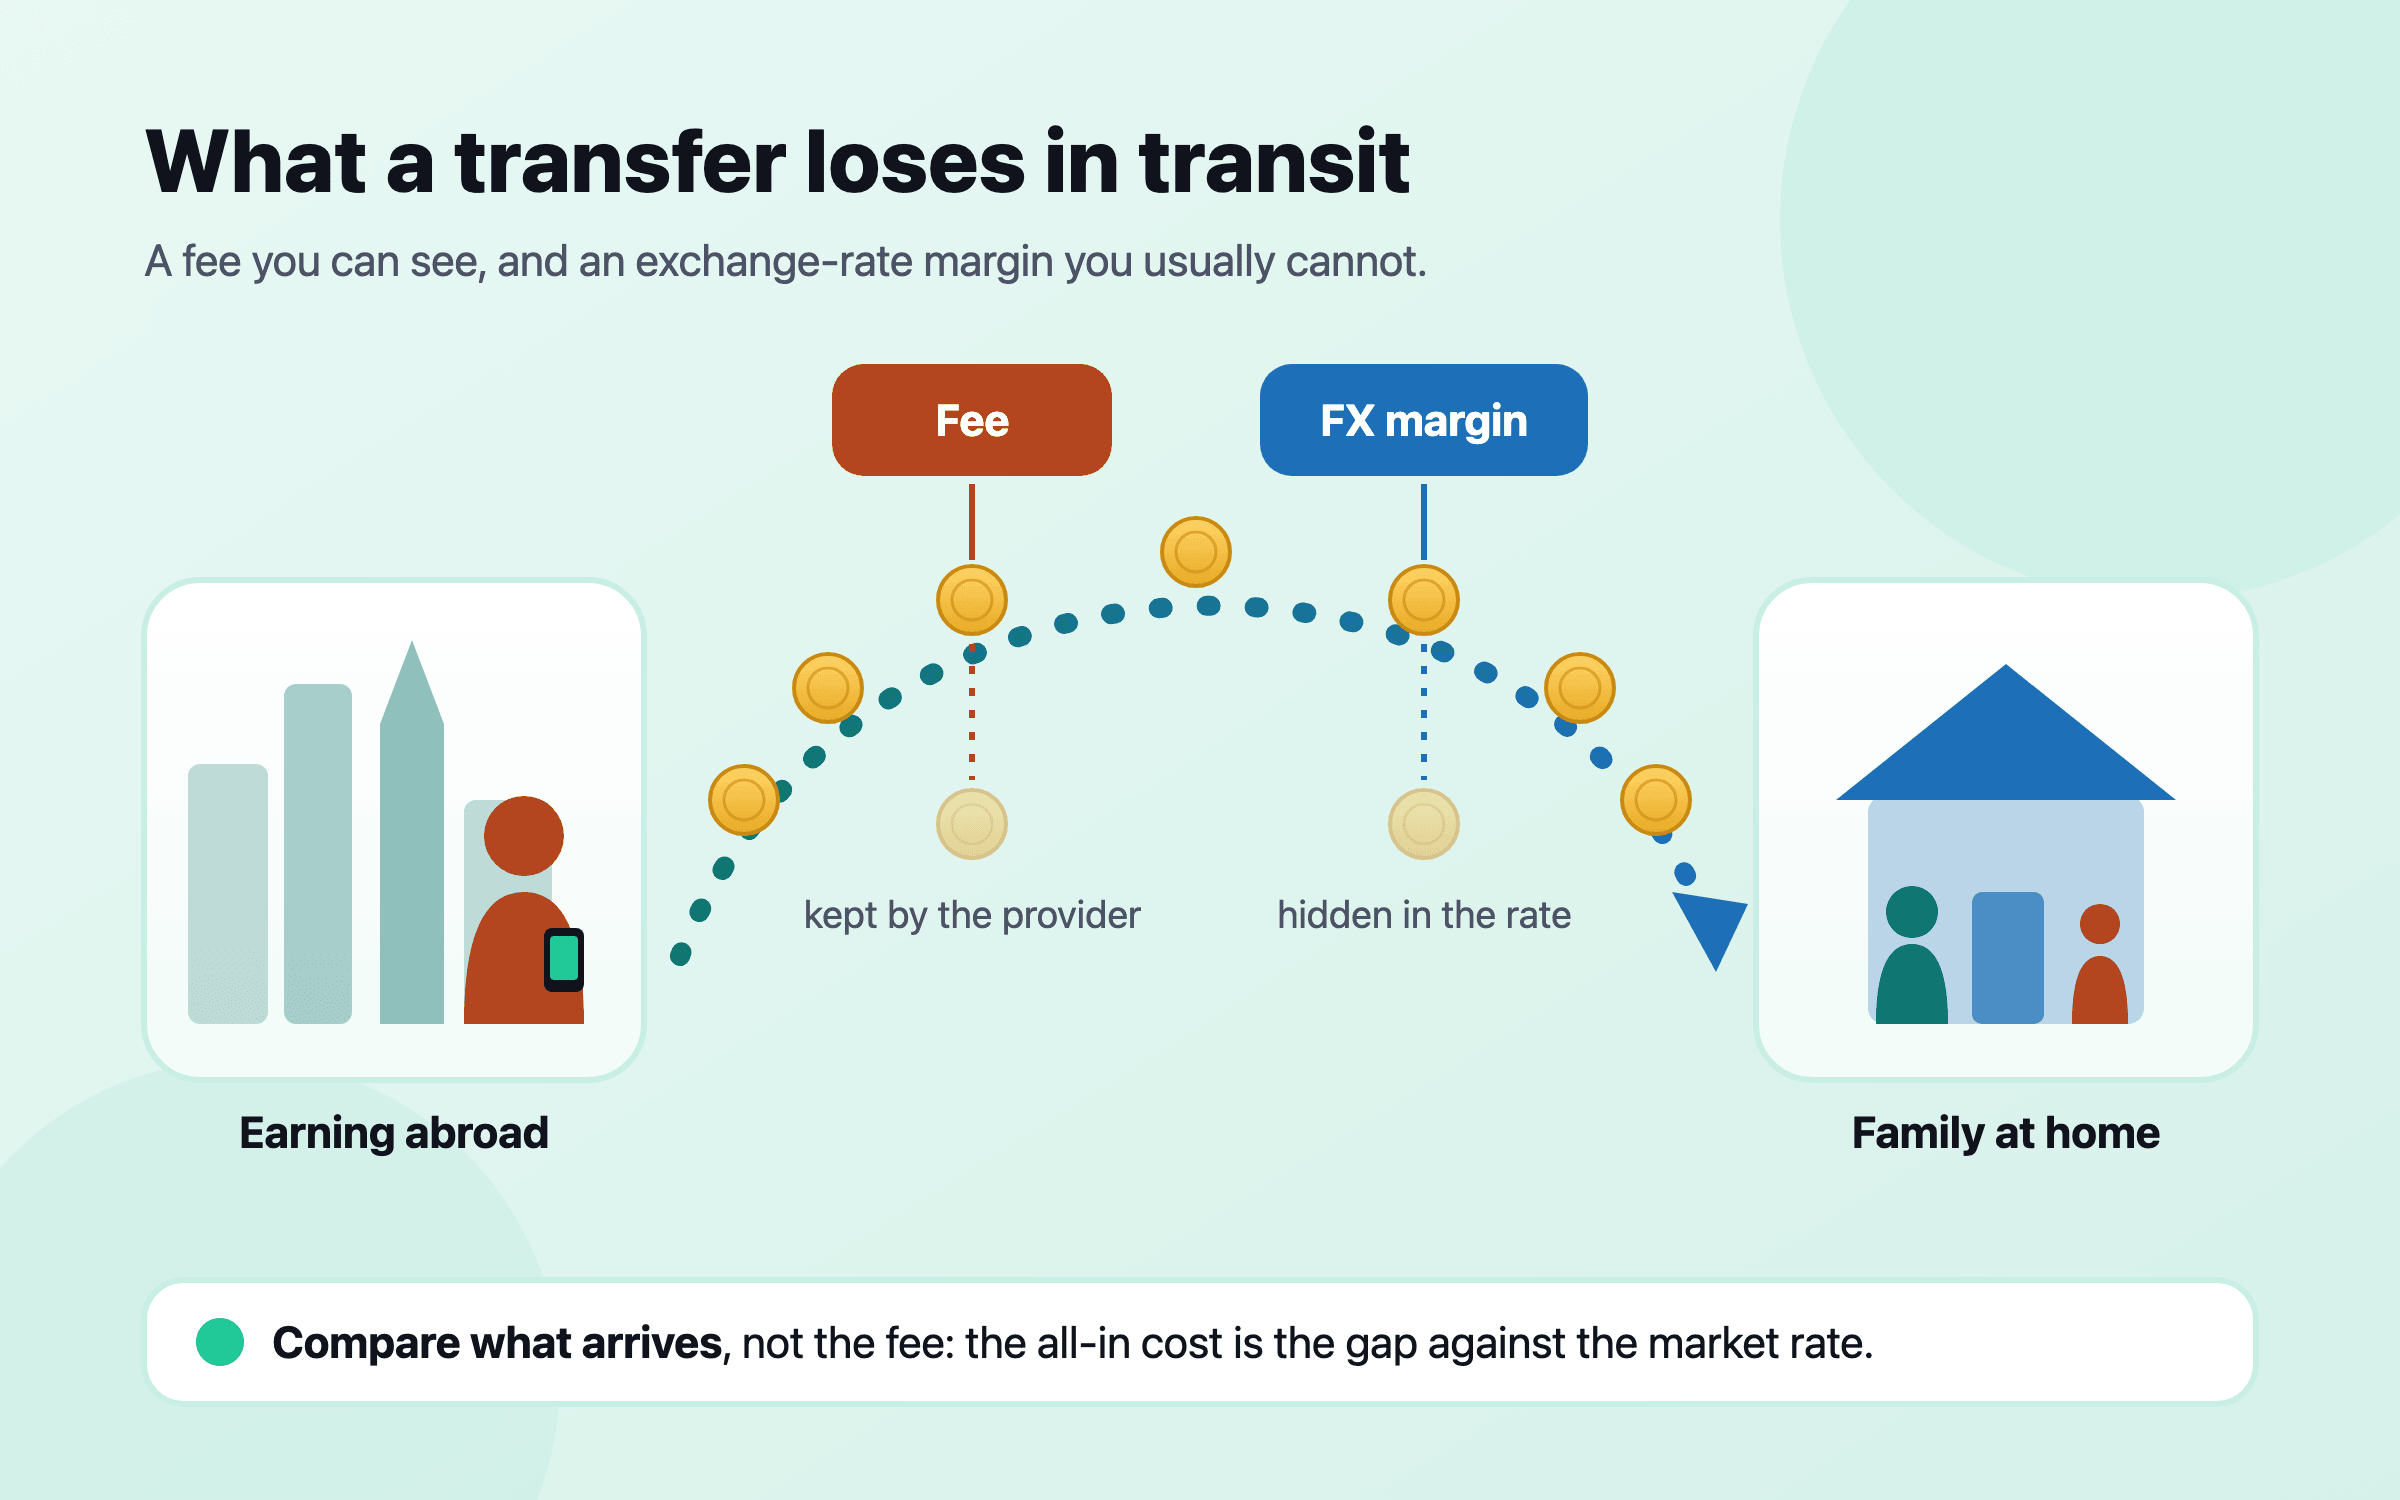
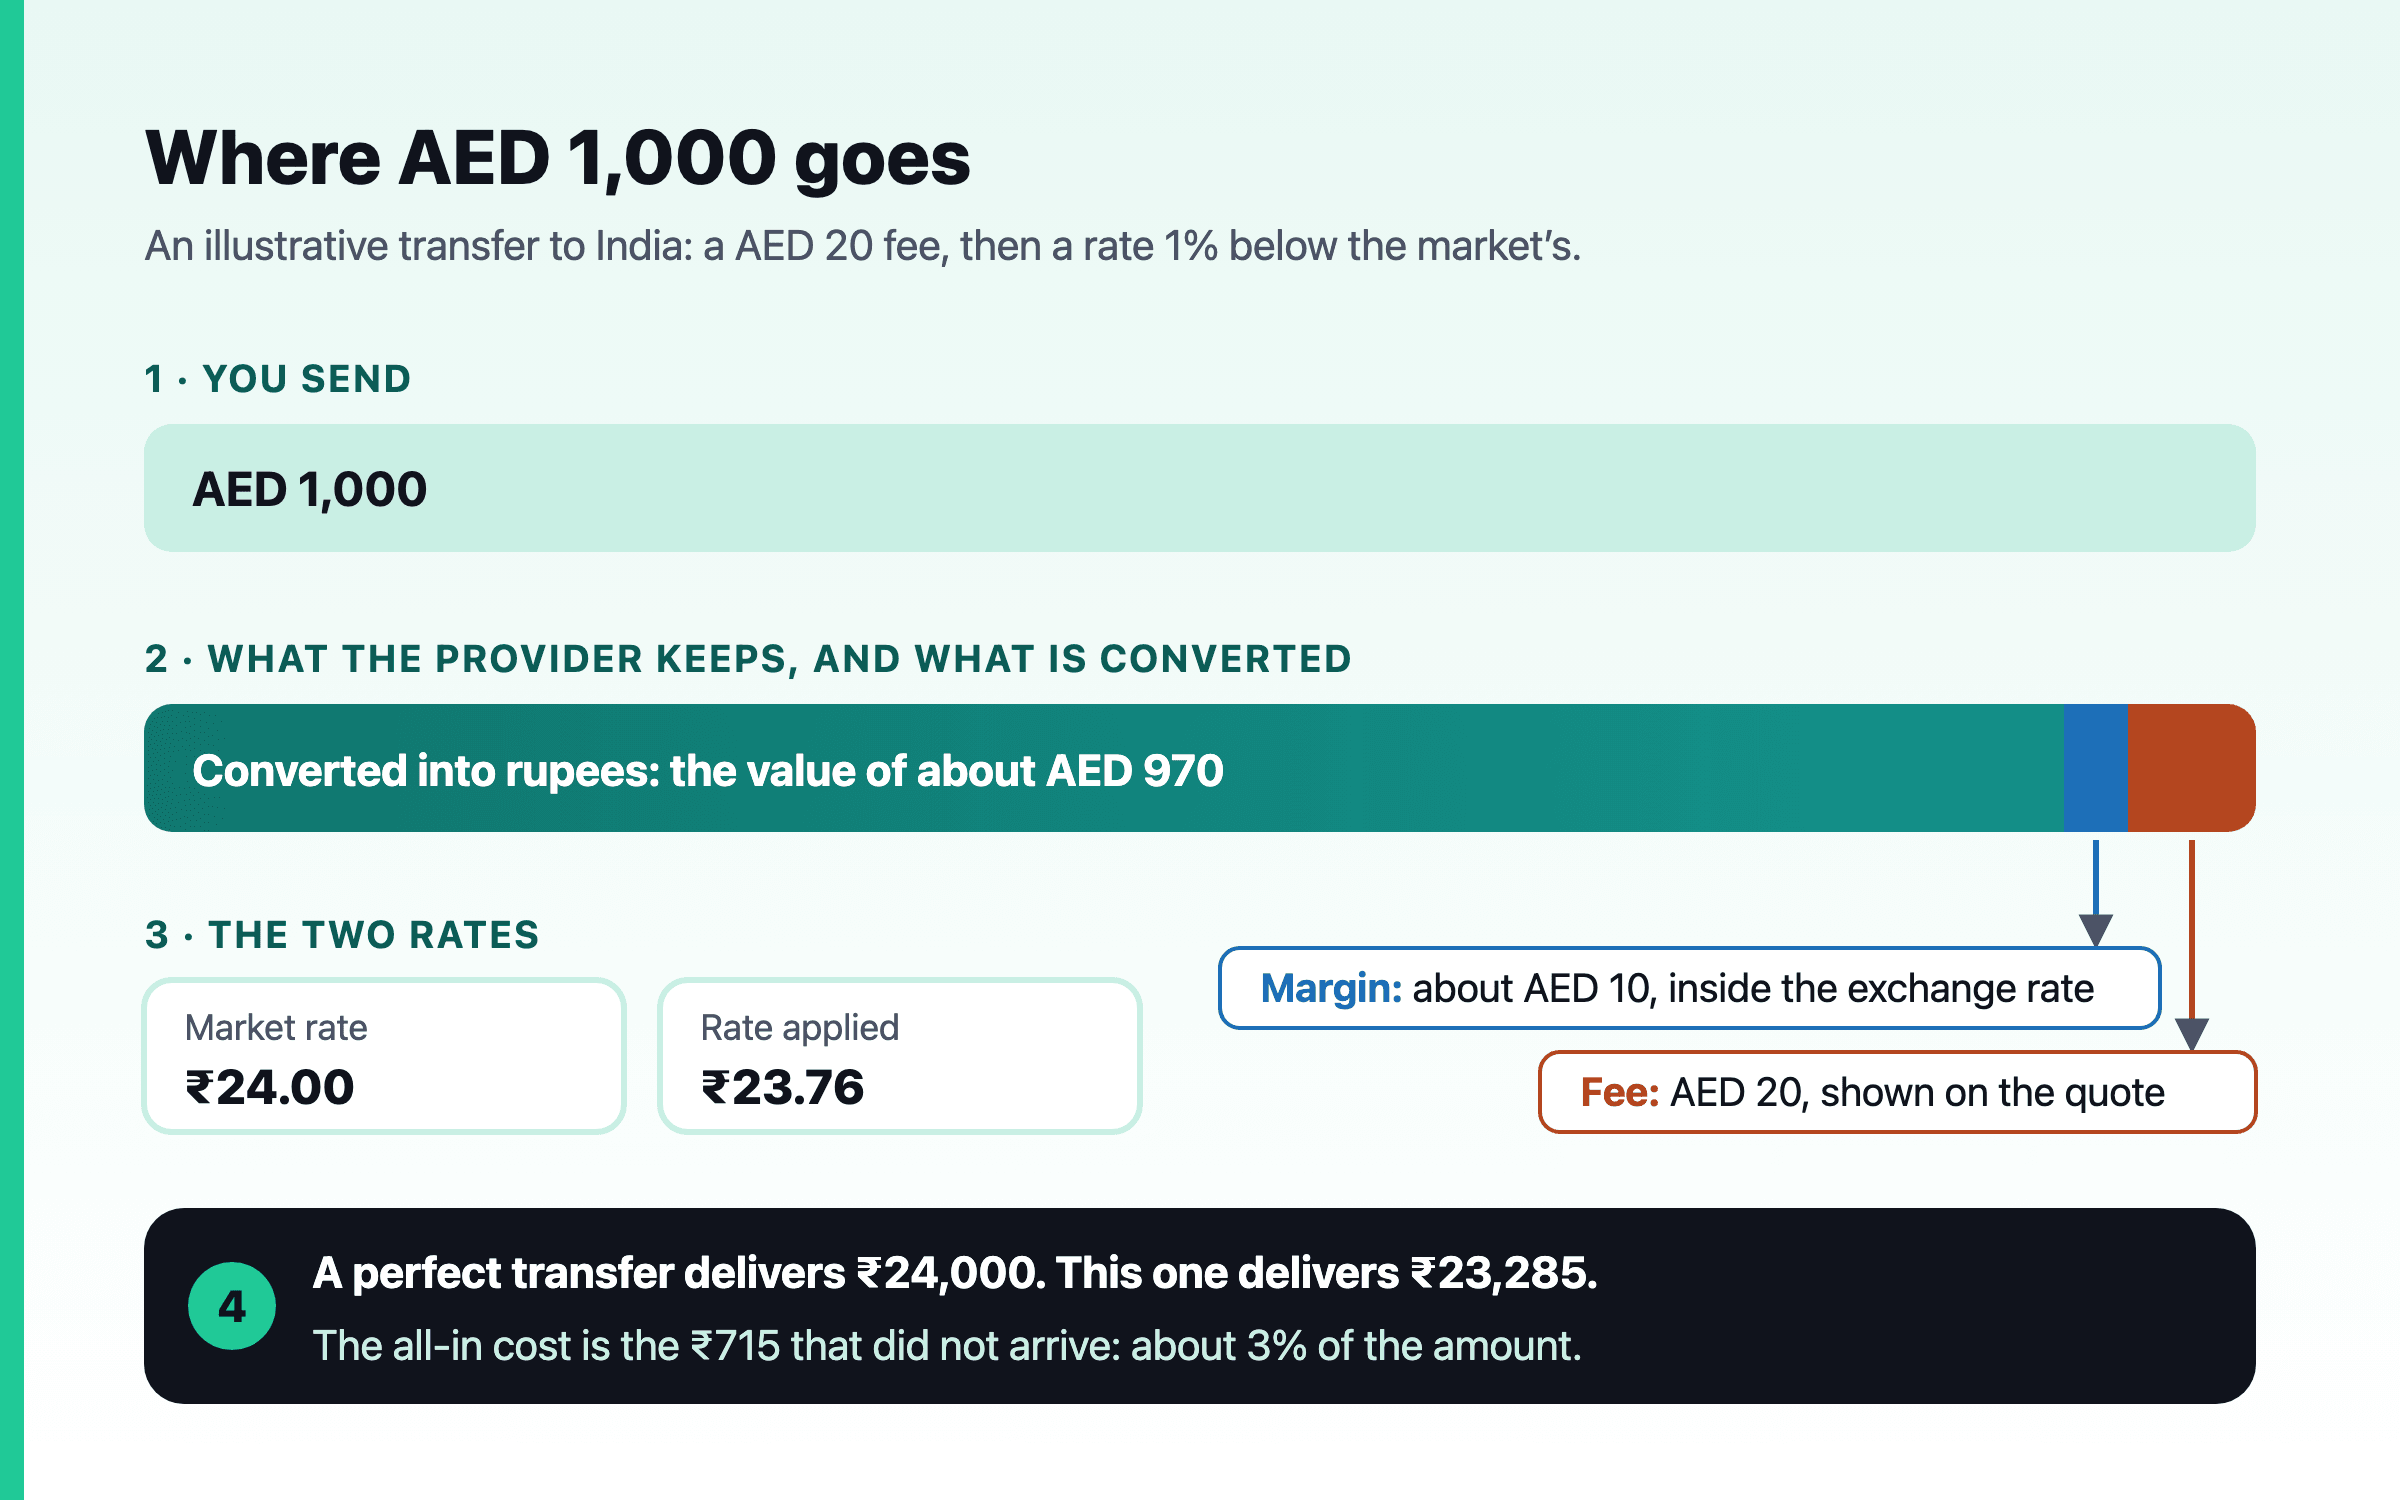
Every transfer has two charges. The fee is the one you see. The exchange-rate margin is the gap between the market reference rate and the rate the provider actually applies, and you see it only if you check4. The World Bank adds the two together to get the total cost4.
Illustrative: what a transfer loses in transit. The all-in cost is what did not arrive, measured against the market reference rate, whatever the provider calls its charges.
The UAE-to-India corridor shows both at work. For a transfer of AED 735, the World Bank’s benchmark amount there, services charged an average fee of AED 21.77, about 3.0% of the amount, plus an average margin of 0.75%, making 3.72% in all4. The cheapest service charged no fee and a margin of 0.77%. The dearest combined a fee of AED 126 with a margin of 3.92%, so AED 154.81 of the AED 735 never reached the family4.
This is why “zero fee” and “no commission” say nothing about the price. A provider can charge nothing up front and take its whole price in the rate. The only number that settles it is how many rupees arrive.
How to compare a transfer: the all-in cost
Note the reference rate. Look up the market rate for your two currencies at the moment you are comparing; a central bank’s published reference rate or a market data page will do.
Ask each provider what arrives. Enter the exact amount you will send and write down how much lands in the account at home, in that currency, after every charge.
Work out the all-in cost. Multiply the amount sent by the reference rate to get what a perfect transfer would deliver. The shortfall between that and what actually arrives, as a share of it, is the all-in cost.
Ask about the far end. The World Bank’s total counts the sender’s fee and the margin4. A bank at home may deduct its own charge from an incoming transfer, so ask.
Check speed and recourse. Note how long it takes and how to cancel or complain. In the US, for example, you can generally cancel an international transfer within 30 minutes of paying if it has not yet been collected or deposited10.
Size, frequency and timing
Because part of the price is fixed, the same money sent in fewer, larger transfers usually costs less, which is what both the World Bank’s $500 figures2 and the RBI’s size brackets show8. Take an illustrative provider charging a flat AED 20 plus a 0.5% margin, and a household sending AED 3,000 a month. Sent as four transfers of AED 750, the month costs AED 95, or 3.17%. Sent once, it costs AED 35, or 1.17%. Over a year that is AED 720 kept by the family rather than the provider.
There are limits to this. Family support that has to arrive weekly should arrive weekly, and a larger balance sitting abroad for longer is a balance exposed to the exchange rate for longer. Timing the rate is a different matter: nobody knows which way it will move next week, and a household that waits for a better rate is making a currency bet with its grocery money. A fixed schedule, sized to what the family needs, is easier to live with. Over long periods the rupee has tended to weaken against the dollar, which our report on the rupee over 25 years sets out year by year.
Support and savings are different money
Money sent home usually does two jobs. Part of it supports parents or other family, and that is spending, as real as rent. Part of it is saving, held in rupees in an NRE or NRO account, a fixed deposit or a fund. Mixing them up hides both: the support never appears in the household’s budget, and the savings never appear beside the money still held abroad.
The savings half raises its own question: which currency will you finally spend in? That decides whether rupee savings are a match or a risk, and it is the subject of our article on home bias and currency risk. If you expect to settle in India, the moving-back checklist covers what happens to NRE, NRO and FCNR accounts when you return, and Gulf earners can read how gratuity and pensions behave when you move.
Questions people ask
What is the average cost of sending money abroad?
The World Bank’s global average for sending the equivalent of $200 was 6.36% of the amount sent in the third quarter of 20252. Sending $500 cost 4.08% on average, because part of each price is a fixed fee.
What is the cheapest way to send money to India?
It depends on the corridor and the day, so compare the rupees that arrive rather than the fee. The kind of provider is only a guide: in the UAE-to-India corridor one bank’s online service was the cheapest priced at 0.77% and another bank’s was the dearest at 21.06%4.
What is an exchange rate margin?
It is the difference between the market reference rate and the rate a provider applies to your transfer, expressed as a percentage. The World Bank adds it to the fee to get the total cost4.
Is it cheaper to send money less often?
Usually, because part of the price is fixed. The RBI found that transfers to India under $200 cost 4.6% on average against 2.4% for transfers of $200 to $5008.
What is the SDG target for remittance costs?
Target 10.c of the Sustainable Development Goals aims, by 2030, to reduce the cost of migrant remittances to less than 3% and to eliminate corridors costing more than 5%3.
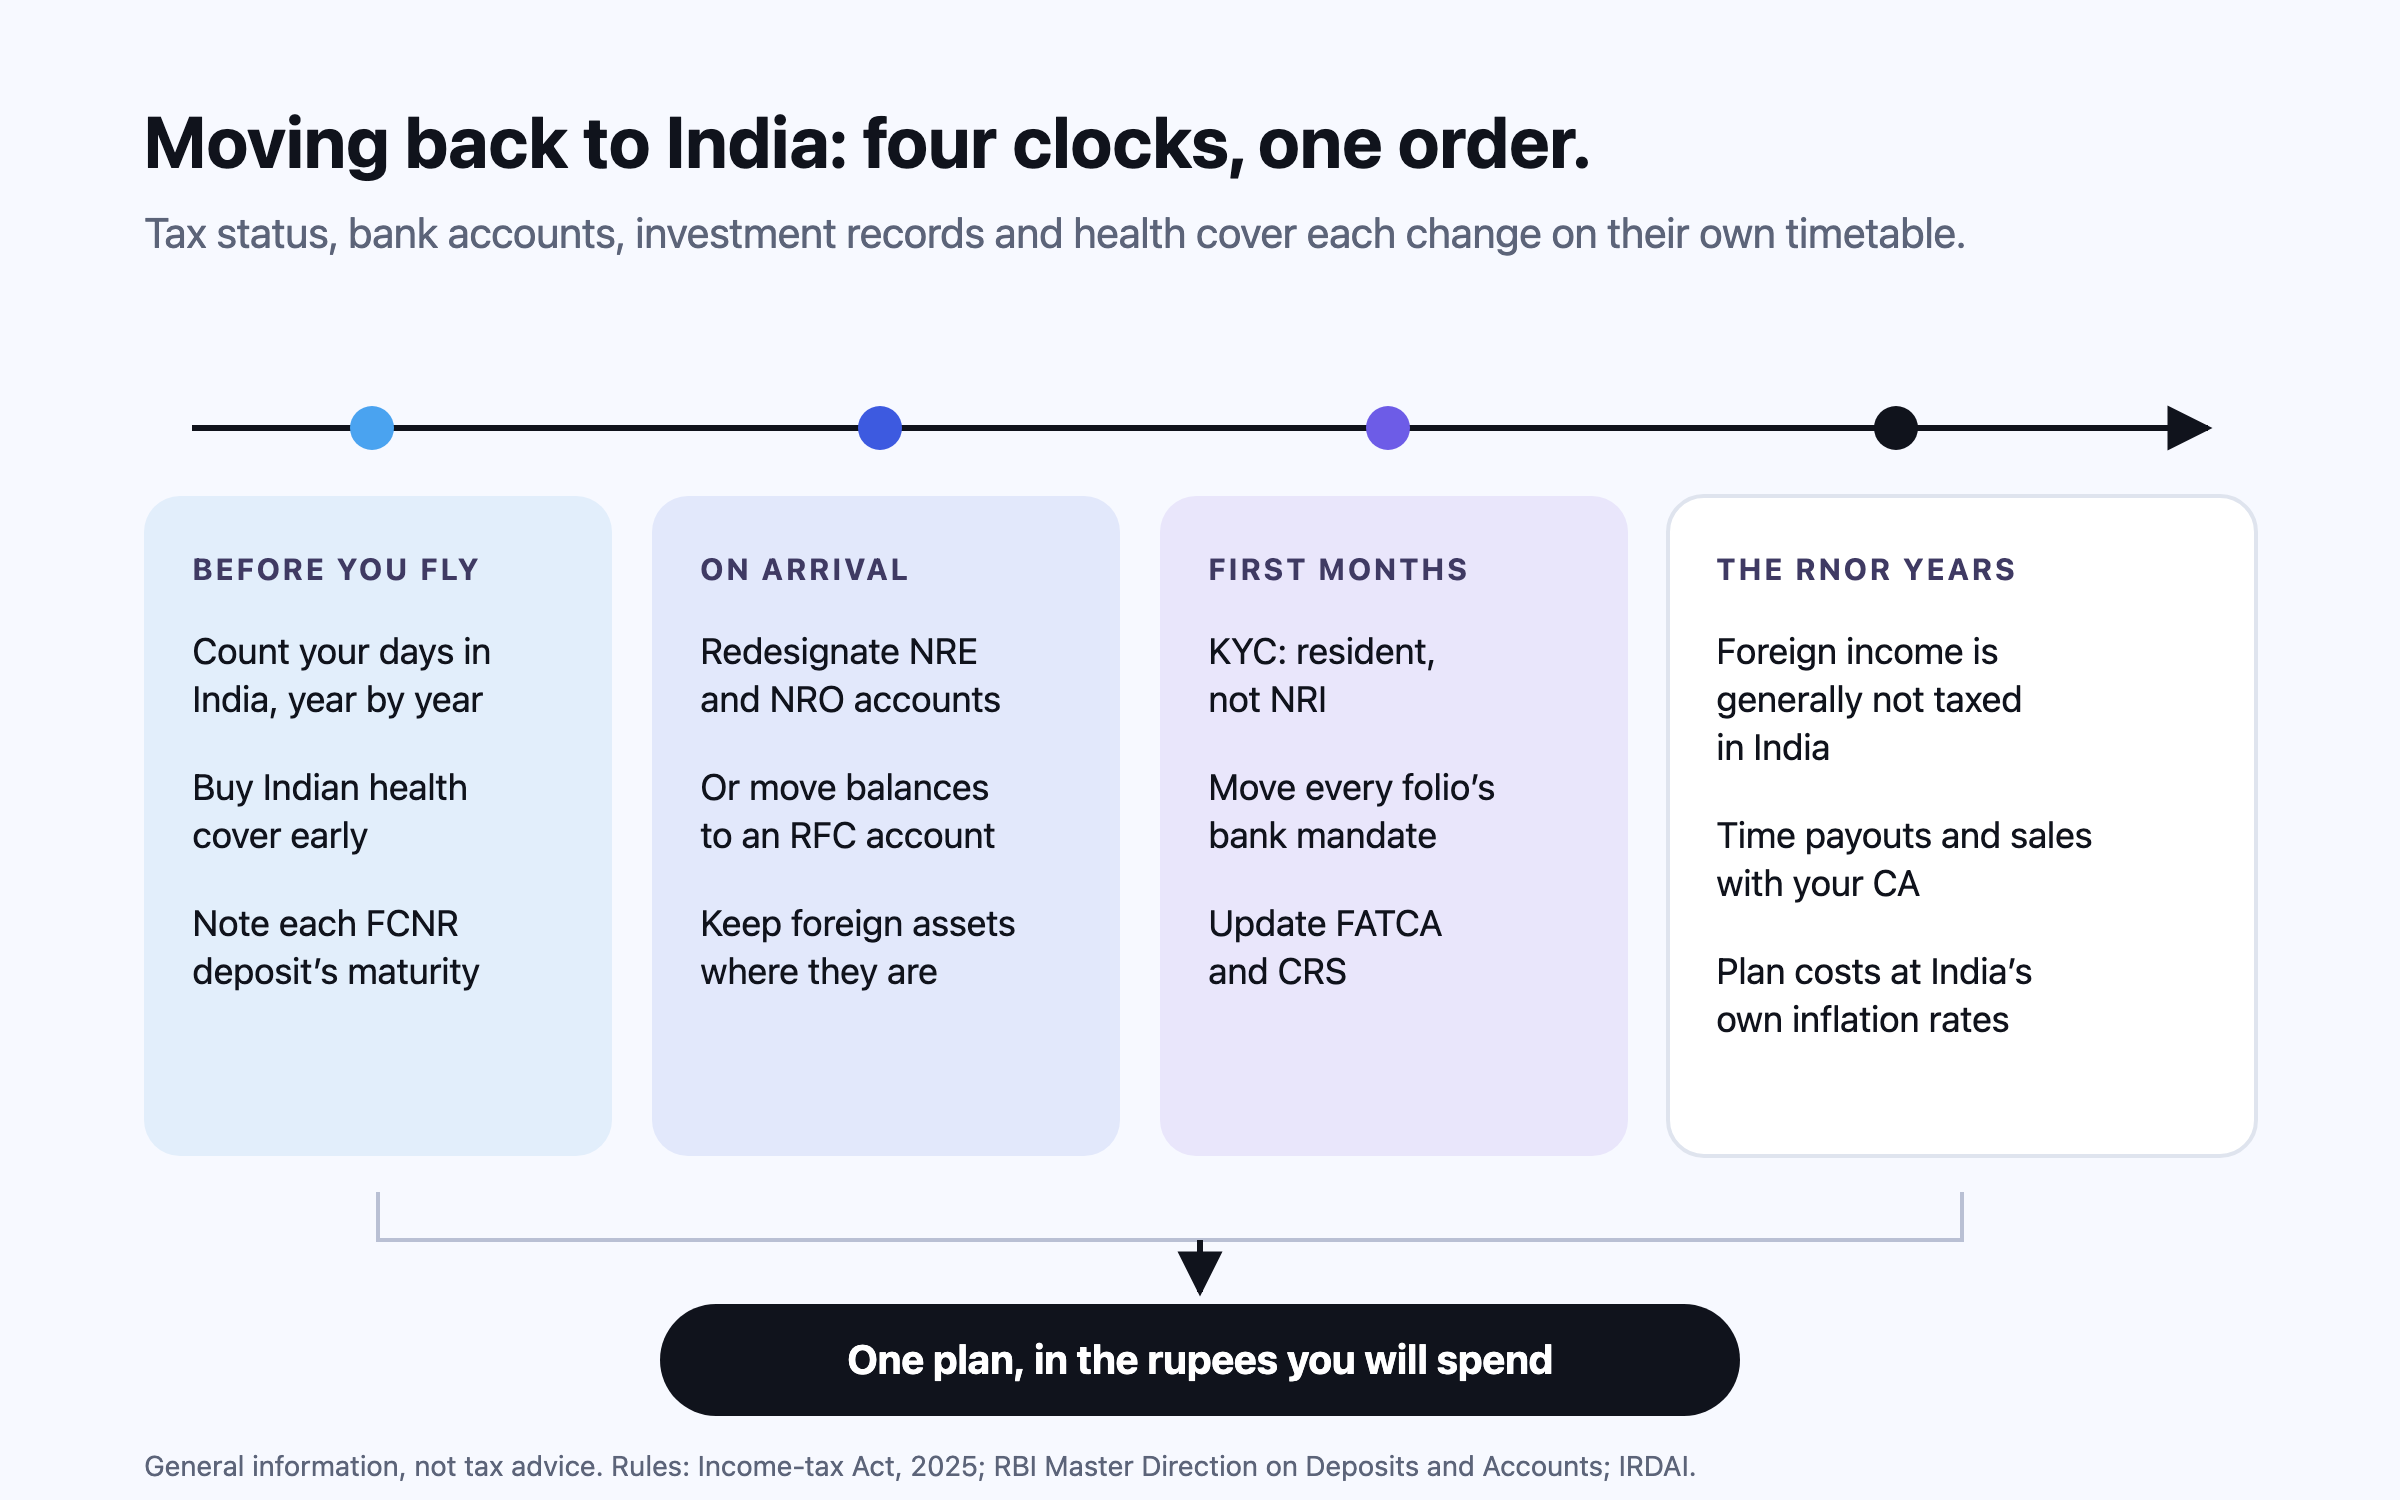
Coming home is several changes on different timetables. Your tax status follows day counts under the Income-tax Act, your bank accounts follow RBI rules under FEMA, and your investments, insurance and living costs each need their own step. This checklist explains each one in plain terms, with official sources — confirm the tax parts with a chartered accountant.
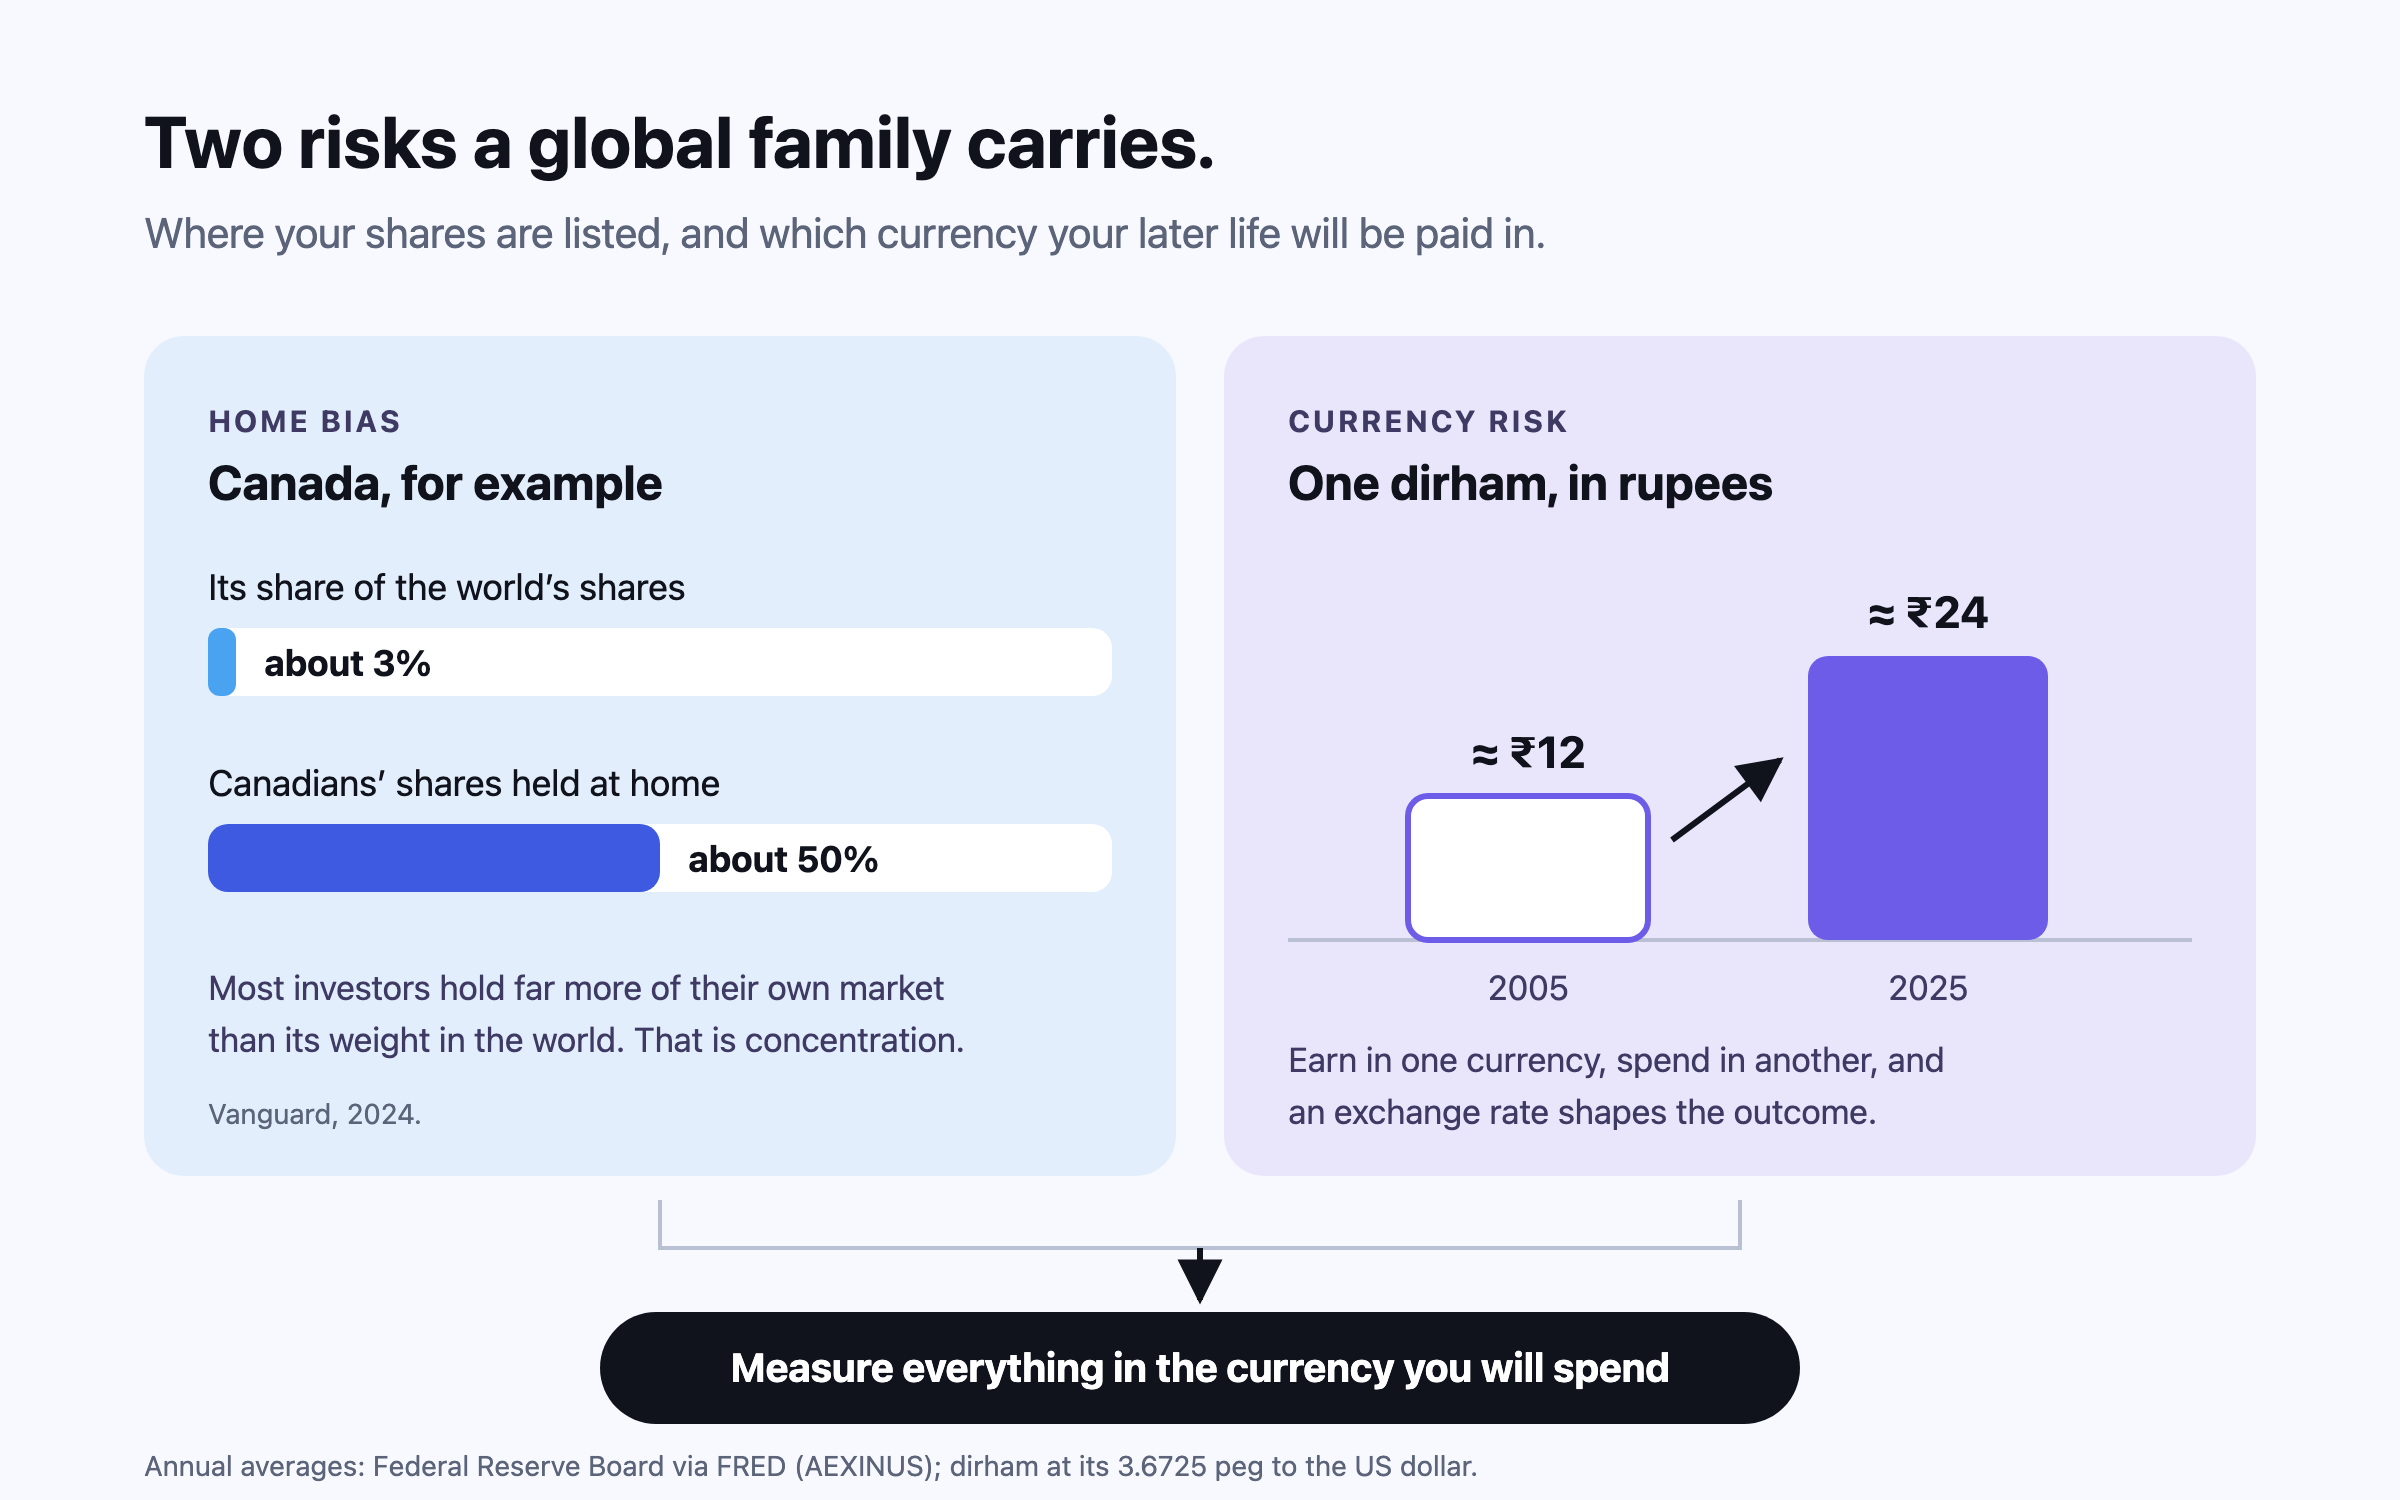
Investors everywhere hold far more of their own country’s shares than its weight in world markets, which concentrates risk. For a family earning in dirhams or dollars and planning to live on rupees or pounds, the bigger question is currency: measure every holding in the currency your future bills will be paid in, then diversify across markets from there.
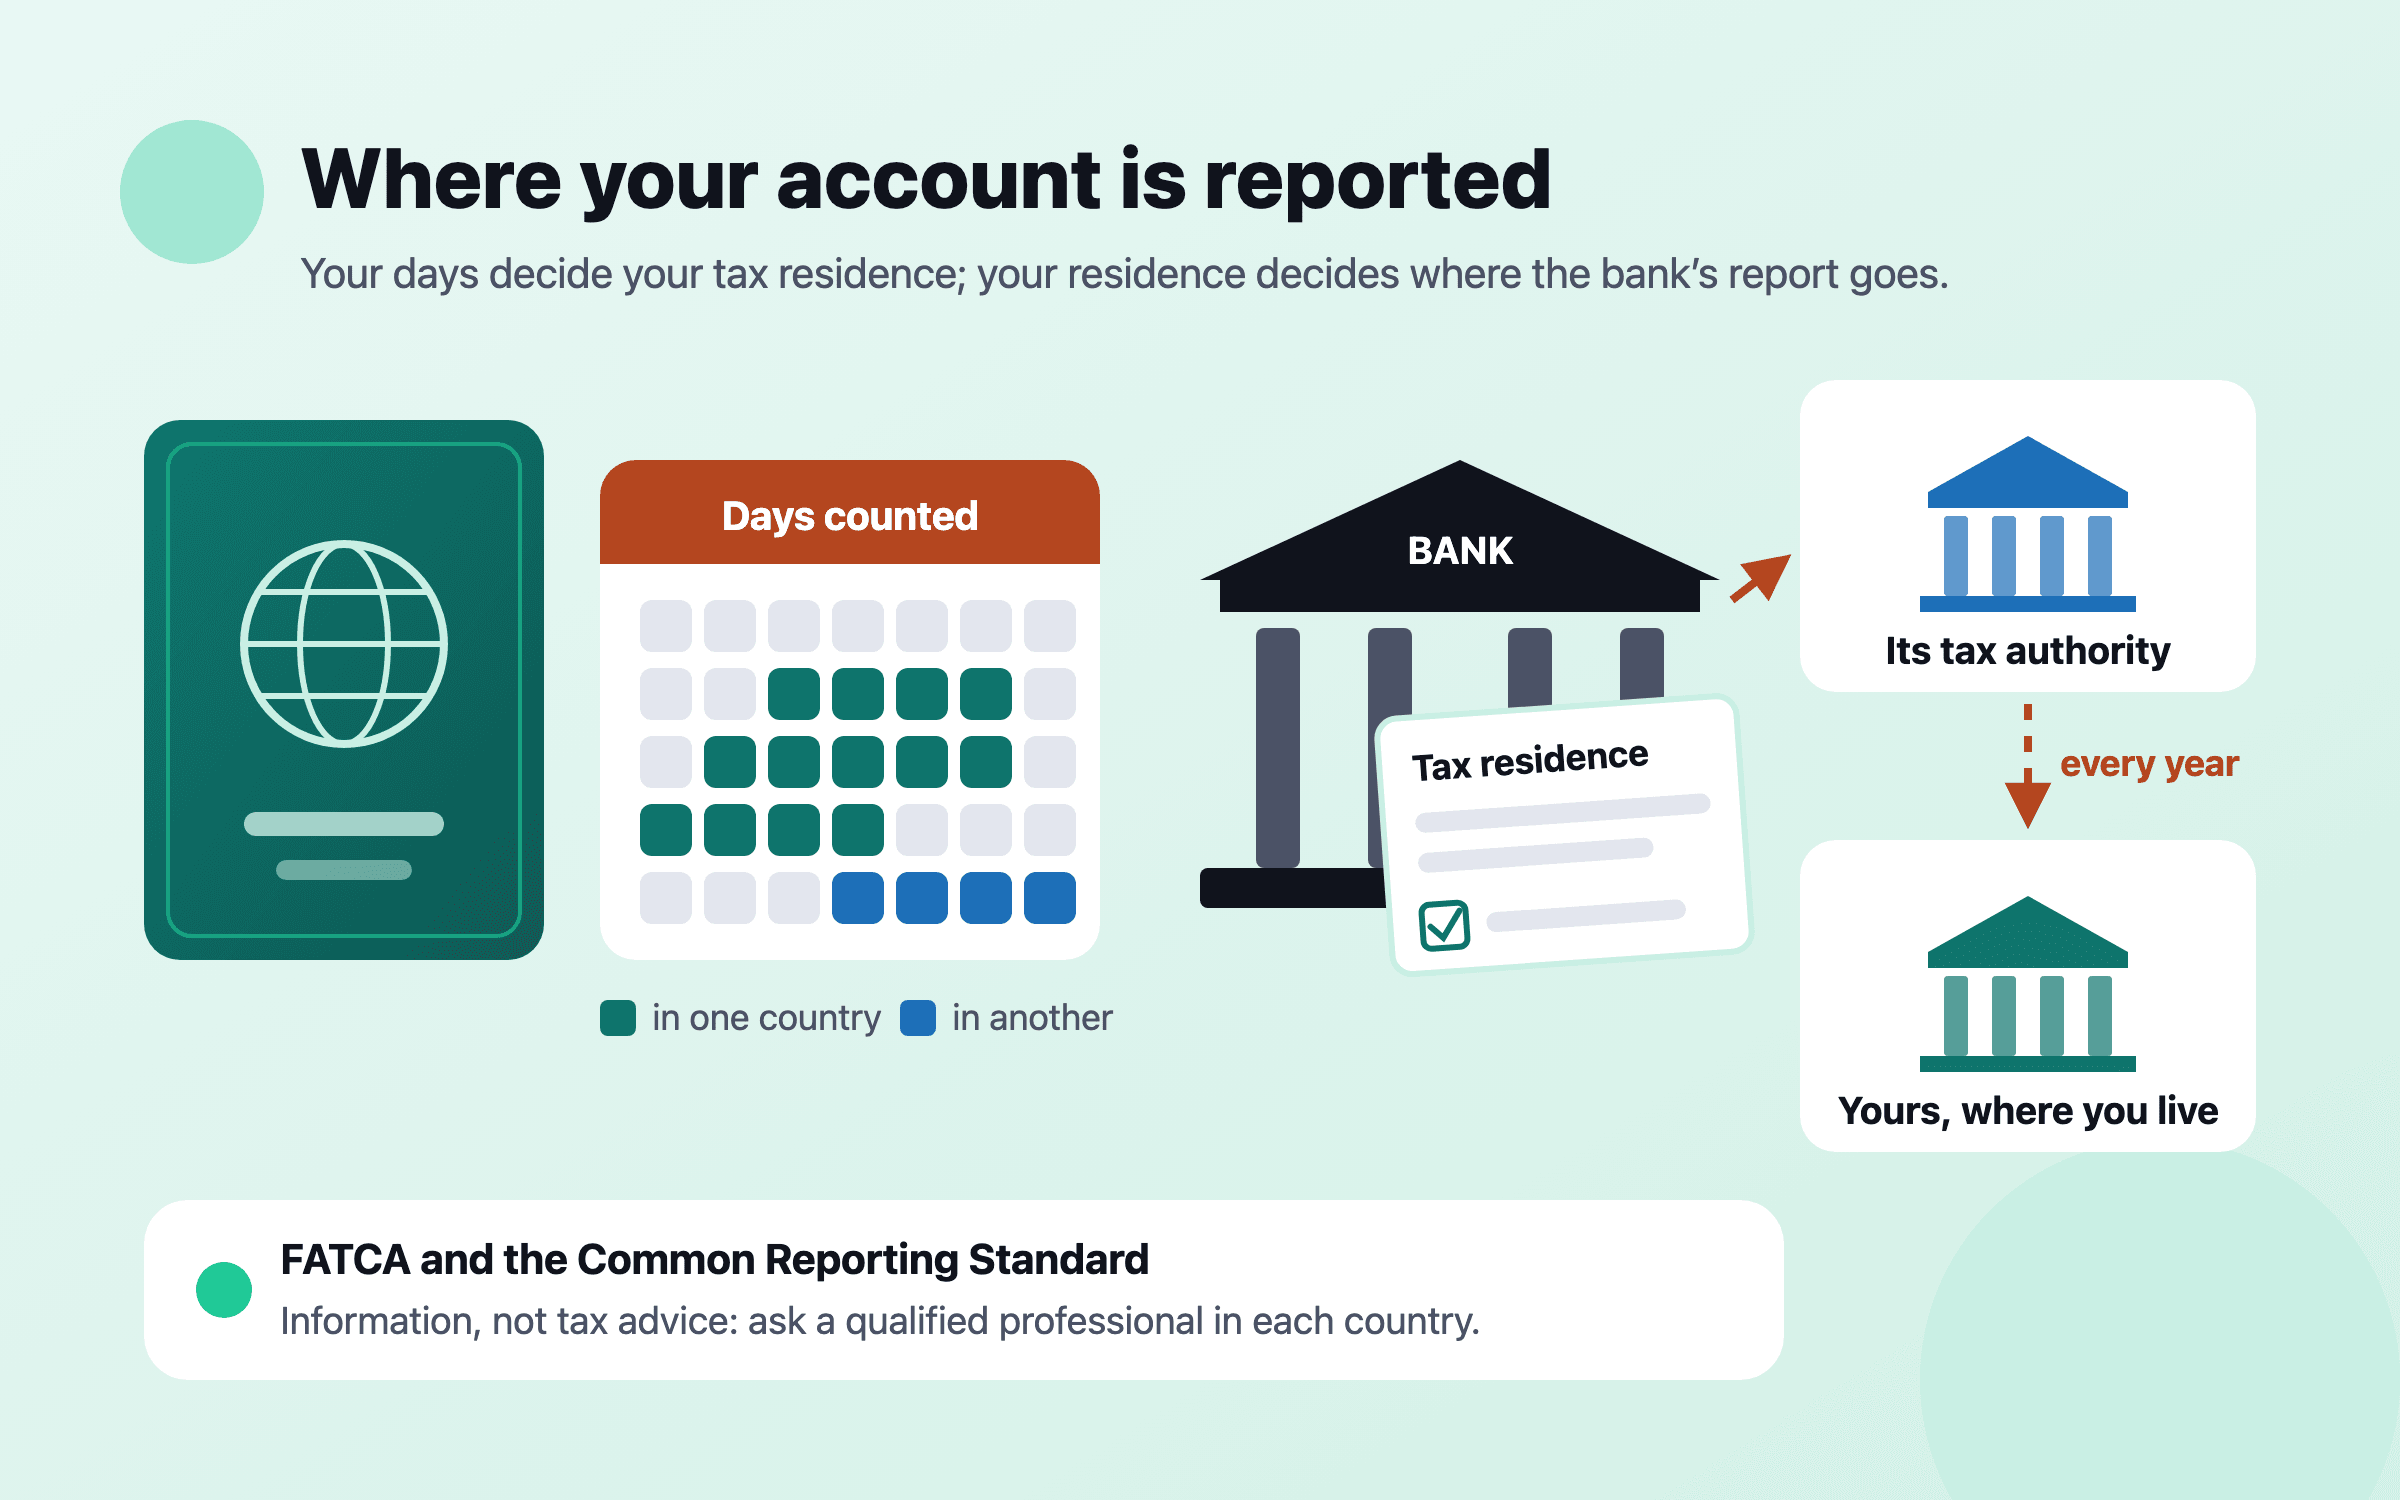
Under the OECD’s Common Reporting Standard, banks and funds report accounts held by non-residents to their own tax authority, which passes the details to the country where the holder is resident; 116 jurisdictions have begun exchanging. The US runs its own system, FATCA, and taxes its citizens wherever they live. Which country you are resident in is decided by each country’s own tests, mostly day counts, so keeping a record of your days and your papers is the first job.
This is general information, not financial, tax or legal advice for your circumstances. Rules and figures change; check the official source for your country, and consult a licensed professional before making financial decisions. Projections are estimates, not predictions.