The 4% rule describes America’s best century. Most countries’ history supports less.
The 4% rule says a first-year withdrawal of 4% of savings, raised with inflation each year, lasted at least 30 years in US market history. Tested across 17 countries it held in only four, and longer horizons need lower rates — so treat it as a starting point to test against your own spending, country and timeline.
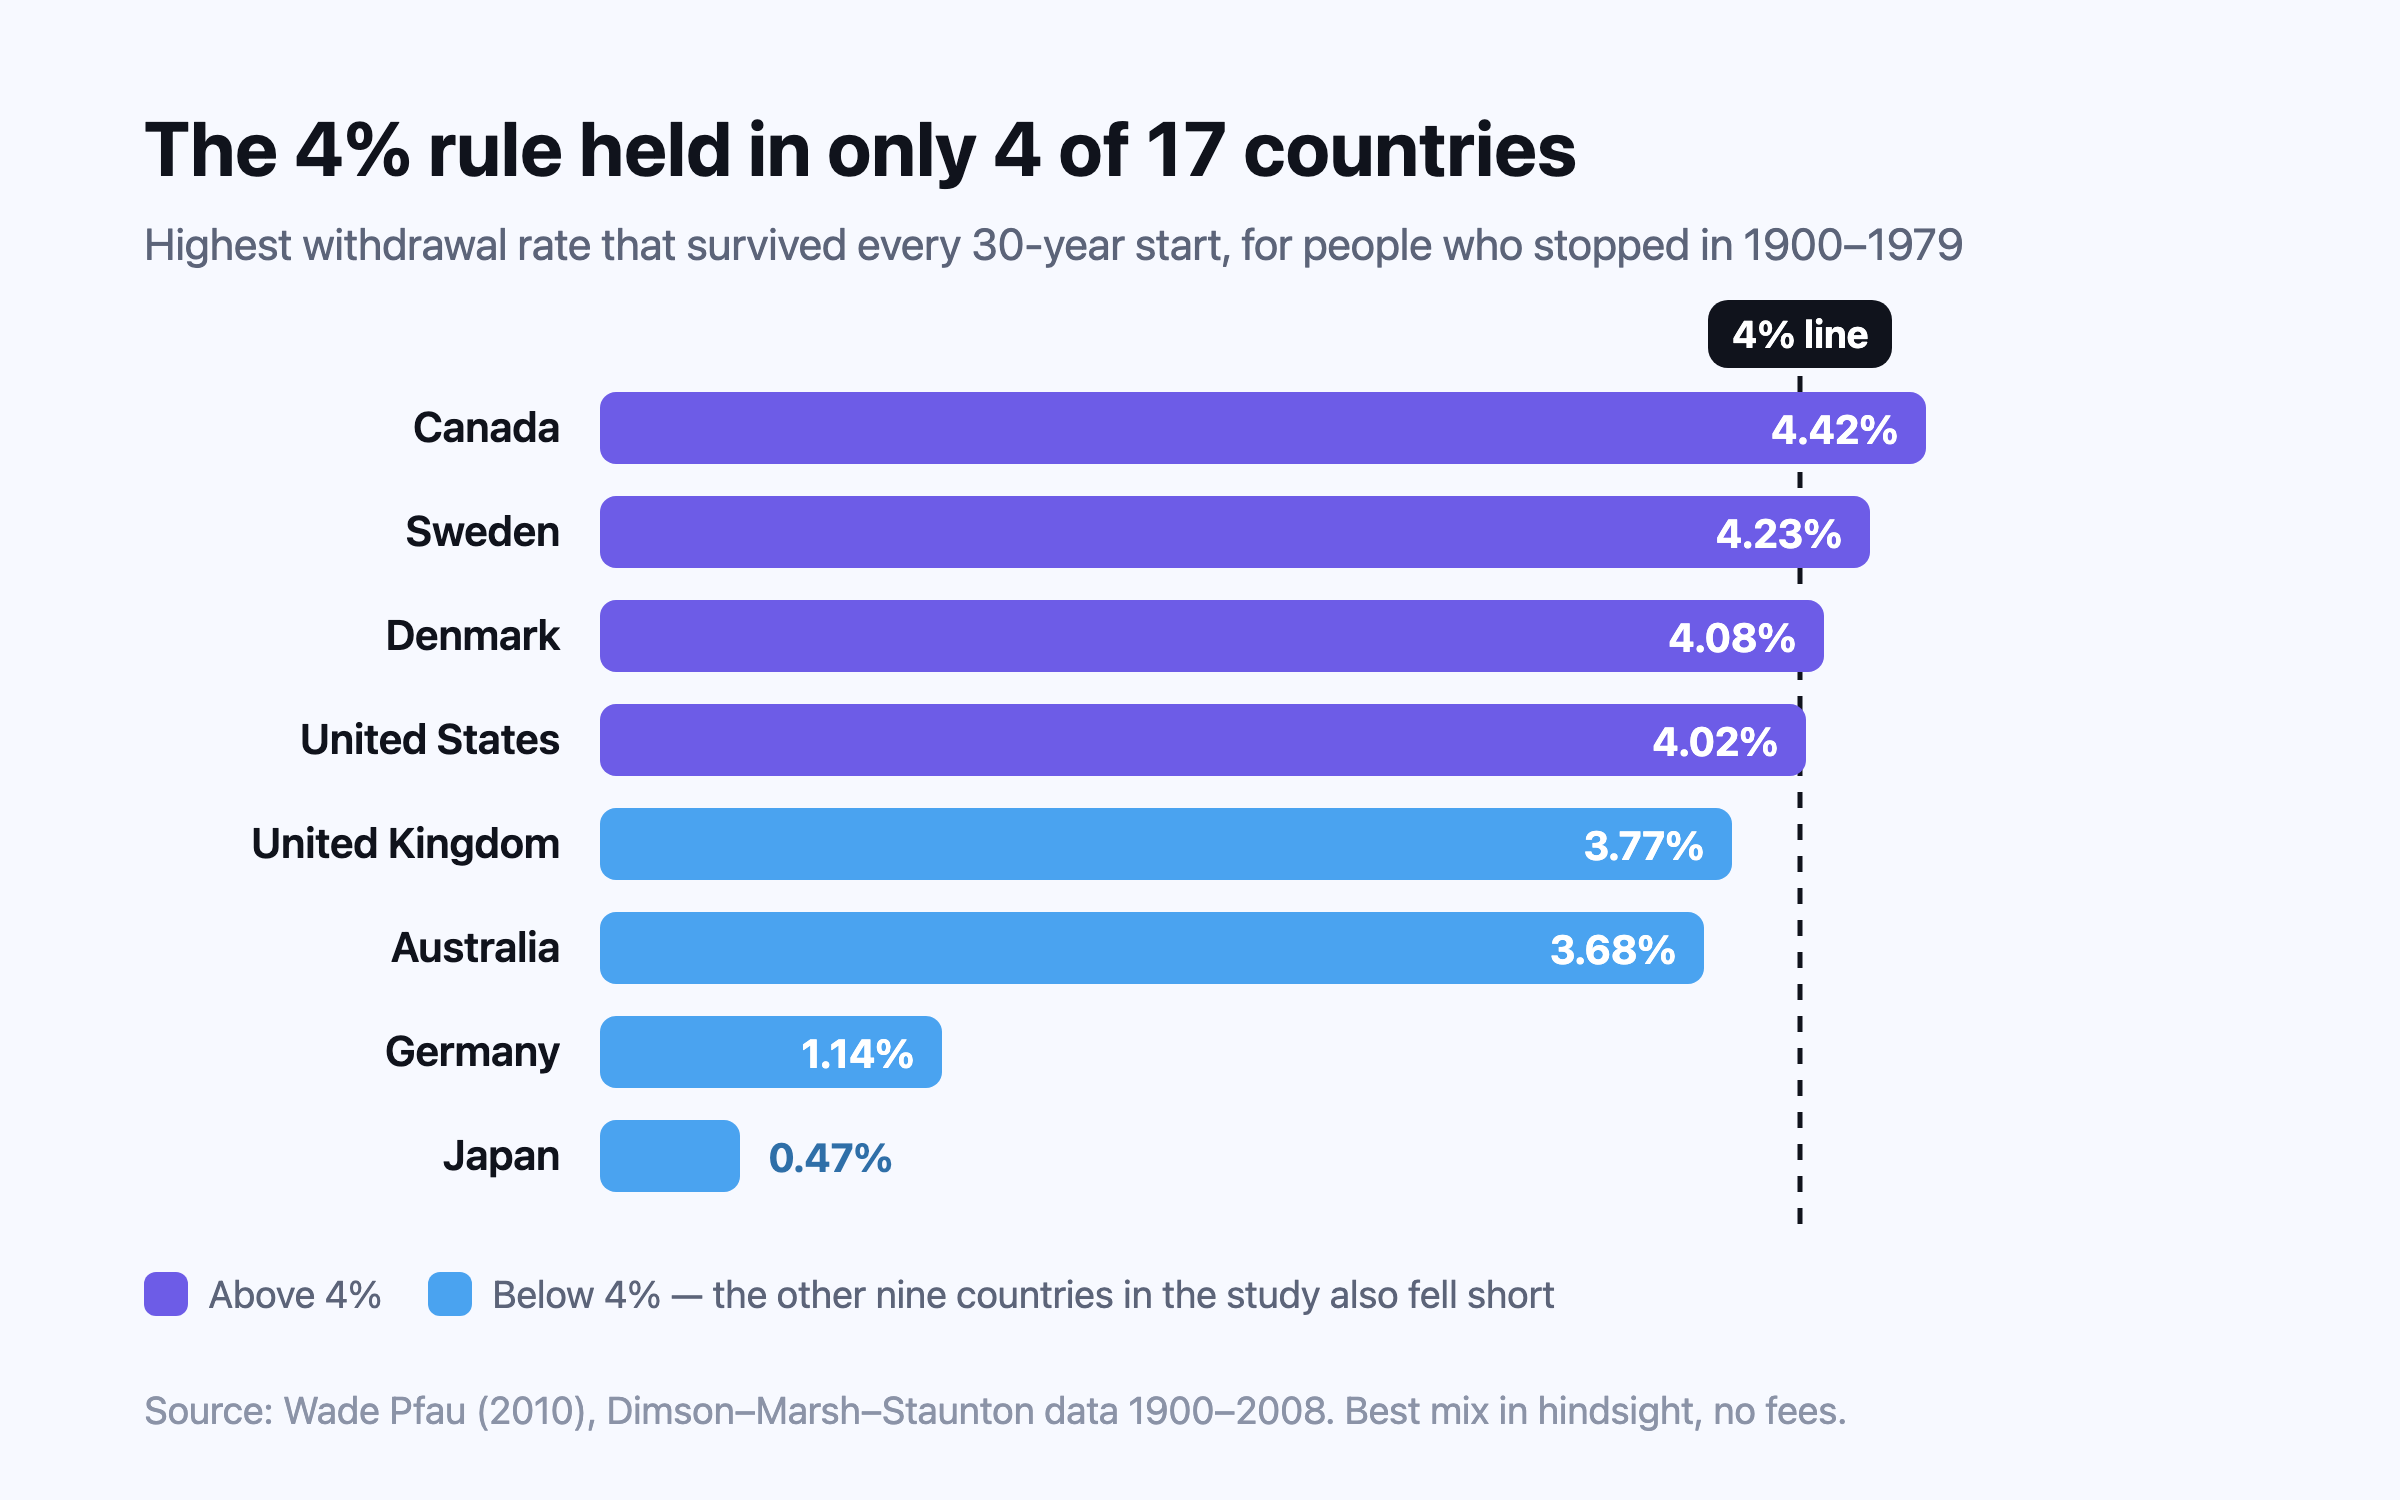
The 4% rule comes from one study of one market. In 1994 the US financial planner William Bengen found that a first-year withdrawal of 4% of a portfolio, raised each year with inflation, had never run out in less than 33 years of US data going back to 19261. When the economist Wade Pfau ran the same kind of test across 17 countries and 109 years, a rate above 4% survived every 30-year period in only four of them2. The rule is a sensible anchor and a poor promise — and the further your life is from a 65-year-old American’s in the 1990s, the more it needs adjusting.
33 years1
Shortest life of a 4% withdrawal in Bengen’s US data
4 of 172
Countries where more than 4% survived every 30-year start
3.9%3
Morningstar’s 2025 safe starting rate for 30 years
2.9%4
Morningstar’s estimate for a 50-year horizon
Where the 4% rule comes from
Bengen modelled a portfolio split evenly between large US company shares and intermediate-term Treasury bonds, withdrawing a fixed amount in real terms each year. On his reading of history, a 4% start followed by inflation-adjusted withdrawals should be safe for 30 years; 4.25% could exhaust a portfolio in as little as 28 years, and at 5% people who stopped in the late 1960s and early 1970s might have had only about 20 years1.
Four years later three professors at Trinity University in Texas — Philip Cooley, Carl Hubbard and Daniel Walz — tested 1926 to 1995 using the S&P 500 and long-term high-grade corporate bonds. Over 30 years, inflation-adjusted withdrawals of 4% succeeded in 95% of periods for a half-and-half portfolio and 98% for one holding 75% shares; at 6% those figures fell to 51% and 68%5. The “Trinity study” is why the number travelled: it gave a success rate, and many readers heard a guarantee.
What the rule actually assumes
- American market history. Both classic studies use only US returns, from the century in which the United States became the world’s dominant market2.
- Thirty years. The test asks whether money lasts three decades — about right for somebody stopping at 65, short for somebody stopping at 454.
- A fixed real withdrawal. Year one sets the amount; afterwards it follows prices, not markets. Nobody in the model cuts spending after a crash, which is why people willing to flex can start higher3.
- A balanced portfolio with no fees or tax. Bengen’s base case was half shares and half bonds, and the classic figures leave out fund and advisory costs, so those come out of the 4%, not on top of it16.
- Success means not reaching zero. A period that ends with almost nothing counts the same as one that ends with double the starting sum5.
Why the safe rate differs by country
Pfau used the Dimson, Marsh and Staunton dataset — shares, bonds, bills and inflation for 17 developed markets from 1900 to 2008 — and asked, for each country, what the highest withdrawal rate was that survived every 30-year period, even when each retiree was allowed the best asset mix with hindsight2. He called that figure the SAFEMAX.
| Country | Highest rate that survived every 30-year start, 1900–1979 | Worst year to start |
|---|---|---|
| Canada | 4.42% | 1969 |
| Sweden | 4.23% | 1914 |
| Denmark | 4.08% | 1937 |
| United States | 4.02% | 1969 |
| United Kingdom | 3.77% | 1900 |
| Australia | 3.68% | 1970 |
| Germany | 1.14% | 1914 |
| Japan | 0.47% | 1940 |
Even that table flatters the rule. Give every country the fixed half-and-half mix the classic studies used and no country clears 4%: Canada’s best is 3.94%, with the US and Denmark at 3.66%2. Pfau’s point was not that Americans should spend less, but that the American twentieth century was unusually kind, and a plan built only on it borrows that luck.
The countries at the foot of the table are those whose markets were wrecked by war and inflation — Germany, Japan, France and Italy among them. Nobody plans for that history to repeat, but it is the reason one number cannot be exported unchanged from one country to another2.
Early retirees need a lower starting rate
Morningstar’s annual research uses forward-looking return and inflation assumptions rather than history alone. Its December 2025 estimate for a new retiree is 3.9% for 30 years with a 90% chance of money remaining, from portfolios holding 30% to 50% in shares; earlier editions ranged from 3.3% in 2021 to 4.0% in 20233.
Stretch the horizon and the rate falls: Morningstar puts it at 3.5% for 35 years, 3.3% for 40 and 2.9% for 504. Somebody stopping at 40 and planning to 90 sits in the last of those, not the first.
Two things push the other way. Flexibility: in the same 2025 study, two flexible spending methods lifted the safe starting rate to 5.7%3. And breadth: in his 2025 book A Richer Retirement, Bengen raised his own figure to 4.7%, for a 30-year horizon with up to 65% in shares across more asset classes6.
What households in India, the UK, Australia and Singapore should take from it
India
India is not among Pfau’s 17 developed markets, so no century-long test of the rule exists for it2. What India has instead is higher inflation: the Reserve Bank of India targets 4% consumer inflation within a band of 2% to 6%7, and in 2009–13 inflation averaged about 10.3% a year against 4.9% in 2000–088.
Because the rule already raises withdrawals with prices, higher inflation alone does not break it; what matters is the return after inflation and how bumpy it is. The practical risks are that a household’s own costs — school fees, medical bills — can rise faster than headline inflation, and that a horizon of 40 years or more is common for anybody aiming to stop in their forties. Nivritee’s FI number divides by 3.5% for a plan settling in India, rather than 4%9.
United Kingdom
Pfau’s UK figure was 3.77%, just under the line2. A State Pension and any workplace pension cover part of spending from the age each starts, so the portfolio funds a smaller gap after that age and a larger one before it. Stopping early means a bridge of savings you can reach until pension access (when pension savings can be reached).
Australia
Australia had the highest share returns in Pfau’s data, yet a safe rate of only 3.68%, with 1970 the worst year to start2. That gap between a strong average and a weak worst case is sequence-of-returns risk at work. Superannuation is preserved until a set age, so the same bridge logic as the UK applies.
Singapore
Singapore is outside the dataset too. Its distinctive piece is CPF LIFE, a national annuity that pays monthly for life from 65, with the option to defer to 7010. For a household stopping at 45, the portfolio carries everything for 20 years and only the gap above CPF LIFE after that — two different withdrawal rates in one plan, which no single percentage captures.
Use the rate as a check, not a target
A withdrawal rate is most useful as a running reading: what you draw this year divided by what you hold at the start of it. If it drifts upward year after year, withdrawals are outpacing the portfolio. Bengen warned recent retirees against raising withdrawals just because the first few years went well, since early gains may be needed to cover weaker years later1.
- Work out what independence costs a year — your spending then, not now, less any income that continues.
- Divide it by the savings you expect on the day you stop. That is your starting withdrawal rate.
- Compare it with the evidence for your horizon rather than the 30-year headline: 3.5% for 35 years, 3.3% for 40 and 2.9% for 50 in Morningstar’s estimates4.
- Decide in advance what you would cut if markets fell in the first years — flexibility is worth more than precision3.
- Re-check it every year, with what you actually spent and actually hold.
Questions people ask
Does the 4% rule work in India?
No century-long Indian test of it exists. Higher inflation alone does not break the rule, because withdrawals already rise with prices; what matters is the return after inflation and how long the money must last. Nivritee’s FI number uses 3.5% for plans settling in India9.
What is a safe withdrawal rate for early retirement?
Lower than 4% for long horizons. Morningstar estimates 3.5% for 35 years, 3.3% for 40 and 2.9% for 50, each with a 90% chance of money remaining4. Willingness to cut spending in bad years lets you start higher.
Is the 4% rule still valid?
As a starting point, yes. Morningstar’s 2025 estimate for a 30-year horizon is 3.9%3, and Bengen now suggests 4.7% for a more diversified portfolio6 — close to the original, but neither is a guarantee.
Does the 4% rule work in the UK and Australia?
Historically it fell just short. In Pfau’s study the highest rate that survived every 30-year period was 3.77% in the UK and 3.68% in Australia, against 4.02% in the United States2.
Sources
- Determining Withdrawal Rates Using Historical Data (Journal of Financial Planning, October 1994; FPA reprint) — William P. Bengen / Financial Planning Association, 1994-10.
- An International Perspective on Safe Withdrawal Rates: The Demise of the 4 Percent Rule? (Journal of Financial Planning, December 2010) — Wade D. Pfau, via SSRN, 2010-12.
- The State of Retirement Income: 2025 — Morningstar, 2025-12.
- How Much Can You Safely Withdraw If You Retire Early? — Morningstar (Amy C. Arnott), 2026-09.
- Retirement Savings: Choosing a Withdrawal Rate That Is Sustainable (AAII Journal, February 1998) — Cooley, Hubbard & Walz / American Association of Individual Investors, 1998-02.
- The 4% Rule for Retirement Withdrawals Gets an Upgrade — Kiplinger, 2026-06.
- Monetary policy framework: the inflation target — Reserve Bank of India, 2026-03.
- Inflation, consumer prices (annual %) — India — World Bank, World Development Indicators, 2026-09.
- What is my FI number? — Nivritee Help Centre, 2026-10.
- CPF LIFE — CPF Board, Singapore, 2026.
- What is the withdrawal rate in my plan? — Nivritee Help Centre, 2026-10.
This is general information, not financial, tax or legal advice for your circumstances. Rules and figures change; check the official source for your country, and consult a licensed professional before making financial decisions. Projections are estimates, not predictions.