Over 15 years, about nine in ten active US large-cap funds trailed the S&P 500 — and India and Europe tell a similar long-run story, with a few real exceptions
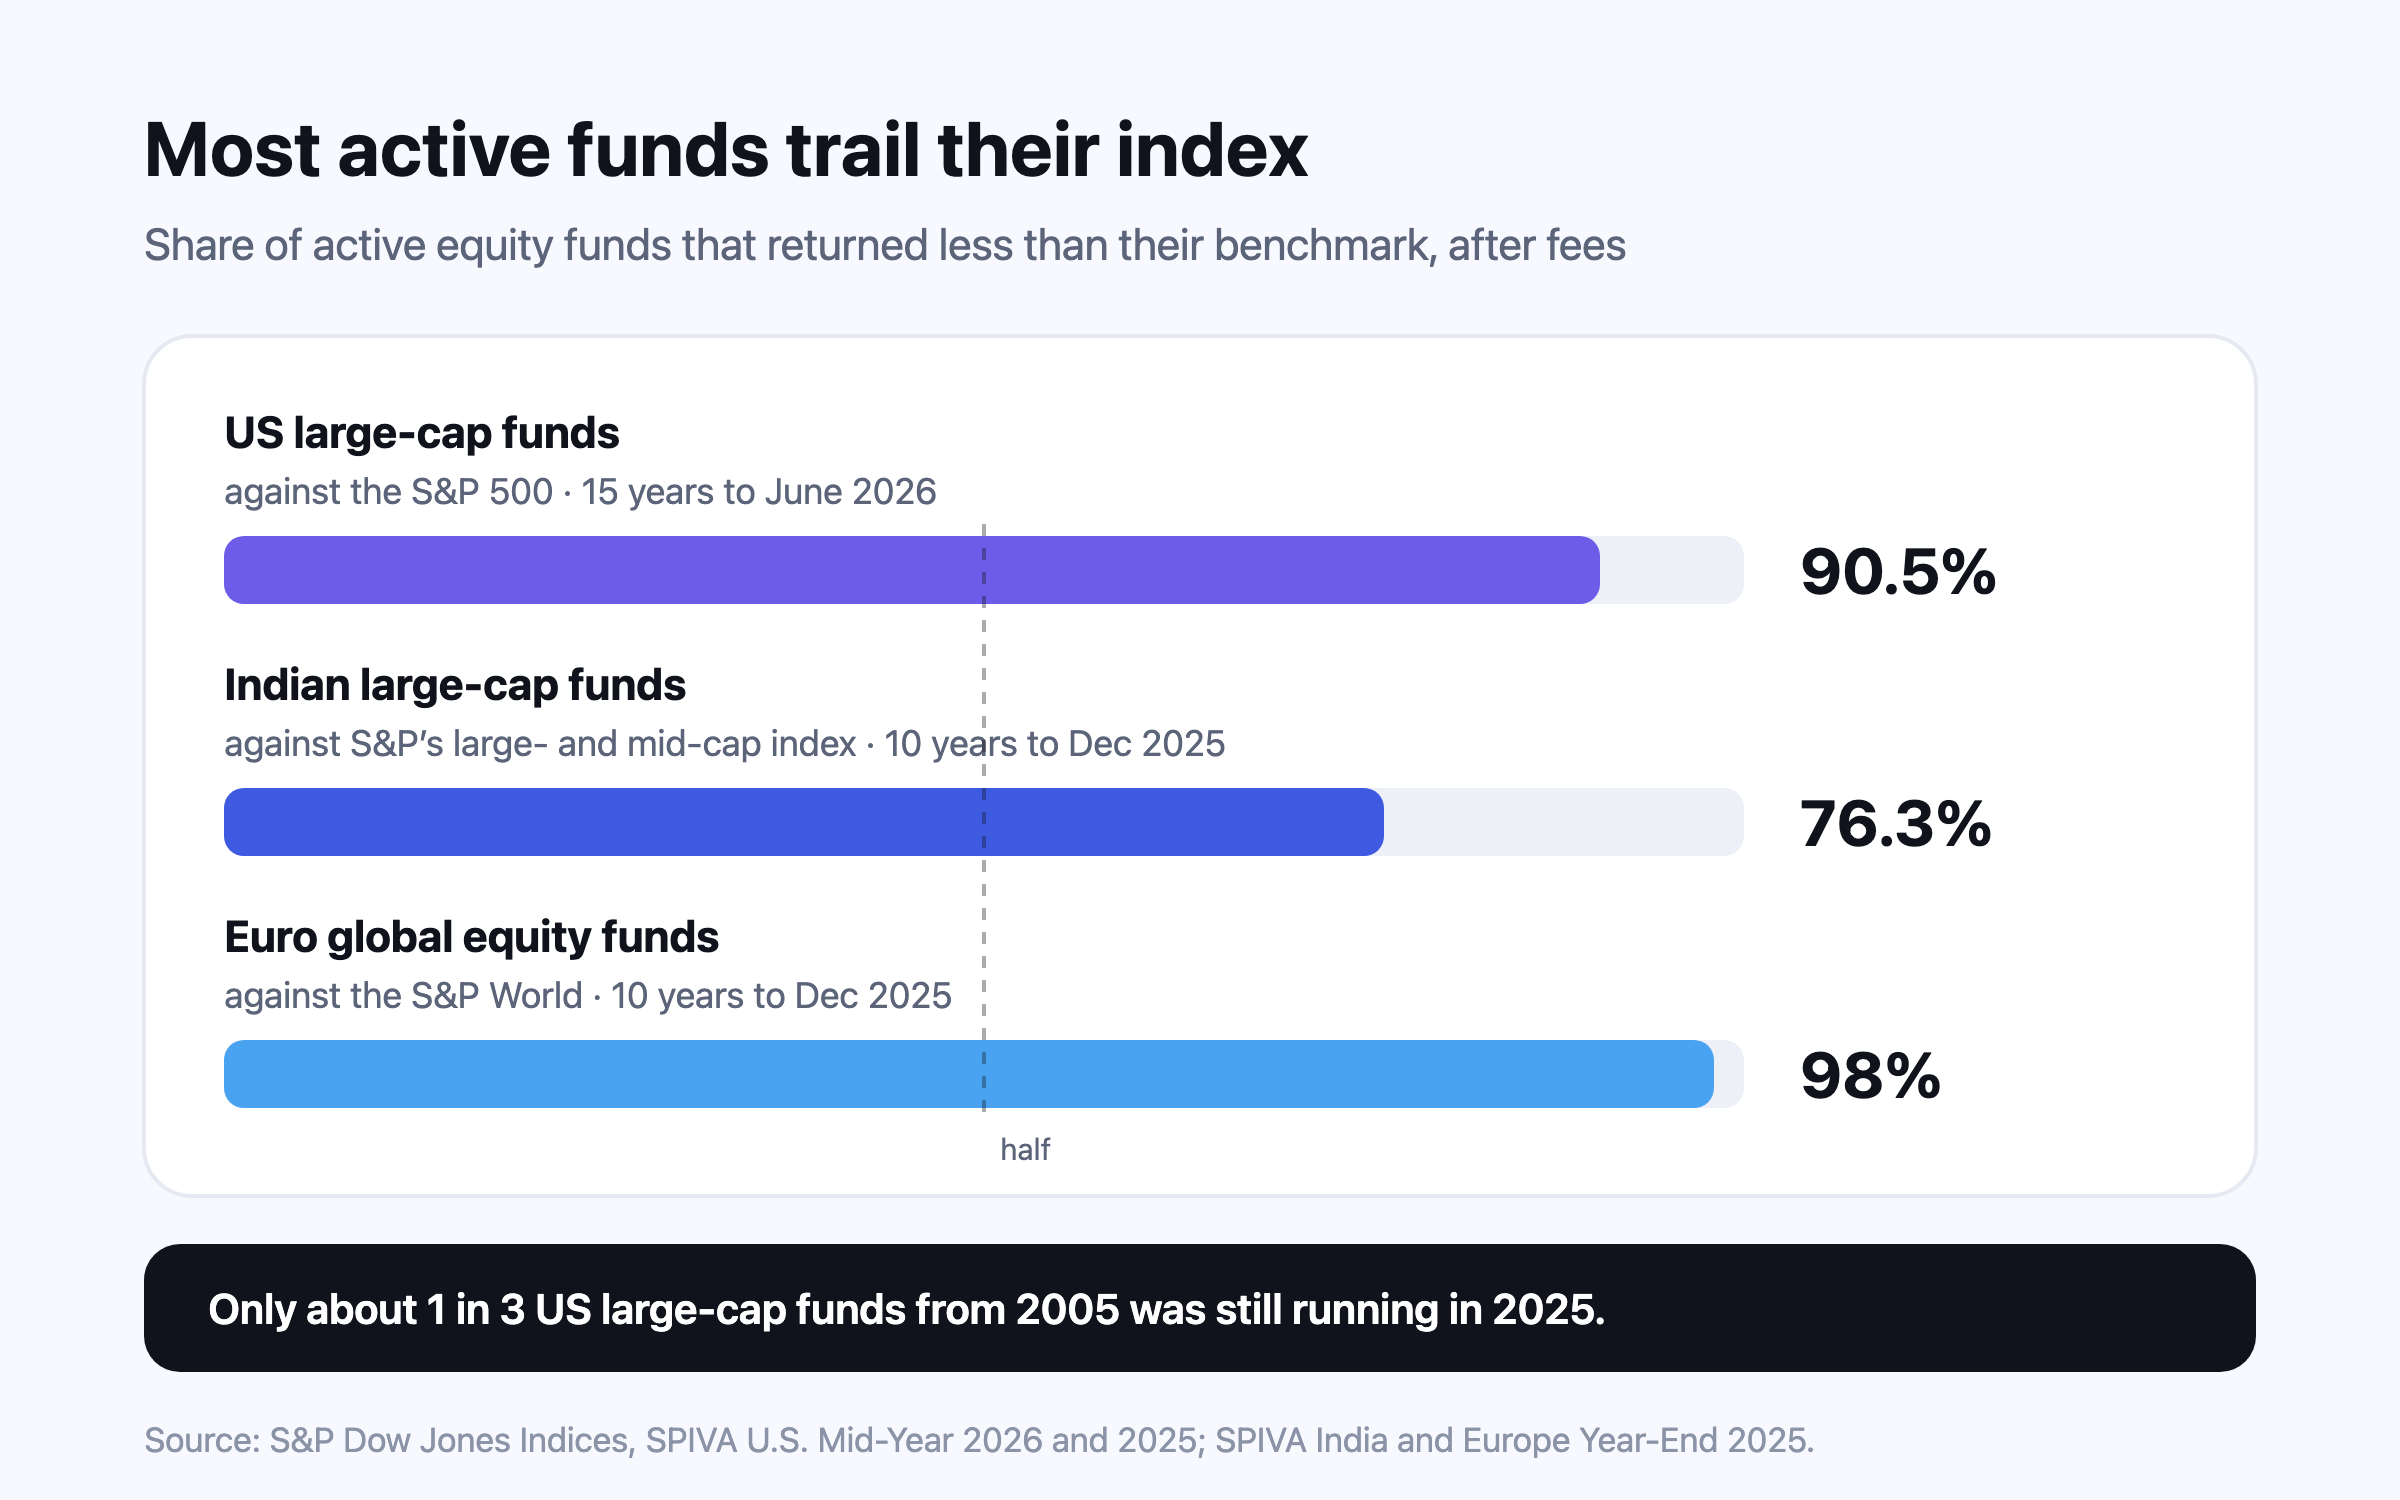
Most actively managed equity funds trail their benchmark after fees, and the share grows with time: to June 2026, 90.5% of US large-cap funds lagged the S&P 500 over 15 years. India and Europe show the same long-run pattern, with real exceptions — Indian mid- and small-cap funds had their best year against the index since 2014 in 2025. Winners rarely stay winners, and the cheapest funds succeed most often.
Every fund manager’s pitch rests on one claim: that a person picking shares can do better than simply owning the whole market at a low cost. For about a quarter of a century, S&P Dow Jones Indices has tested that claim twice a year in its SPIVA scorecards (S&P Indices Versus Active), which compare actively managed funds with the index each one is meant to beat. This article reads the latest scorecards for the United States, India and Europe, explains why the results look the way they do, and sets out where active managers have genuinely done better.
90.5%1
of US large-cap funds trailed the S&P 500 over 15 years to June 2026
76.3%2
of Indian large-cap funds trailed their benchmark over 10 years to December 2025
98%3
of euro-denominated global equity funds trailed over 10 years to December 2025
34.7%4
of US large-cap funds that existed 20 years earlier were still running in June 2025
What SPIVA measures, and why it is hard to argue with
A SPIVA scorecard asks one question per fund category: what share of active funds returned less than their benchmark over one, three, five, ten, fifteen and twenty years, after fees. Three design choices make it unusually hard to flatter. Funds that were merged or closed during the period stay in the count as funds that did not beat the index. Each category is measured against an index of the kind of shares it buys, so a small-cap fund is not judged against large companies. And every fund that existed at the start is included, not only the ones a fund house still advertises4.
The scorecards do not say that an index fund is always the better buy, or that no manager is skilful. They say how the whole population of active funds in a category fared against a low-cost alternative that was available all along — which is the comparison an investor choosing between them actually faces.
The scorecards: the US, India and Europe
| Fund category (benchmark) | 1 year | 5 years | 10 years | 15 years |
|---|---|---|---|---|
| US large-cap (S&P 500), to June 2026 | 78.7% | 89.3% | 83.3% | 90.5% |
| India large-cap (S&P India LargeMidCap), to December 2025 | 75.0% | 84.4% | 76.3% | not reported |
| India mid- and small-cap (S&P India SmallCap), to December 2025 | 12.1% | 46.0% | 79.0% | not reported |
| India ELSS tax-saving funds (S&P India BMI), to December 2025 | 69.2% | 58.5% | 82.9% | not reported |
| Euro global equity (S&P World), to December 2025 | 71% | 95% | 98% | not reported |
| UK equity (S&P United Kingdom BMI), to December 2025 | 88% | 92% | 93% | not reported |
United States. Over the year to June 2026, 78.7% of active large-cap funds returned less than the S&P 500; over 15 years it was 90.5%, and over 20 years 92.6%. Across all US domestic equity funds, 94.9% trailed over 20 years1. Calendar 2025 was the fourth-worst year for large-cap managers in the scorecard’s 25-year history, with 79% behind the index1.
India. In 2025, 75.0% of Indian large-cap funds trailed S&P’s large- and mid-cap benchmark, and 76.3% did so over ten years; the benchmark rose 8.9% in the year while the average large-cap fund rose 7.3% (9.4% weighted by assets)2. S&P’s summary was that a firm majority of funds in every Indian category underperformed over the decade to December 20252.
Europe. Active managers in Europe had what S&P called material opportunities in 2025, yet the majority underperformed in 18 of 21 categories. In 2025, 71% of euro-denominated global equity funds trailed the S&P World and 82% of pan-European funds trailed the S&P Europe 350; in the UK, 88% of broad UK equity funds and 97% of UK small-cap funds fell short. Over ten years, 98% of euro global equity funds trailed3.
Morningstar runs a separate test with a different method — each active fund against the average of the index funds actually available in its category — and finds the same direction. Over the ten years to 2025, just 21% of US active funds both survived and beat their passive peers; among US large-cap funds it was 10%5.
The funds that disappear
A fund house that closes or merges its weakest funds can show a strong-looking range years later, because the failures are no longer on the list. That is survivorship bias, and SPIVA measures it directly. Of the 758 US large-cap funds running in mid-2005, only 34.7% were still operating twenty years later; over ten years 65.5% survived, and over fifteen about half4.
Morningstar’s figures make the same point from the other side: of the US large-growth funds that existed two decades ago, nearly 66% have closed, and just 1% outperformed their average index-fund peer5. A league table of today’s funds is a list of survivors, and judging a category by its survivors overstates how well its managers did.
Where active funds have done better
The data does not say active management never works. It says the odds differ by market, by period and by kind of fund, and the exceptions are worth knowing.
- Indian mid- and small-cap funds. In 2025 only 12.1% of these funds trailed their benchmark, the S&P India SmallCap — S&P described it as their best relative result since 2014. Over ten years, though, 79.0% trailed2.
- Indian tax-saving (ELSS) funds, over short spells. Only 35.9% trailed over the year to June 2025, against 86.8% over ten years6; in calendar 2025 the share that trailed was back up to 69.2%2.
- Emerging-market and international funds in some years. In the first half of 2026, only 38% of US-listed emerging-market funds and 49% of international funds trailed their benchmarks1. Morningstar found diversified emerging-market funds had the highest success rate of any category in 2025, at 64%5.
- Bonds and smaller companies, relatively. Morningstar’s ten-year success rates were highest among bond and real-estate funds — 42% for the bond group — and were 22% for US mid-cap and 25% for small-cap funds against 10% for large-cap5.
The pattern is consistent with a simple idea: active managers have more room where markets are less heavily researched, where the index is narrow or lopsided, or where a broad index holds things a manager can sensibly avoid. Even there, the advantage has tended to fade as the horizon lengthens, which is the part a long-term investor has to weigh.
Does last year’s winner win again?
If skill were common and durable, the best funds in one period would tend to stay near the top in the next. S&P’s Persistence Scorecards test exactly that. In the US, 29% of the large-cap funds in the top quarter in 2023 stayed in the top quarter in each of the next two years. Over five years the trail almost disappears: apart from small-cap funds, none of the top-quarter funds in any US equity category in 2021 remained there through 2025, and only 2% of top-quarter small-cap funds did7.
A looser test gives the same answer. Only 4.5% of US large-cap funds in the top half in 2021 stayed above the median in each of the next four years, against the 6.25% that pure chance would have produced7. In Europe, S&P found no strong evidence of persistence in any category or period it examined, although somewhat more funds stayed in the top half year after year than chance alone would produce8. Choosing a fund because it topped last year’s table has, historically, been a weak guide to which fund tops the next one.
Why costs decide most of it
The economist William Sharpe set out the arithmetic in 1991. Before costs, the average actively managed rupee or dollar must earn the market’s return, because active investors as a group own the market; after costs, it must earn less, because active management charges more9. Nothing about this requires managers to be unskilled — only that their combined trading cannot beat itself.
The cost gap is large. In the US in 2025, actively managed equity mutual funds charged an asset-weighted average of 0.64% a year, against 0.05% for index equity mutual funds10. That difference has to be earned back every year before an active fund even draws level. Morningstar found that, over the ten years to 2025, 31% of active funds in the cheapest fifth of their categories beat their passive peers, against 17% of the priciest fifth5. How a yearly fee compounds over decades is worked through in what fees cost over 30 years.
The argument has a fair counterpoint. Lasse Heje Pedersen showed in 2018 that Sharpe’s equality rests on a market that never changes, whereas real indexes add and drop companies and new shares are issued, so even index investors must trade — which leaves room for active managers, in aggregate, to add some value11. It is a correction to the theory, not a reversal of the scorecards: the measured results above are after all of these effects.
What to take from the data
- The scorecards make a low-cost index fund the natural yardstick for any broad-market fund: an active fund has to earn back its extra cost before it even draws level.
- If you do hold active funds, judge them over five years or more and against the right benchmark — and expect the odds to fall as the horizon lengthens.
- Compare your own portfolio’s return with what your financial independence plan assumes, not with last year’s best fund.
- Keep an eye on single-company bets: an index fund is hundreds of companies, while one share can halve in a week.
None of this is a recommendation to buy or sell any fund. It is information about what the scorecards measured, not financial advice; your own costs, taxes and circumstances matter more than any average.
Questions people ask
Do index funds beat active funds?
Over long periods, most of the time. To June 2026, 90.5% of US large-cap active funds trailed the S&P 500 over 15 years, and 76.3% of Indian large-cap funds trailed their benchmark over ten years to December 202512. Some categories and years are exceptions.
What is the SPIVA report?
SPIVA (S&P Indices Versus Active) is a scorecard published by S&P Dow Jones Indices that measures what share of active funds trailed their benchmark after fees, counting funds that closed along the way. Separate editions cover the US, India, Europe and other regions4.
Are active mutual funds better in India?
In some categories and years, yes: most Indian mid- and small-cap funds beat their benchmark in 2025, their best relative year since 20142. Over the ten years to December 2025, though, a firm majority of funds in every Indian category trailed, including 79.0% of mid- and small-cap funds2.
Why do most active funds underperform?
Mainly costs. Before costs, active investors as a group earn the market return; after costs they must earn less9. In the US, active equity funds averaged 0.64% a year in 2025 against 0.05% for index equity funds10.
Can I pick the active funds that will outperform?
The evidence says it is hard. Only 4.5% of top-half US large-cap funds stayed above the median for five years running, below the 6.25% chance would produce, and S&P found no strong evidence of persistence in Europe either78. Low cost has been the more reliable signal5.
Sources
- SPIVA U.S. Scorecard, Mid-Year 2026 (periods to 30 June 2026; calendar 2025 from the Year-End 2025 edition) — S&P Dow Jones Indices, 2026-06.
- SPIVA India Scorecard, Year-End 2025 — S&P Dow Jones Indices, 2025-12.
- SPIVA Europe Scorecard, Year-End 2025 — S&P Dow Jones Indices, 2025-12.
- SPIVA U.S. Scorecard, Mid-Year 2025 (Report 2: survivorship; methodology) — S&P Dow Jones Indices, 2025-06.
- Morningstar’s US Active/Passive Barometer, Year-End 2025 (Bryan Armour and others) — Morningstar Manager Research, 2026-02.
- SPIVA India Scorecard, Mid-Year 2025 — S&P Dow Jones Indices, 2025-06.
- U.S. Persistence Scorecard, Year-End 2025 — S&P Dow Jones Indices, 2025-12.
- Europe Persistence Scorecard, Year-End 2025 — S&P Dow Jones Indices, 2025-12.
- The Arithmetic of Active Management (Financial Analysts Journal 47(1), 7–9) — William F. Sharpe, Stanford Graduate School of Business, 1991.
- Trends in the Expenses and Fees of Funds, 2025 (ICI Research Perspective, vol. 32, no. 1) — Investment Company Institute, 2026-03.
- Sharpening the Arithmetic of Active Management (Financial Analysts Journal 74(1)) — Lasse Heje Pedersen, CFA Institute, 2018.
- What are the six investment readings? — Nivritee Help Centre, 2026-10.
This is general information, not financial, tax or legal advice for your circumstances. Rules and figures change; check the official source for your country, and consult a licensed professional before making financial decisions. Projections are estimates, not predictions.