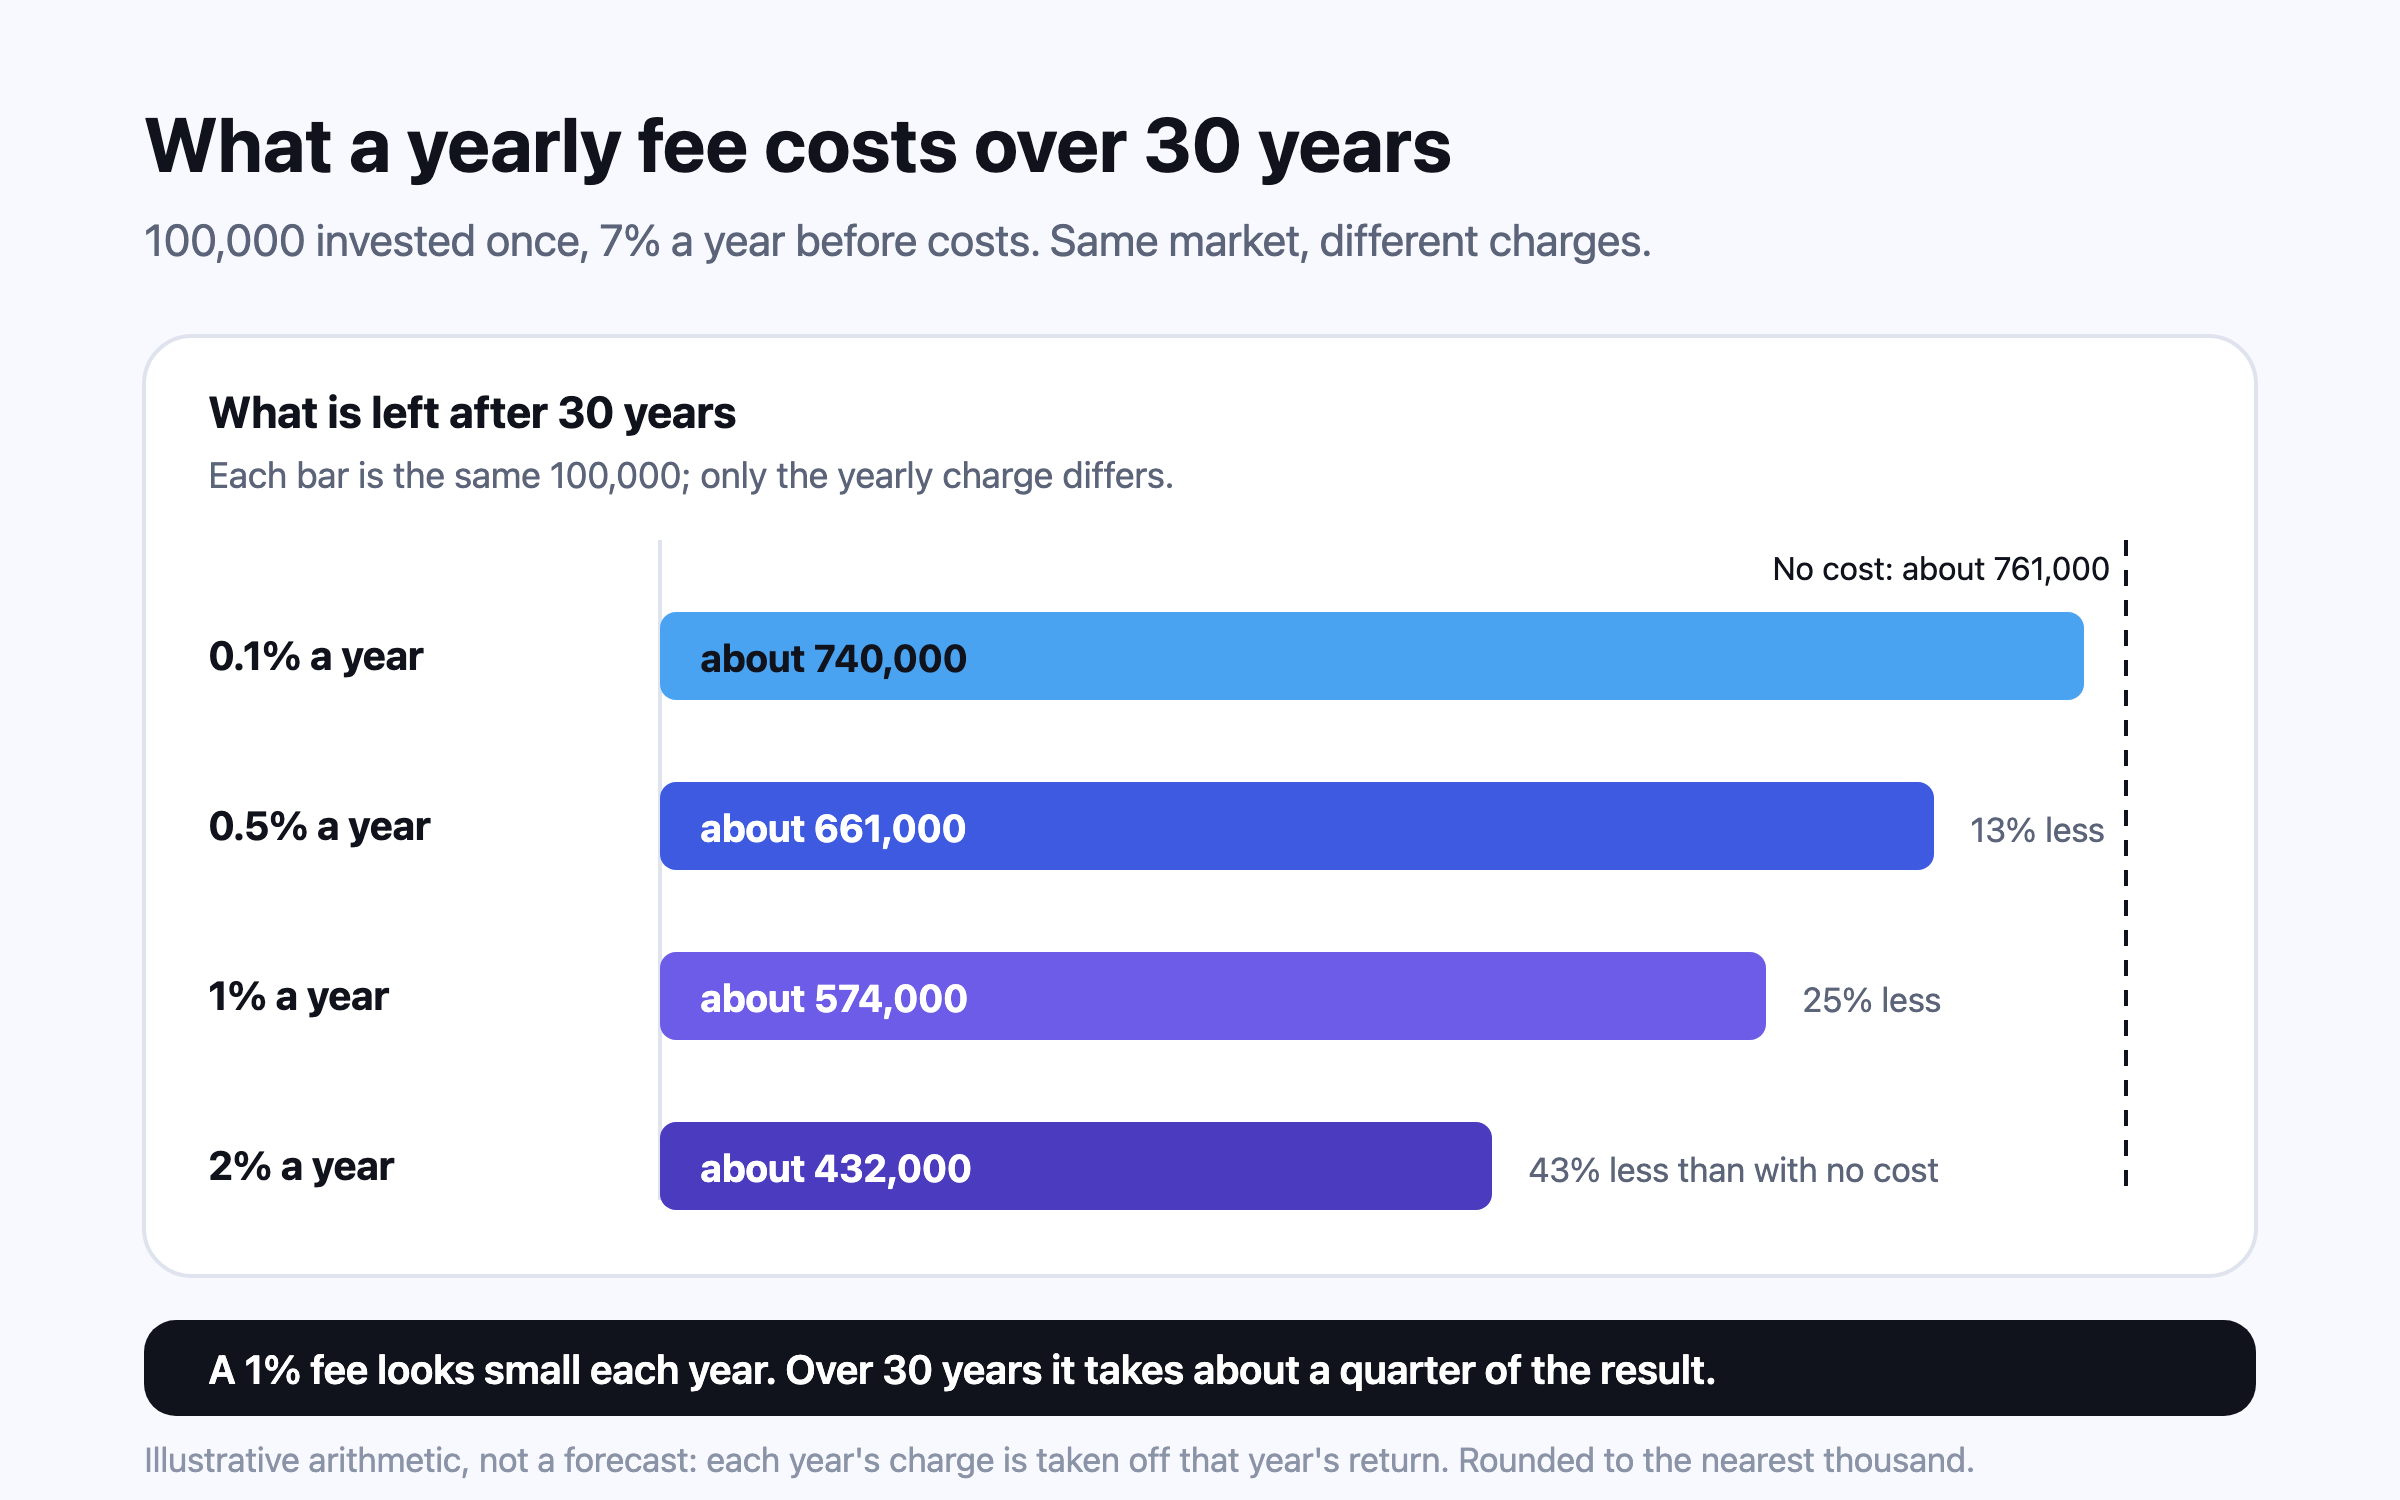
A 1% yearly fee takes about a quarter of what a portfolio would have grown to in 30 years.
A fee is charged every year on the whole balance, so it compounds against you. On 7% a year before costs, a 1% yearly charge leaves about a quarter less after 30 years than no charge at all, and 2% leaves over 40% less. Fund costs have fallen sharply — US equity funds averaged 0.40% in 2025 against 1.04% in 1996 — but platform and adviser layers sit on top, and in India a regular plan carries a distributor’s commission that a direct plan does not.
Investment costs are quoted as small yearly percentages, which is exactly why they are underestimated. A fee is taken every year from the whole balance, not from the gain, and the money it takes never compounds for you again. The US Securities and Exchange Commission illustrates it with $100,000 growing at 4% a year for 20 years: with ongoing fees of 0.25% it ends at about $208,000, with 0.50% about $198,000, and with 1% about $179,0001. Over the 30 or 40 years a financial independence plan runs, the gap is larger still.
The arithmetic: a fee compounds like a return
The simplest way to see it is to take one sum, one market return and change only the yearly charge. The table below invests 100,000 once and lets it grow for 30 years at the same steady market return before costs; each year’s charge is taken off that year’s return, and nothing else changes.
| Yearly all-in cost | Return you keep | After 30 years | Less than with no cost |
|---|---|---|---|
| None | 7.0% a year | about 761,000 | — |
| 0.1% | 6.9% a year | about 740,000 | about 3% |
| 0.5% | 6.5% a year | about 661,000 | about 13% |
| 1% | 6.0% a year | about 574,000 | about 25% |
| 2% | 5.0% a year | about 432,000 | about 43% |
Two things stand out. The damage is not proportional to the fee: doubling the charge from one point to two more than doubles the money lost, because each year’s loss also loses its own future growth. And the share lost depends on time, not on the size of the portfolio — the same charge takes the same fraction of a small balance and a large one.
Measured against the real gain rather than the balance, a fee looks larger again. The SEC’s own worked example shows the gap between a 0.25% and a 1% fund widening every year, reaching roughly $29,000 on the original $100,000 after 20 years1. If a portfolio earns 7% and prices rise 3%, a 1% charge takes about a quarter of the 4% real gain — the part that actually raises your standard of living2.
What funds charge now, and how far costs have fallen
1.04% → 0.40%3
US equity mutual funds, asset-weighted expense ratio, 1996 to 2025
0.05%3
US index equity mutual funds, 2025
0.14%3
US index equity ETFs, 2025
0.32%4
Average US fund, asset-weighted, 2025 (0.80% two decades earlier)
The Investment Company Institute’s annual cost study shows the asset-weighted average expense ratio of US equity mutual funds falling from 1.04% in 1996 to 0.40% in 2025, and bond funds from 0.84% to 0.36%3. Actively managed equity funds averaged 0.64% in 2025, against 0.05% for index equity mutual funds and 0.14% for index equity ETFs3. “Asset-weighted” matters: the averages fall partly because investors moved their money into cheaper funds, not only because funds cut prices.
Morningstar’s 2026 fee study puts the asset-weighted average paid across US funds at 0.32% in 2025, less than half the 0.80% of two decades earlier, and Morningstar’s earlier research found the expense ratio a better predictor of a fund’s later results than any other variable it tested, past performance included4. Over the ten years to 2025, 31% of active funds in the cheapest fifth of their category beat their average passive rival, against 17% of the dearest fifth4. For why most active funds trail their index in the first place, see index vs active funds: the SPIVA data.
India: SEBI’s expense caps and direct versus regular plans
Indian mutual funds quote a total expense ratio (TER), deducted daily from the scheme’s assets and so already inside its NAV. SEBI caps it by size: the bigger the scheme, the lower the ceiling. In December 2025 SEBI’s board approved new mutual fund regulations under which the cap becomes a base expense ratio that excludes statutory levies such as STT, GST and stamp duty, which are now charged at actual cost on top5. The new limits apply from 1 April 20266.
| Open-ended scheme size (₹ crore) | Equity: old cap (with levies) | Equity: new base cap (without levies) | Debt and other: old | Debt and other: new |
|---|---|---|---|---|
| Up to 500 | 2.25% | 2.10% | 2.00% | 1.85% |
| 500–750 | 2.00% | 1.90% | 1.75% | 1.65% |
| 750–2,000 | 1.75% | 1.60% | 1.50% | 1.40% |
| 2,000–5,000 | 1.60% | 1.50% | 1.35% | 1.25% |
| 5,000–10,000 | 1.50% | 1.40% | 1.25% | 1.15% |
| 10,000–50,000 | 1.45% falling to 1.10% | 1.35% falling to 1.00% | 1.20% falling to 0.85% | 1.10% falling to 0.75% |
| Above 50,000 | 1.05% | 0.95% | 0.80% | 0.70% |
| Index funds and ETFs | 1.00% | 0.90% | 1.00% | 0.90% |
Since 1 January 2013, every scheme has had to offer a direct plan for money invested without a distributor: same portfolio, same fund manager, a separate NAV and a lower expense ratio that leaves out distribution expenses and commission7. SEBI’s own board papers describe distribution expense as the only substantive difference between the two plans; management and other costs are common to both8. SEBI publishes no single average for the gap, and it varies by scheme, so the table below shows what two illustrative gaps would do.
| ₹10,000 a month for 30 years (₹36 lakh paid in) | Return after costs | Value after 30 years |
|---|---|---|
| Plan A | 11.0% a year | about ₹2.80 crore |
| Plan B: 0.5 points more in costs | 10.5% a year | about ₹2.52 crore |
| Plan C: 1 point more in costs | 10.0% a year | about ₹2.26 crore |
The fair other side: a regular plan pays somebody, and that person may earn their fee by keeping a household invested through a crash or stopping it from buying the wrong product. What matters is knowing the price and deciding whether the service is worth it. A direct plan with no help at all is not automatically the cheaper outcome if it leads to panic selling.
The UK: fund charges, platform fees and the layers on top
British funds quote an ongoing charges figure (OCF). In its Asset Management Market Study, the Financial Conduct Authority found an average ongoing charge of 0.90% for actively managed UK large-company equity funds against 0.15% for passive ones, asset-weighted, and identified about £109 billion in “active” funds that closely tracked the market while costing considerably more than passive funds10.
The fund is only one layer. Most UK investors hold funds through a platform, and the FCA’s platforms study found that the yearly charge on a £5,000 stocks and shares ISA ranged from 0.20% to 2.40% depending on the platform, a difference worth up to £650 over five years at 5% growth11. Platform fees may be a percentage, a flat fee or a mix, so the cheapest structure depends on the size of the account.
Advisory fees: the largest layer, and the one with a case for it
An adviser paid as a percentage of assets is usually the largest single cost a household pays. Kitces Research found that 62% of the US advisers it surveyed charge at least 1% a year on a $1 million portfolio, and that 92% use asset-based fees in some form12. Stacked on a fund’s own charge and a platform fee, an adviser’s fee is what moves a household from the top rows of the first table to the bottom ones.
Vanguard’s “Advisor’s Alpha” research argues the other side: that an adviser can add up to, or even beyond, about 3% a year in net returns, mostly through behavioural coaching, rebalancing, tax-aware placement and cheaper implementation13. Vanguard is clear that this is a potential, not a yearly certainty — much of it arrives in the few years when a client would otherwise have sold in a panic. The honest summary is that an adviser can be worth more than their fee, but only the household can judge whether theirs is, and only if they know what the fee is in money.
- List every account and fund you hold, and each one’s TER, OCF or expense ratio from its fact sheet.
- Add the platform or account fee and any adviser fee, each as a share of what you hold.
- Multiply the total by your balance: that is your yearly cost in money, not in percentage points.
- Read your plan’s return as the return after that cost: whatever your plan assumes, the market has to deliver that much plus every layer you pay.
- Decide whether each layer buys something you value. Cost is one of the few parts of investing you can set in advance.
Fees when you stop earning
Fees do not stop when contributions do. Somebody drawing 4% a year from a portfolio that also pays 1% a year in charges needs it to support 5% a year — a quarter more than the withdrawal alone2. Because safe withdrawal rates for long horizons are already lower than the 30-year headline, a cost that looks modest in a saver’s portfolio can decide whether a drawdown plan lasts (the 4% rule by country).
Checking fees against your own plan
The question for a household is not whether a fund is cheap in the abstract but whether what it earns after every charge keeps up with what the plan assumes. A fund’s expense ratio is already inside its daily price, so a return measured on prices is a return after the fund’s own costs; a fee charged on a purchase is part of what you paid.
Questions people ask
How much does a 1% fee cost over 30 years?
At 7% a year before costs, a 1% yearly charge leaves about a quarter less after 30 years than no charge. The SEC shows the same effect over 20 years: $100,000 at 4% ends near $208,000 with a 0.25% fee and $179,000 with 1%1.
What is a good expense ratio for a mutual fund?
There is no single right figure, but the averages give a reference: US index equity mutual funds averaged 0.05% in 2025 and all US equity mutual funds 0.40%, asset-weighted3. In India, SEBI caps a small equity scheme’s base expense ratio at 2.10% and index funds at 0.90%5.
What is the difference between direct and regular mutual funds?
They hold the same portfolio, but a regular plan’s expense ratio includes the distributor’s commission and a direct plan’s does not, so the direct plan has a lower expense ratio and a separate NAV. SEBI has required every scheme to offer a direct plan since 1 January 20137.
What are SEBI’s new expense ratio limits?
From 1 April 2026 the cap is a base expense ratio that excludes statutory levies, which are charged on top at actual cost6. For open-ended equity schemes it runs from 2.10% for schemes up to ₹500 crore down to 0.95% above ₹50,000 crore5.
Is a 1% financial adviser fee worth it?
Most US advisers who charge on assets take at least 1% a year on a $1 million portfolio — 62% in Kitces Research’s survey12. Vanguard estimates good advice can add up to about 3% a year, mostly by keeping people invested13 — so it can be worth it, but only if you know the fee in money and what it buys.
Sources
- Investor Bulletin: How Fees and Expenses Affect Your Investment Portfolio — U.S. Securities and Exchange Commission, Office of Investor Education and Assistance, 2025-07.
- How much do investment fees really matter? — Nivritee Help Centre, 2026-10.
- Trends in the Expenses and Fees of Funds, 2025 (ICI Research Perspective, vol. 32, no. 1) — Investment Company Institute, 2026-03.
- Testimony of Jeffrey Ptak, Morningstar, to the House Financial Services Subcommittee on Capital Markets (citing Morningstar’s 2026 US Fund Fee Study) — U.S. House of Representatives / Morningstar, 2026-06.
- SEBI Board Meeting, PR No. 84/2025 — review of the Mutual Fund Regulations and the Base Expense Ratio — Securities and Exchange Board of India, 2025-12.
- New MF expense ratio norms to be implemented from April 1, 2026 — Cafemutual, 2026-01.
- Circular CIR/IMD/DF/21/2012 — steps to re-energise the mutual fund industry (direct plans) — Securities and Exchange Board of India, 2012-09.
- Board memorandum on mutual fund expenses (direct and regular plans) — Securities and Exchange Board of India, 2026-01.
- SIP Calculator (investor education) — Securities and Exchange Board of India, 2026.
- Asset Management Market Study — Interim Report (MS15/2.2) — Financial Conduct Authority, 2016-11.
- Investment Platforms Market Study — Final Report (MS17/1.3) — Financial Conduct Authority, 2019-03.
- How Financial Advisors Actually Charge For Their Services — Kitces.com (Sydney Squires, Kitces Research), 2025-06.
- Putting a value on your value: Quantifying Vanguard Advisor’s Alpha — Vanguard, 2022-07.
- What are the six investment readings? — Nivritee Help Centre, 2026-10.
- What are the levers under “What would move this”? — Nivritee Help Centre, 2026-10.
This is general information, not financial, tax or legal advice for your circumstances. Rules and figures change; check the official source for your country, and consult a licensed professional before making financial decisions. Projections are estimates, not predictions.