Since 1900, shares have beaten bonds and cash in every market with an unbroken record — but nobody could have picked the winning country, and two markets went to zero
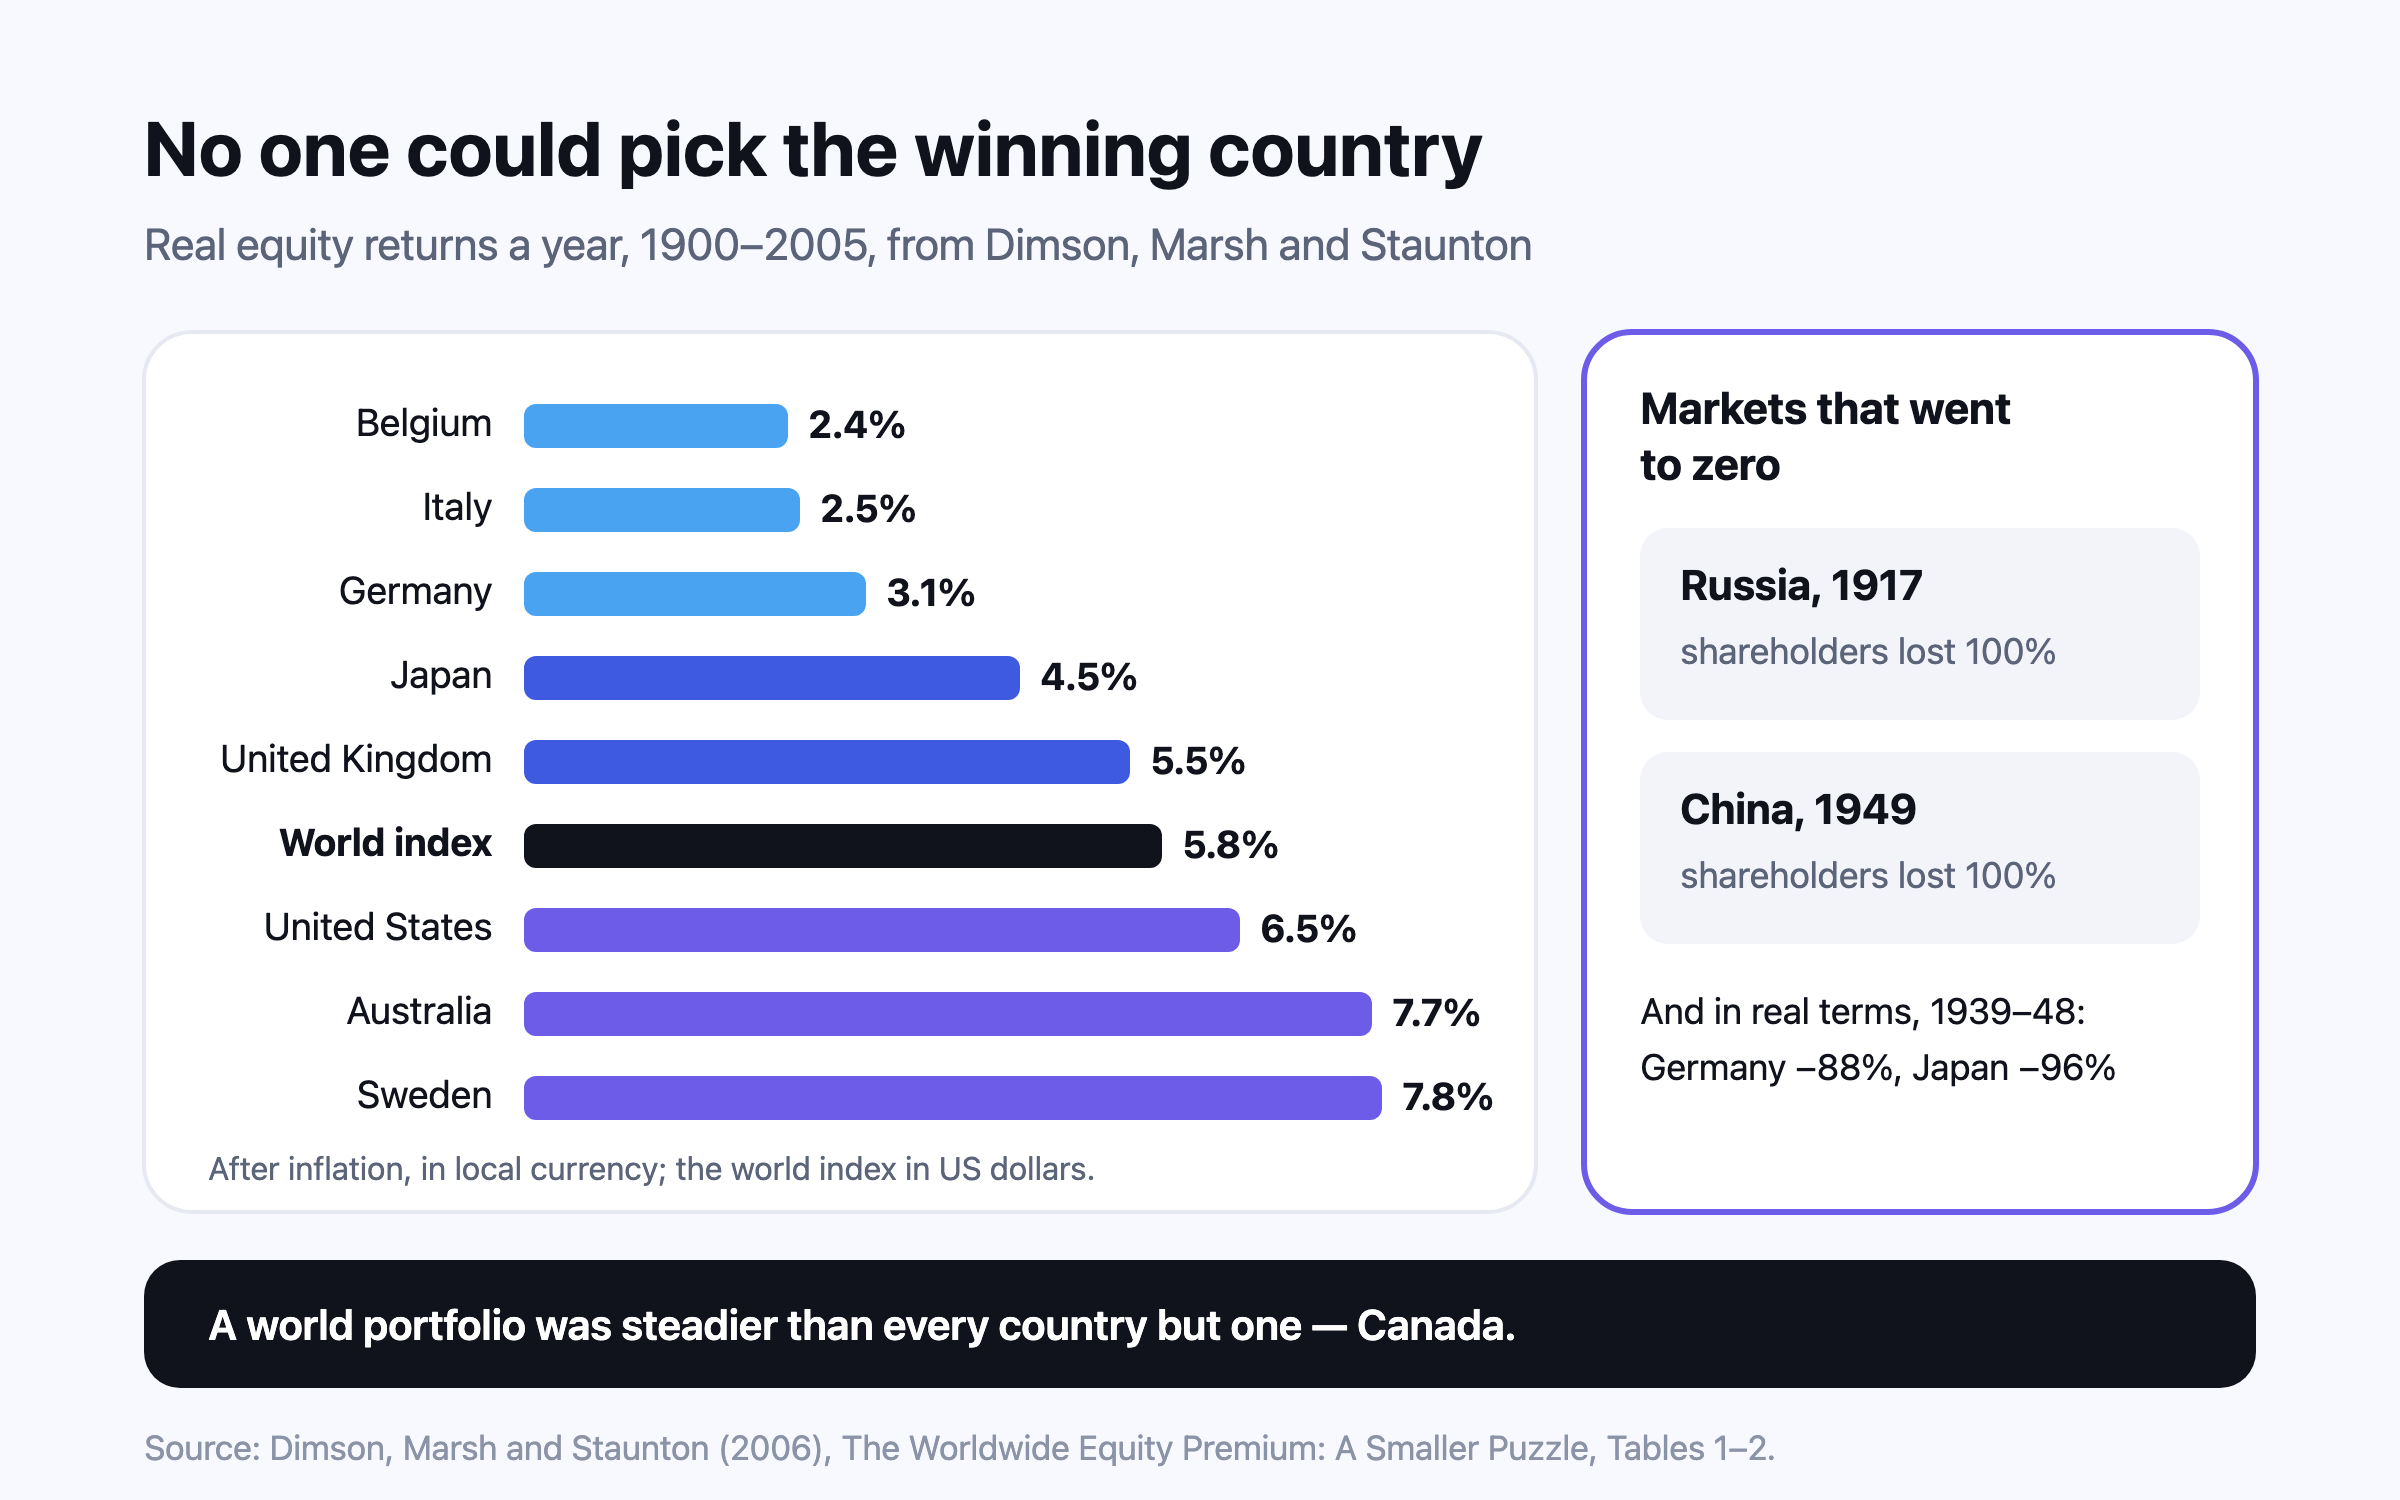
Across 126 years of the Dimson–Marsh–Staunton data, equities were the best asset in every market with a continuous history — yet over 1900–2005 real returns ranged from about 2.4% to 7.8% a year by country, Russian and Chinese investors lost everything, and German and Japanese shares fell over 85% in the 1940s. A world portfolio has been steadier than almost any single market. The US century was exceptional, and that is the reason not to assume it repeats.
Most arguments about investing abroad are made from the last ten or twenty years, which is too short to separate a pattern from a run of luck. The longest consistent record is the database built by Elroy Dimson, Paul Marsh and Mike Staunton of London Business School and Cambridge, published each year as the UBS Global Investment Returns Yearbook: stocks, bonds, bills, inflation and currencies in 35 markets, most of them from 19001. This article reads what that record says about spreading money across countries. The companion piece, home bias and currency risk, covers why investors over-own their home market and how to measure in the currency you will spend; this one is about the history.
126 years1
of returns in 35 markets, 1900–2025
21 of 211
markets with an unbroken history where equities were the best asset
62%1
of world equity market value is now in the US
100%2
lost by Russian and Chinese shareholders after 1917 and 1949
The headline record
Shares have rewarded patience almost everywhere. In every one of the 21 Yearbook markets with a continuous investment history, equities were the best-performing asset since 1900, and bonds beat cash everywhere except Portugal1. In the US, one dollar put into shares in 1900 had grown to $124,854 by the end of 2025, against $284 in long-term government bonds and $69 in Treasury bills, while prices rose 38-fold1. Dividing out that inflation, US shares returned roughly 6.6% a year in real terms over 126 years1.
The ride was rough. Since 1900, equities and bonds have each lost more than 70% in real terms on several occasions, whereas a 60:40 blend of the two never fell more than 50%1. In the US, recovering from the 1929 crash took until February 1945 — fifteen and a half years — and shares bought before the 1973–74 bear market were under water in real terms for more than ten years3.
The spread between countries
The average hides an enormous range. The table uses the authors’ own published figures for the 17 markets with complete records over 1900–2005, from a paper that sets out each country in detail; later Yearbooks extend the same series to 2025.
| Market | Real return a year, 1900–2005 | Worst 5 years in real terms | Longest run with a negative real return |
|---|---|---|---|
| Belgium | 2.4% | not shown | not shown |
| Italy | 2.5% | not shown | not shown |
| Germany | 3.1% | −93% (1944–48) | 55 years (1900–54) |
| France | 3.6% | −78% (1943–47) | 53 years (1900–52) |
| Japan | 4.5% | −98% (1943–47) | 51 years (1900–50) |
| United Kingdom | 5.5% | −63% (1970–74) | 22 years (1900–21) |
| World index (in US dollars) | 5.8% | −50% (1916–20) | 20 years (1901–20) |
| Canada | 6.2% | not shown | not shown |
| United States | 6.5% | −45% (1916–20) | 16 years (1905–20) |
| Australia | 7.7% | not shown | not shown |
| Sweden | 7.8% | not shown | not shown |
Two things stand out. First, an investor in 1900 had no way of knowing which column they were in: the countries at the bottom included some of the richest economies of the day. Second, the losses that matter most were not dips but decades. German shares lost 88% in real terms over 1939–48 and Japanese shares 96%, and investors in Germany, France and Japan waited more than half a century before their real returns turned positive from a 1900 start2.
Over the same 106 years, the world index returned 5.75% a year in real terms with a standard deviation of 17.2%, lower than every single market except Canada; the US returned 6.52% with 20.2%, and Germany 3.09% with 32.5%2. A spread of countries did not deliver the best market’s return, but it delivered most of the average return with a good deal less of the worst.
Markets that went to zero
Long-run studies are sometimes accused of looking only at survivors. The authors addressed it directly. Russia was the largest market missing from their early database, at just under 5% of world equity value in 1900, and China about 0.4%; shareholders in both lost everything when companies were nationalised after the revolutions of 1917 and 19492. Exchanges in Czechoslovakia, Hungary and Poland also ended in disaster after the Second World War2.
Their estimate is that the markets left out made up about 10% of world equity value in 1900, and that leaving them out overstates the long-run world equity premium by at most about a tenth of a percentage point a year2. For the world as a whole, the bias is small. For an investor whose whole portfolio sat in one of those markets, it was total. That asymmetry is the plainest argument for not holding everything in one country.
The US century, and the risk of extrapolating it
The US is the best-documented market and, today, by far the largest: about 62% of world equity value at the end of 2025, up from a far more evenly spread market in 1900, partly because of strong returns and partly because of heavy share issuance1. It was not the obvious choice then. In 1900 London was the world’s leading financial centre, and the British equity market was worth about 50% more than the New York Stock Exchange4. The US record is excellent but not the best: over 1900–2005, Sweden, Australia and South Africa all beat it in real terms2.
The more recent evidence cuts both ways. Over the 50 years to 2024, investing globally rather than at home gave a better return for the risk taken in the vast majority of countries — with one prominent exception, the US, whose investors would have done better staying at home. The authors call this a cautionary tale: good decisions, made on sensible grounds, can still have disappointing outcomes3.
Two cautions follow. The market that looks safest is the one that has done best, which is exactly how the largest markets of 1900 looked. And concentration is now unusually high: by the end of 2025, US equity market concentration was at its highest level for at least 100 years1. Industries change too — railways were 63% of the US market in 1900 and are now under 1%, and some 80% of the value of US firms listed in 1900 was in industries that are small or extinct today1.
Emerging markets and India
Emerging markets are often sold as the higher-return option. Over the full period the record says the opposite: developed markets returned 8.5% a year from 1900 to 2025 against 6.9% for emerging markets. From 1960 the order reversed, at 10.9% a year for emerging markets against 9.6% for developed ones1. These are composite indexes; for an investor who spends in another currency, the exchange rate is also part of the result.
India illustrates both halves. It had a stock market in 1900, but in 1913 it belonged to a group of small markets — with Egypt, Finland, Greece, Hong Kong, New Zealand and Sri Lanka — that together made up less than 1% of world equity value, and a reliable return series from that era was not then available2. It is now one of the 32 markets in the Yearbook’s world index1. The lesson for an Indian investor is not that India will repeat the US century or will not; it is that India today is a large economy but a small share of the world’s listed companies, and the same history that rewarded patience punished concentration.
Correlation and currency
Diversification works only when things do not all fall together. Over the very long run, the correlation between shares and bonds has averaged 0.33 across countries and 0.19 in the US; it was mostly negative from the late 1990s until 2021, a valuable cushion, and that era ended in 2022 when both fell sharply together3. Correlations between developed and emerging markets, and between shares and bonds, have risen recently, which makes diversification harder but has not removed its benefit1.
Between countries, the same trend shows up. Vanguard measured the ten-year correlation between US and non-US shares rising from 0.51 at the end of 1989 to 0.86 by September 2020, before levelling off5. A high correlation still leaves room for long stretches in which one region leads: non-US shares led in the mid-1980s and for most of the 2000s, and US shares for most of the 2010s5. A diversified investor owns whichever region is leading, without having to know in advance which one it will be.
The authors add that, since 1900, most large peacetime falls in shares were set off by economic causes rather than geopolitical ones6 — which is why spreading across economies, not only across headlines, is what reduces the damage.
Currency is the second layer. On average, exchange-rate movements added around 6 percentage points to the volatility a US-dollar investor experienced in a foreign market, whether in shares or bonds1. When that currency risk was hedged, investors in the vast majority of markets were better off investing globally than domestically over 1974–20251. How much exchange-rate risk to carry depends on where you will spend — the subject of the home bias article.
What a global investor gets — and does not
- Gets: protection from the one outcome that history shows is unrecoverable — a single market collapsing for decades or for good.
- Gets: a smoother path. The world index was steadier than all but one of the 17 national markets over 1900–20052.
- Does not get: the best market’s return. A spread portfolio will always trail whichever country turns out to win.
- Does not get: protection in a global crash. In 1929–31 the world index fell 54% in real terms and in 2000–02 it fell 44%2; only bonds and cash cushioned those years.
- Takes on: currency movements, which can help or hurt and are worth matching to where the money will be spent.
None of this sets a right share abroad for any household; that depends on costs, taxes, the currency you will spend in and how soon you need the money. It is information about the historical record, not financial advice. For how the mix between shares and safer assets usually shifts as a horizon shortens, see asset allocation by age.
Questions people ask
Is global diversification worth it?
Historically, yes for most investors. Over 1974–2025, investors in the vast majority of the 32 markets in the world index were better off investing globally once currency risk was hedged1. The US was the notable exception over the last 50 years3.
What are long-term stock market returns by country?
From 1900 to 2005, real equity returns ranged from about 2.4% a year in Belgium to 7.8% in Sweden, with the US at 6.5% and the world index at 5.8%2. Over 1900–2025, US shares returned roughly 6.6% a year after inflation1.
Have any stock markets been wiped out?
Yes. Russian shareholders lost everything after 1917 and Chinese shareholders after 1949, and exchanges in Czechoslovakia, Hungary and Poland ended in disaster after the Second World War2. German and Japanese shares fell 88% and 96% in real terms over 1939–482.
Will US stocks keep outperforming?
Nobody knows. The US now holds about 62% of world equity value and its concentration is the highest in at least 100 years1. The largest markets of 1900 did not all stay on top, which is the case against assuming any one market will.
Do emerging markets return more than developed markets?
Not over the full record: 6.9% a year for emerging markets against 8.5% for developed markets from 1900 to 2025, in US dollars. From 1960 to 2025 emerging markets led, at 10.9% against 9.6%1.
Sources
- UBS Global Investment Returns Yearbook 2026: public summary edition — Elroy Dimson, Paul Marsh and Mike Staunton, UBS, 2026-03.
- The Worldwide Equity Premium: A Smaller Puzzle (Tables 1 and 2; section on survivorship of markets) — Elroy Dimson, Paul Marsh and Mike Staunton, London Business School (SSRN 891620), 2006-04.
- UBS Global Investment Returns Yearbook 2025: public summary edition — Elroy Dimson, Paul Marsh and Mike Staunton, UBS, 2025-03.
- Triumph of the Optimists: 101 Years of Global Investment Returns, chapter 4 (International capital market history) — Elroy Dimson, Paul Marsh and Mike Staunton, Princeton University Press, 2002.
- Global equity investing: The benefits of diversification and sizing your allocation — Vanguard Research, 2021-04.
- Global Investment Returns Yearbook 2026: Timeless lessons for today’s investment challenges (news release) — UBS, 2026-03.
This is general information, not financial, tax or legal advice for your circumstances. Rules and figures change; check the official source for your country, and consult a licensed professional before making financial decisions. Projections are estimates, not predictions.