Most of a career’s pay growth comes before 40. Planning on steady raises to the end is the assumption most likely to flatter a plan.
Pay rises fastest in the first decade of work, flattens through the 40s and often falls in the 50s: in the US, median weekly earnings peak at 35–44, and for 80% of men earnings fall between 45 and 55. Job switchers out-earn stayers, a gender gap opens after 30, and only the part of a raise above inflation adds buying power. Plan on modest real growth, and treat the rest as upside.
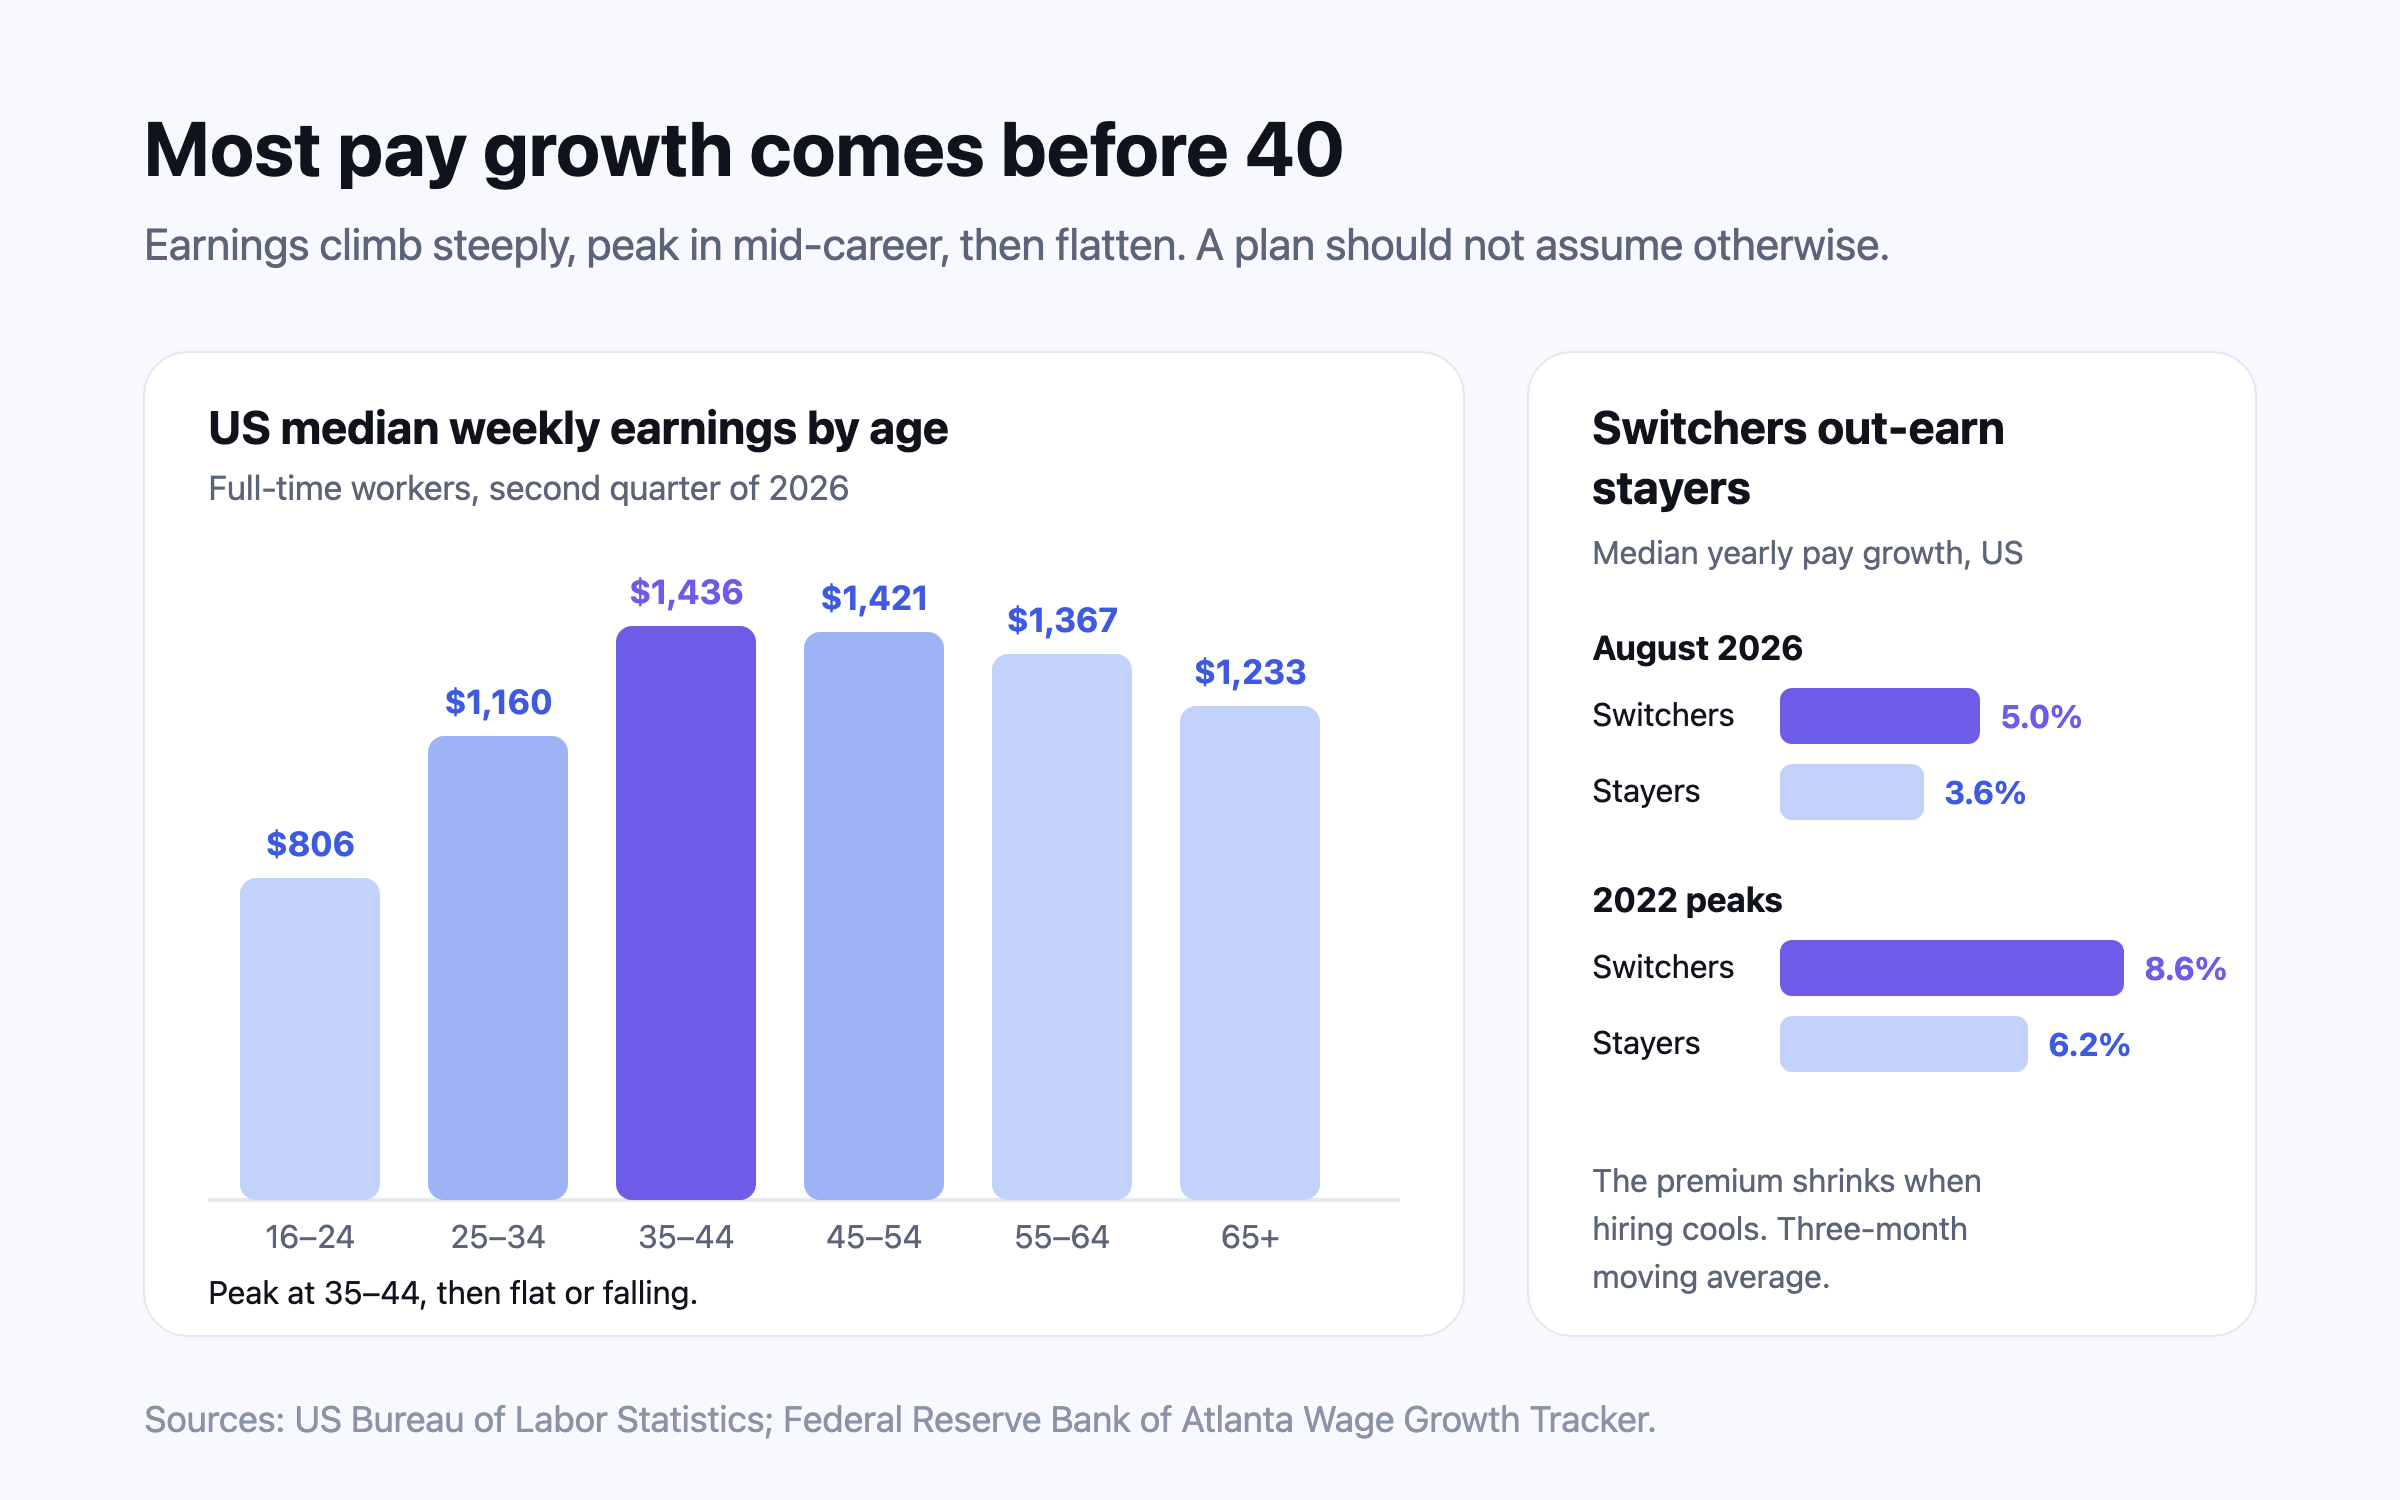
The short answer: income does not rise in a straight line. In the US, median weekly earnings for full-time workers run from $806 for 16- to 24-year-olds to a peak of $1,436 at 35 to 44, then ease to $1,367 by 55 to 64.1 Most of a typical career’s growth happens in its first fifteen years. A plan that assumes the same raise every year until the day work stops is assuming something most careers do not deliver — and that is the assumption this article is about.
$1,4361
US median weekly earnings at 35–44, the peak age band (Q2 2026)
+60%2
Real earnings growth from 25 to 55 for a US man in the middle of the lifetime-earnings range
5.0% vs 3.6%3
Annual pay growth of US job switchers against stayers, August 2026
0.9% → 9.1%4
UK full-time gender pay gap at 22–29 against 40–49, April 2025
The shape of a career: steep, then flat
Economists call it the age–earnings profile, and its shape is remarkably consistent: a steep climb in the twenties and early thirties, a plateau through the forties, and a gentle decline as people approach the end of full-time work. The US Bureau of Labor Statistics publishes the clearest current snapshot every quarter.
| Age | All full-time workers | Men | Women |
|---|---|---|---|
| 16–24 | $806 | $839 | $764 |
| 25–34 | $1,160 | $1,228 | $1,095 |
| 35–44 | $1,436 | $1,596 | $1,249 |
| 45–54 | $1,421 | $1,571 | $1,231 |
| 55–64 | $1,367 | $1,482 | $1,176 |
| 65 and over | $1,233 | $1,415 | $1,035 |
| All ages, 16 and over | $1,251 | $1,380 | $1,131 |
Read the table with care: it compares different people at one moment, not one person over time, and today’s 55-year-olds started work in a different economy. The study that follows people instead tells the same story more sharply. Fatih Guvenen and colleagues tracked millions of American men through US Social Security records. For a man in the middle of the lifetime-earnings distribution, earnings after inflation rose by about 60% between 25 and 55; at the 95th percentile they rose 4.8-fold, and for the top 1% 27.8-fold.2 And for 80% of men, earnings fell between 45 and 55.2
Two lessons follow. The average hides an enormous spread — the people whose pay keeps multiplying are a small minority, and their careers pull up every average quoted for “people your age”. And for most people the growth is front-loaded: by the mid-forties, the steep part is usually over.
Where the raises come from, by age
The Federal Reserve Bank of Atlanta’s Wage Growth Tracker follows the same individuals a year apart and reports the median change in their pay. It shows growth slowing with age at every point in the cycle. In the year to August 2026, on a twelve-month moving average, median pay growth was 6.6% for 16- to 24-year-olds, 4.0% for 25- to 54-year-olds and 2.9% for those 55 and over.3 Since 1997 the youngest group has averaged roughly 7% a year and the oldest under 3%.3
The pattern is not only American, but its steepness varies by country. Comparing harmonised surveys from countries at every income level, David Lagakos, Benjamin Moll and colleagues found that wages rise with experience about twice as steeply in rich countries as in poor ones, and more steeply for the more educated — which accounts for around a third of the difference between countries.5 A career in a fast-growing economy can still see large nominal raises, but much of that reflects inflation and the economy as a whole rather than the individual’s climb.
Switching jobs: the raise that comes with a move
The tracker also separates people who changed employer from those who stayed. Switchers have out-earned stayers for most of the series. In the three months to August 2026 the median switcher’s pay was up 5.0% on a year earlier, against 3.6% for stayers.3 The gap widens when employers compete for staff: at the 2022 peak, switchers’ pay growth reached 8.6% while stayers’ peaked at 6.2%.3
The switching premium is real but it has costs that pay figures do not show. A move can reset an employer’s pension matching or vesting, restart a service-based benefit such as an end-of-service gratuity, and cost the security of a known role in a downturn — and the premium shrinks just when jobs are hardest to find. For those working in the Gulf, gratuity and pensions when you move covers what a change of employer or country does to those benefits.
The gap that opens after 30
In the UK, the gender pay gap for full-time employees was 6.9% in April 2025, and 12.8% across all employees.4 But the headline hides a pattern by age. Among full-time employees the gap was 0.9% at 22 to 29 and 3.9% at 30 to 39, then 9.1% at 40 to 49, 12.5% at 50 to 59 and 12.6% at 60 and over.4 The same divergence is visible in the US table above: between 25–34 and 35–44, men’s median weekly earnings rise by $368 and women’s by $154.1
Research points to children as the main driver. Using Danish administrative data, Henrik Kleven, Camille Landais and Jakob Egholt Søgaard found that the arrival of children opens a long-run gap in earnings between mothers and fathers of around 20%, through fewer hours, lower participation and lower wage rates.6 For a couple’s plan the practical point is simple: two incomes rarely grow in parallel, and a career break or a move to part-time work changes the trajectory for years, not months. See what your partner needs to know and FIRE planning for couples.
Nominal raises and real raises
A raise only adds buying power to the extent it beats inflation. In the UK, median weekly earnings for full-time employees rose 5.3% in the year to April 2025 — but only 1.1% after inflation.7 Long-run planning has to make the same split: a nominal growth rate is made of inflation, economy-wide productivity growth and an individual’s own progression, and only the last two raise living standards.
Nivritee’s default income-growth rate for each market is built exactly that way — the country’s inflation default plus a margin for real growth and career progression — and every one can be changed.8
| Market | General inflation default | Income growth default | Margin above inflation |
|---|---|---|---|
| India | 4.0% | 7.0% | 3.0 points |
| United States | 2.0% | 4.0% | 2.0 points |
| Malaysia | 2.5% | 4.0% | 1.5 points |
| Canada | 2.0% | 3.5% | 1.5 points |
| New Zealand | 2.0% | 3.5% | 1.5 points |
| Singapore | 2.0% | 3.5% | 1.5 points |
| United Kingdom | 2.0% | 3.5% | 1.5 points |
| Australia | 2.5% | 3.5% | 1.0 points |
| Hong Kong | 2.5% | 3.5% | 1.0 points |
| Europe (euro area) | 2.0% | 3.0% | 1.0 points |
| Japan | 2.0% | 2.5% | 0.5 points |
Small differences compound. At India’s default of 7.0%, a salary grows to about 5.43 times today’s figure over 25 years; with 4.0% inflation, that is about 2.04 times in today’s money.8 Assume 5.0% instead and the salary reaches about 3.39 times — so the higher assumption puts the final year’s pay about 60% higher, and every year of saving between now and then rests on it.8
How to plan for raises without over-assuming them
- Assume modest real growth, not your best year. A rate a point or two above inflation describes most careers over the long run; a promotion is upside, not a baseline.
- Expect growth to slow. The evidence says the steep part of a career usually ends in the forties. If your plan depends on raises continuing until the last working year, test it without them.
- Model each partner separately. Two careers rarely move together, and a break for children or care changes one trajectory for years.
- Save from raises before you spend them. Committing part of each future raise to saving is the most reliable way to turn growth into independence — see how to save more.
- Check the plan at a lower rate. If one point less growth turns a comfortable plan into a short one, the plan is resting on hope.
How Nivritee handles income growth
Questions people ask
At what age do people earn the most?
In the US, median weekly earnings for full-time workers peak at 35 to 44, at $1,436 in the second quarter of 2026, and are only slightly lower at 45 to 54.1 For most people the steep growth is over by the mid-forties.
Do you earn more by switching jobs?
On average, yes. In the three months to August 2026, US job switchers’ median pay was up 5.0% on a year earlier against 3.6% for stayers.3 A move can also reset pension matching or service-based benefits, so weigh the whole package.
What income growth rate should I assume in a FIRE calculator?
A rate a point or two above your country’s inflation is a reasonable long-run starting point; Nivritee’s defaults range from 0.5 points above inflation in Japan to 3.0 points in India.8 Then check how the plan looks at a lower rate.
What is the difference between nominal and real wage growth?
Nominal growth is the raise on your payslip; real growth is what is left after inflation. In the UK, full-time median weekly earnings rose 5.3% in the year to April 2025 but 1.1% in real terms.7
Sources
- Usual Weekly Earnings of Wage and Salary Workers, Second Quarter 2026 — Table 3, by age, race, Hispanic or Latino ethnicity and sex — US Bureau of Labor Statistics, 2026-07.
- What Do Data on Millions of U.S. Workers Reveal About Lifecycle Earnings Dynamics? (Econometrica 89:5) — Fatih Guvenen, Fatih Karahan, Serdar Ozkan and Jae Song, Federal Reserve Bank of New York Staff Report 710, 2021.
- Wage Growth Tracker — Federal Reserve Bank of Atlanta, 2026-08.
- Gender pay gap in the UK: 2025 — Office for National Statistics, 2025-10.
- Life Cycle Wage Growth across Countries (Journal of Political Economy 126:2) — David Lagakos, Benjamin Moll, Tommaso Porzio, Nancy Qian and Todd Schoellman, University of Chicago Press, 2018-04.
- Children and Gender Inequality: Evidence from Denmark (American Economic Journal: Applied Economics 11:4) — Henrik Kleven, Camille Landais and Jakob Egholt Søgaard, American Economic Association, 2019.
- Employee earnings in the UK: 2025 — Office for National Statistics, 2025-10.
- Should I change the six assumptions? (Nivritee’s default rates by country, with their basis) — Nivritee Help Centre, 2026-10.
This is general information, not financial, tax or legal advice for your circumstances. Rules and figures change; check the official source for your country, and consult a licensed professional before making financial decisions. Projections are estimates, not predictions.