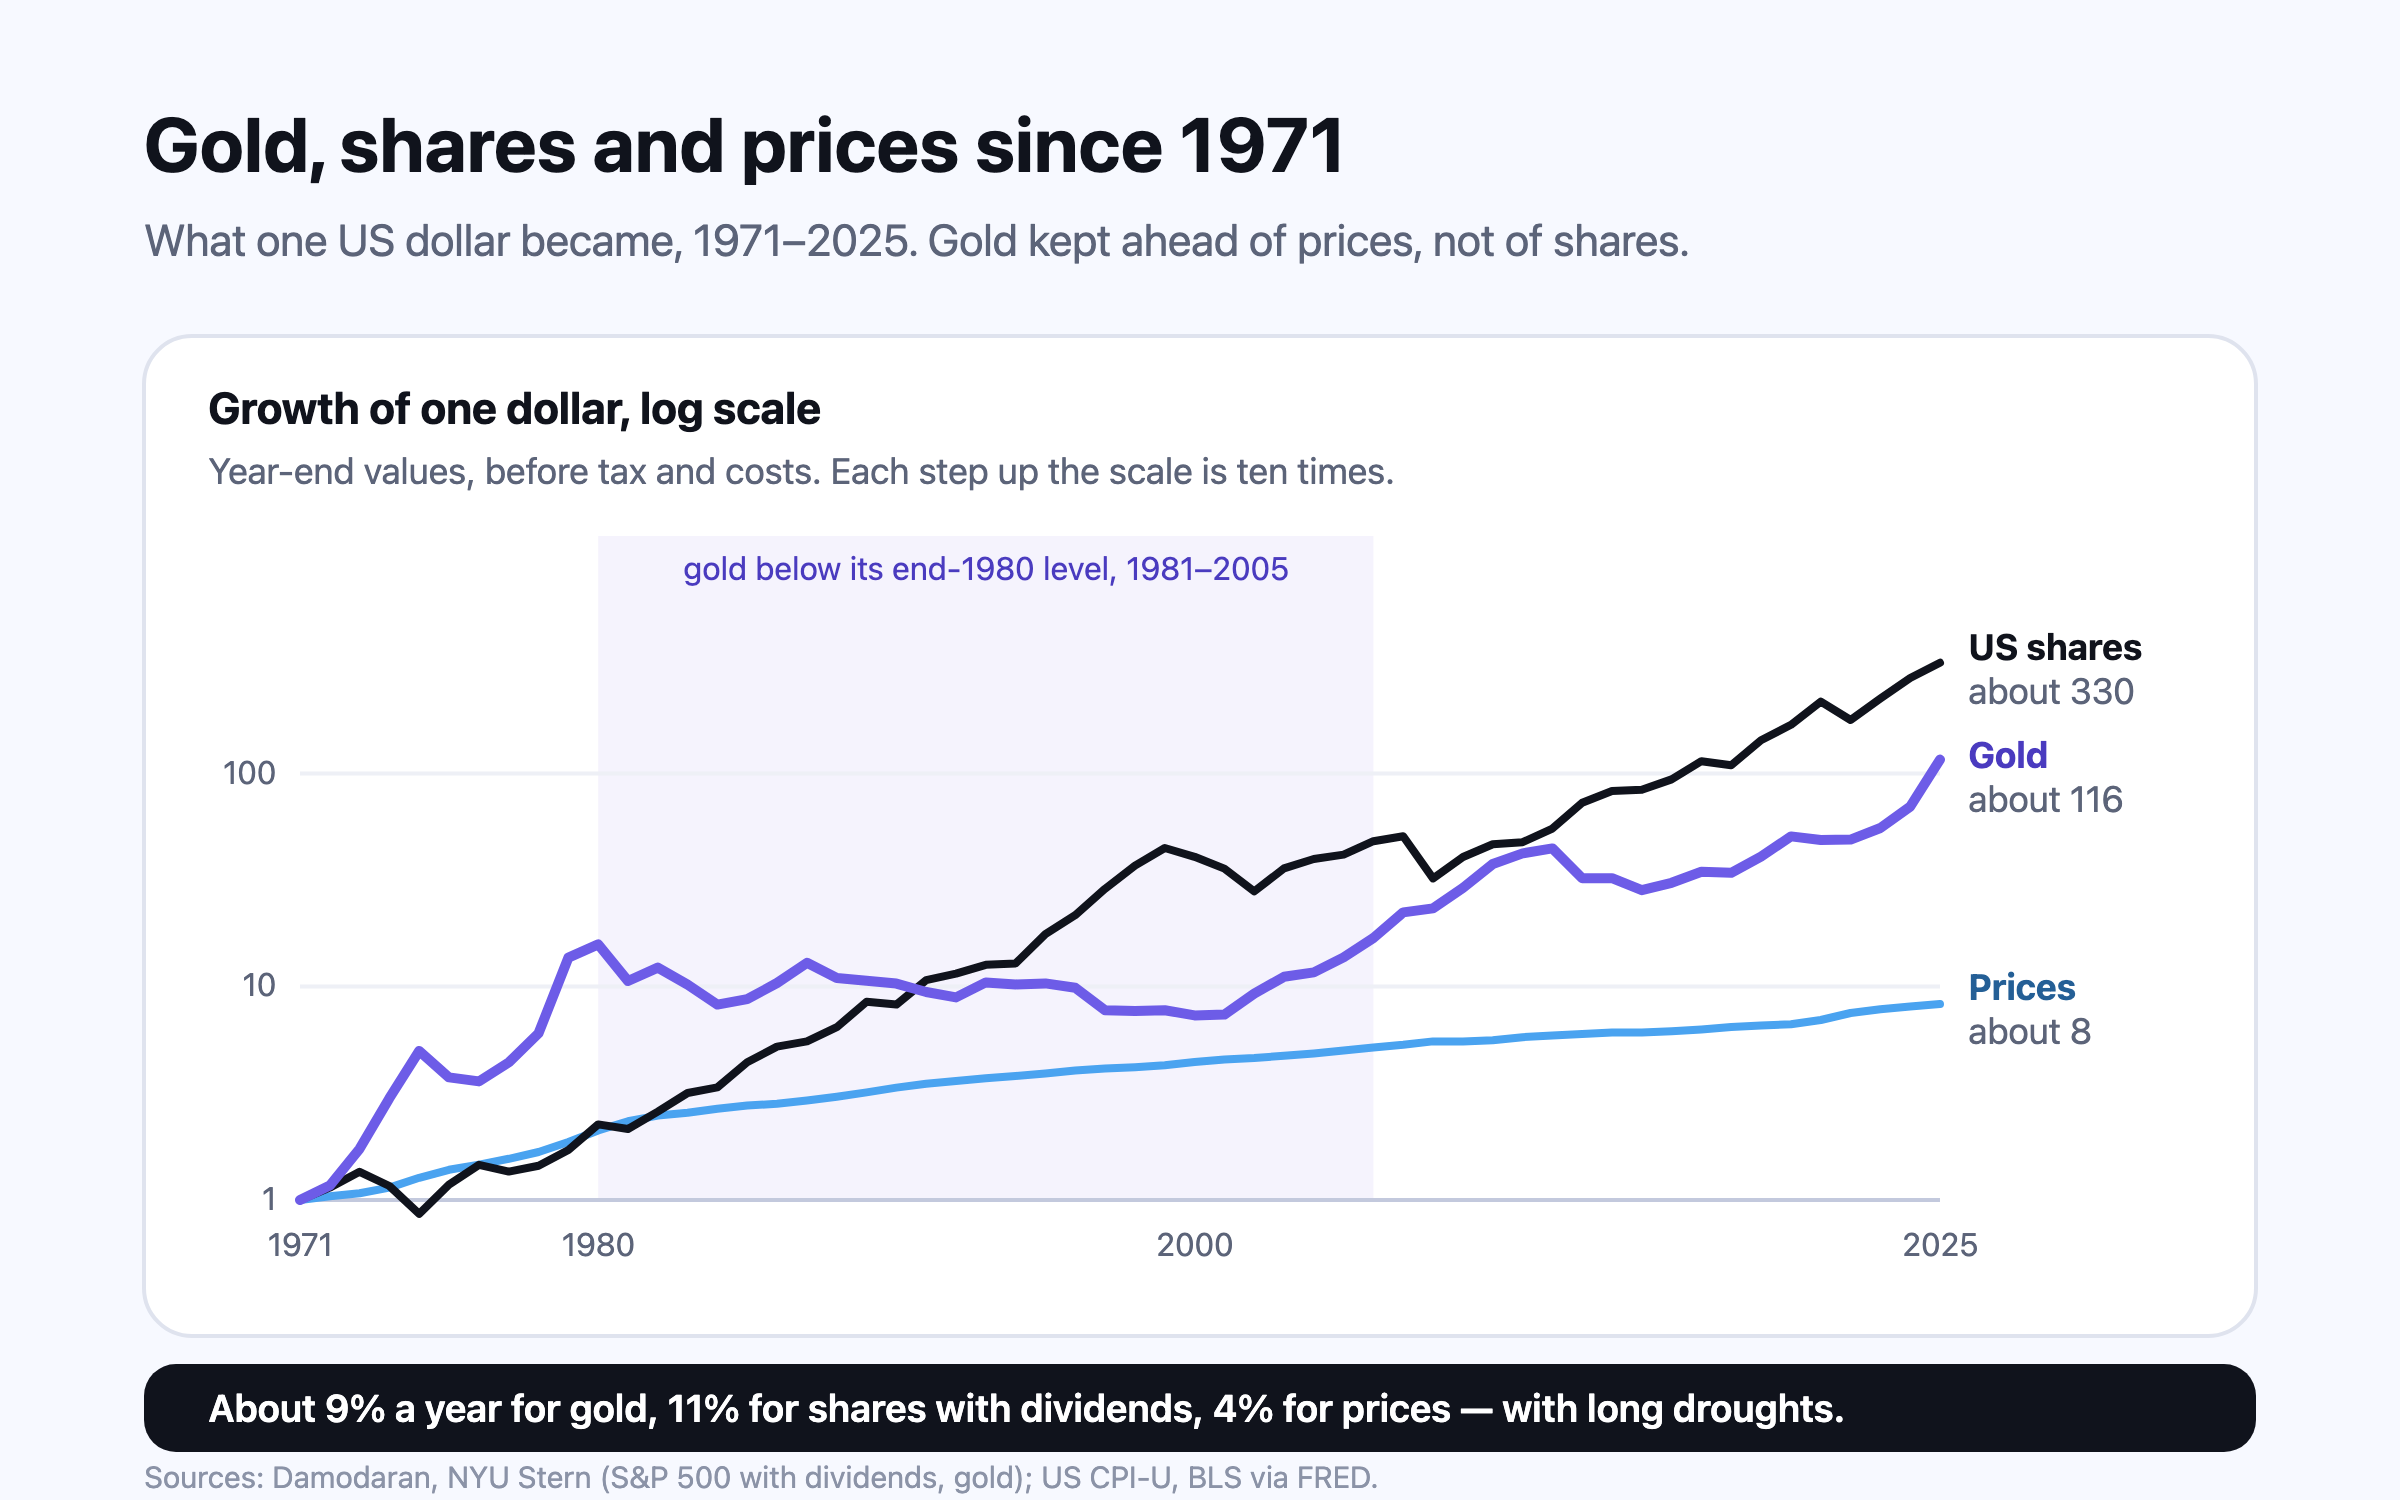
Since 1971 gold has beaten inflation but trailed shares — and spent two decades losing money in between.
From 1971 to 2025 gold returned about 9.0% a year in dollars against 11.1% for US shares with dividends and 3.9% inflation. The average hides two long droughts: gold fell about 70% from its 1980 peak to its 1999 low and took until 2025 to pass that peak after inflation. For Indian households a weaker rupee softened the slump, and gold’s real case is as a diversifier that has often risen when shares fell, not as a growth engine.
On 15 August 1971 President Nixon closed the “gold window”, ending the dollar’s convertibility into gold at the official $35 an ounce that had anchored the Bretton Woods system1. From then on gold had a market price, and half a century of that price is now long enough to answer the question families ask most often about it: is gold a good long-term investment? The data says it has been a reasonable store of value, a weaker builder of wealth than shares, and an unusually good companion to shares in a crisis — with very long stretches when it lost money.
Gold, shares and inflation since 1971
9.0% a year2
Gold in US dollars, 1971–2025, year-end prices
11.1% a year2
US shares (S&P 500) with dividends reinvested, 1971–2025
3.9% a year3
US consumer prices, 1970–2025 annual averages
$3,4314
Gold’s average price per ounce in 2025, up from $35 in 1971
| 1971–2025, in US dollars | A year | One dollar became |
|---|---|---|
| US shares, S&P 500 with dividends | 11.1% | about 330 |
| Gold | 9.0% | about 116 |
| 10-year US Treasury bonds | 6.0% | about 24 |
| US consumer prices | 3.9% | about 8.3 |
After inflation, that is roughly 4.9% a year for gold and 6.9% for shares23. The World Gold Council, which promotes gold, reaches a similar headline on its own data: about 8% a year in dollars since 1971, comparable with shares and ahead of bonds and inflation5. Its figure was published before 2025, a year in which gold rose 66%2 and set 53 record highs4 — a reminder that a long-run average for gold depends heavily on where the window ends.
The average hides two droughts
| Period (year-end to year-end) | Gold, a year | US shares with dividends, a year |
|---|---|---|
| 1971–1979: the inflation decade | 33.7% | 6.2% |
| 1981–2000: the long slump | −3.8% | 15.5% |
| 2001–2025: the long recovery | 11.7% | 8.7% |
| 2013–2019: a second flat stretch | −1.3% | 14.6% |
Gold reached $850 an ounce on 21 January 1980 and fell to $252.80 on 20 July 1999 — a fall of about 70% over nineteen years, before counting inflation6. On year-end prices it did not close a year above its end-1980 level until 20062. In real terms the wait was far longer: by Barron’s calculation, the 1980 peak was worth about $3,499 in 2025 money, and gold only passed it in September 2025, around $3,6567. Somebody who bought at the top waited roughly 45 years to be level after inflation.
Claude Erb and Campbell Harvey’s study “The Golden Dilemma” explains why such droughts follow booms. They found gold to be a reliable inflation hedge only over very long horizons — they suggest centuries — and an unreliable one over the years and decades that matter to a household. They also found the real price of gold tends to revert towards its long-run average, so periods of unusually high real prices have tended to be followed by below-average returns8. Their paper, written soon after the 2011 high, was followed by exactly that: gold fell 28% in 2013 and was below its end-2012 level until 20202.
In rupees, a weaker currency changed the story
An Indian household experienced the same decades very differently, because the rupee fell against the dollar. In the Reserve Bank of India’s series, gold in Mumbai averaged ₹1,522 per 10 grams in 1980-81 and ₹4,394 in 1999-2000 — nearly three times as much — even though the London dollar price fell by about half over the same years, from $585 to $280 an ounce9. By 2020-21 the Mumbai price was ₹48,723, about 32 times its 1980-81 level, or roughly 9.1% a year over 40 years9.
That rupee cushion is real, but it is a currency effect rather than a property of gold: it is what any dollar asset did for a rupee saver while the rupee weakened. Indian shares have their own record. NSE reports that the Nifty 50 Total Return Index has compounded at 12.12% a year since its base date in November 1995, to the end of September 2026 — including a fall of 12.61% so far in 202610. The windows differ, so these are not a like-for-like contest; over the twenty years from 2000-01 to 2020-21, the RBI’s gold series rose about 12.7% a year9. Start and end dates decide most comparisons between gold and shares.
Gold in Indian households
Up to 25,000 t11
Gold estimated to be held by Indian households
430.5 t12
Indian jewellery demand in 2025, down 24%
280.4 t13
Indian bar and coin demand in 2025, the highest since 2013
3%14
GST on jewellery, on the whole value including making charges
The World Gold Council estimates Indian households hold up to 25,000 tonnes of gold, much of it as jewellery passed through generations11. Habits are shifting: in 2025 Indian jewellery demand fell 24% to 430.5 tonnes while bar and coin demand rose 17% to 280.4 tonnes1213, and Indian gold ETFs took in a net 38 tonnes13.
Jewellery, coins, ETFs and Sovereign Gold Bonds compared
- Jewellery. You pay the metal, a making charge set by the jeweller and not regulated, and GST of 3% on the whole value — the making charge included, whether or not it is shown separately14. Selling usually recovers the metal value only, so the making charge and the tax are a cost, not an investment. Its real value to a family is often not financial at all.
- Coins and bars. Closer to the metal price, with the same 3% GST on purchase14, plus storage and the purity question at sale.
- Gold ETFs and gold funds. Listed units backed by gold, bought and sold at market prices, with a yearly expense ratio deducted inside the price and no making charge or storage problem. For what a yearly charge costs over decades, see what fees cost over 30 years.
- Sovereign Gold Bonds. Issued by the RBI for the Government of India: they track the gold price, pay 2.50% a year on the amount first invested, run eight years with early exit allowed after the fifth, and capital gains on redemption are exempt for individuals15. No new tranche has been issued since February 2024, and the government has said it will not continue the scheme, rising gold prices having made redemptions costly for it; existing bonds trade on the NSE and BSE16.
Gold’s real job: a diversifier
The strongest argument for holding some gold is not its average return but its timing. The World Gold Council’s analysis finds gold’s negative relationship with shares strengthens as shares sell off: gold rose 21% in dollars from December 2007 to February 2009, and its return stayed positive through the share-market falls of 2020 and 202217. In the yearly data, US shares fell 36.55% in 2008 while gold rose 4.32%, and in 1974 shares fell 25.90% while gold rose 66.15%2.
It is not a reliable hedge in every crisis — in 2000 shares and gold both fell2 — and it produces no income, so its long-run return depends entirely on somebody paying more later. The balanced reading is that a modest allocation can soften the worst years of a share portfolio, while a large one exposes a household to gold’s own multi-decade droughts. Whether and how much to hold is a household decision; this is information, not financial, tax or legal advice. For the wider case for spreading money across markets, see home bias and currency risk.
Where gold sits in your plan
One honest limit: the FIRE Planner grows your whole corpus at the return in your assumptions, not at a separate rate for gold. If a large share of your savings is gold, choosing that return with gold’s history in mind is part of setting up the plan (build your plan).
Questions people ask
What has gold returned over the last 50 years?
From 1971 to 2025 gold returned about 9.0% a year in US dollars on year-end prices, against 11.1% for US shares with dividends and 3.9% inflation23. The World Gold Council’s own estimate is about 8% a year since 19715.
Is gold a good hedge against inflation?
Over half a century it has beaten inflation, but not reliably over shorter spans: Erb and Harvey found it a dependable hedge only over very long horizons8. Gold fell about 70% from January 1980 to July 1999 while prices kept rising6.
Has gold beaten the Sensex or Nifty?
It depends on the dates chosen. The Nifty 50 Total Return Index has compounded at 12.12% a year since November 199510, while RBI data show gold in Mumbai rising about 12.7% a year from 2000-01 to 2020-219. Over most long windows shares have grown wealth faster, with gold strongest when shares were weakest.
Are Sovereign Gold Bonds still available?
No new tranches have been issued since February 2024, and the government has said it will not continue the scheme; existing bonds can be bought and sold on the NSE and BSE16. They pay 2.50% a year on the initial investment and run eight years15.
Is buying gold jewellery a good investment?
As an investment it starts behind: GST of 3% applies to the whole value, making charges included14, and a sale usually recovers only the metal value. Gold ETFs and bonds track the price without making charges, though ETFs carry a yearly fee.
Sources
- Nixon Ends Convertibility of US Dollars to Gold and Announces Wage/Price Controls — Federal Reserve History, 1971-08.
- Historical Returns on Stocks, Bonds, Bills, Real Estate and Gold: 1928–2025 — Aswath Damodaran, NYU Stern School of Business, 2026-01.
- Consumer Price Index for All Urban Consumers: All Items (CPIAUCSL), annual averages — U.S. Bureau of Labor Statistics, via FRED, Federal Reserve Bank of St. Louis, 2026-01.
- Gold Demand Trends: Full Year 2025 — World Gold Council, 2026-01.
- Gold as a strategic asset, 2025 edition: Return — World Gold Council, 2025-01.
- The London Gold Fix (The Alchemist, issue 17) — London Bullion Market Association, 2000.
- Gold Tops Inflation-Adjusted Peak of 1980s as Stagflation Risks Mount (Barron’s, republished) — International Precious Metals Institute / Barron’s, 2025-09.
- The Golden Dilemma (NBER Working Paper 18706) — Claude B. Erb and Campbell R. Harvey / National Bureau of Economic Research, 2013-01.
- Handbook of Statistics on the Indian Economy, Table 39: Average Price of Gold and Silver in Domestic and Foreign Markets — Reserve Bank of India, 2021-09.
- Nifty 50 index factsheet — NSE Indices Limited, 2026-09.
- Gold investment market and financialisation (India gold market series) — World Gold Council, 2023-07.
- Gold Demand Trends: Full Year 2025 — Jewellery — World Gold Council, 2026-01.
- Gold Demand Trends: Full Year 2025 — Investment — World Gold Council, 2026-01.
- GST: Sectoral series — Gems & Jewellery (FAQ) — Central Board of Indirect Taxes and Customs / GST Council, 2017.
- Sovereign Gold Bond Scheme — Frequently Asked Questions — Reserve Bank of India, 2024.
- Sovereign Gold Bond 2017–18 Series VII matures; can you still buy these govt gold bonds? — Business Today, 2025-11.
- Gold as a strategic asset, 2025 edition: Diversification — World Gold Council, 2025-01.
- How do I enter gold and jewellery? — Nivritee Help Centre, 2026-10.
- Why does a rung say my money is in the wrong place? — Nivritee Help Centre, 2026-10.
This is general information, not financial, tax or legal advice for your circumstances. Rules and figures change; check the official source for your country, and consult a licensed professional before making financial decisions. Projections are estimates, not predictions.