A return only means something once inflation has been taken out of it — and most of the numbers you are shown leave it in.
A nominal return counts money; a real return counts what the money buys. Over 126 years US shares returned about 9.8% a year before inflation and 6.6% after it, and a deposit paying 6.25% against 4% inflation earns about 2.2% in real terms before tax. Planning in real terms changes how big a future number really is.
Nivritee Research · 25 September 2026 · updated 15 October 2026 · 5 min read
Every return you are quoted — on a fixed deposit, a fund factsheet, a pension statement — is almost always nominal: it counts how many more units of money there will be. What you care about is the real return: how much more that money can buy. The gap between the two is inflation, and over the length of a working life it is the difference between a figure that sounds comfortable and one that is.
The economist Irving Fisher set out the relationship most fully in The Theory of Interest in 1930, and it has not needed changing since4. Growth in what your money buys equals growth in the money divided by growth in prices: (1 + real) = (1 + nominal) ÷ (1 + inflation). A deposit paying 7% a year while prices rise 5% leaves you about 1.9% better off in what you can buy, not 2%: 1.07 ÷ 1.05 is 1.019. Subtracting inflation from the return is a fair shortcut when both are small, and it gets worse as they grow.
Two consequences follow straight away. A return below inflation is a loss, however positive the statement looks. And the same nominal return can be a good result in one country and a poor one in another, because the inflation it has to beat differs: central banks in the US, the euro area, the UK and Japan aim at 2%, while India’s target is 4%3,5,6,7,2.
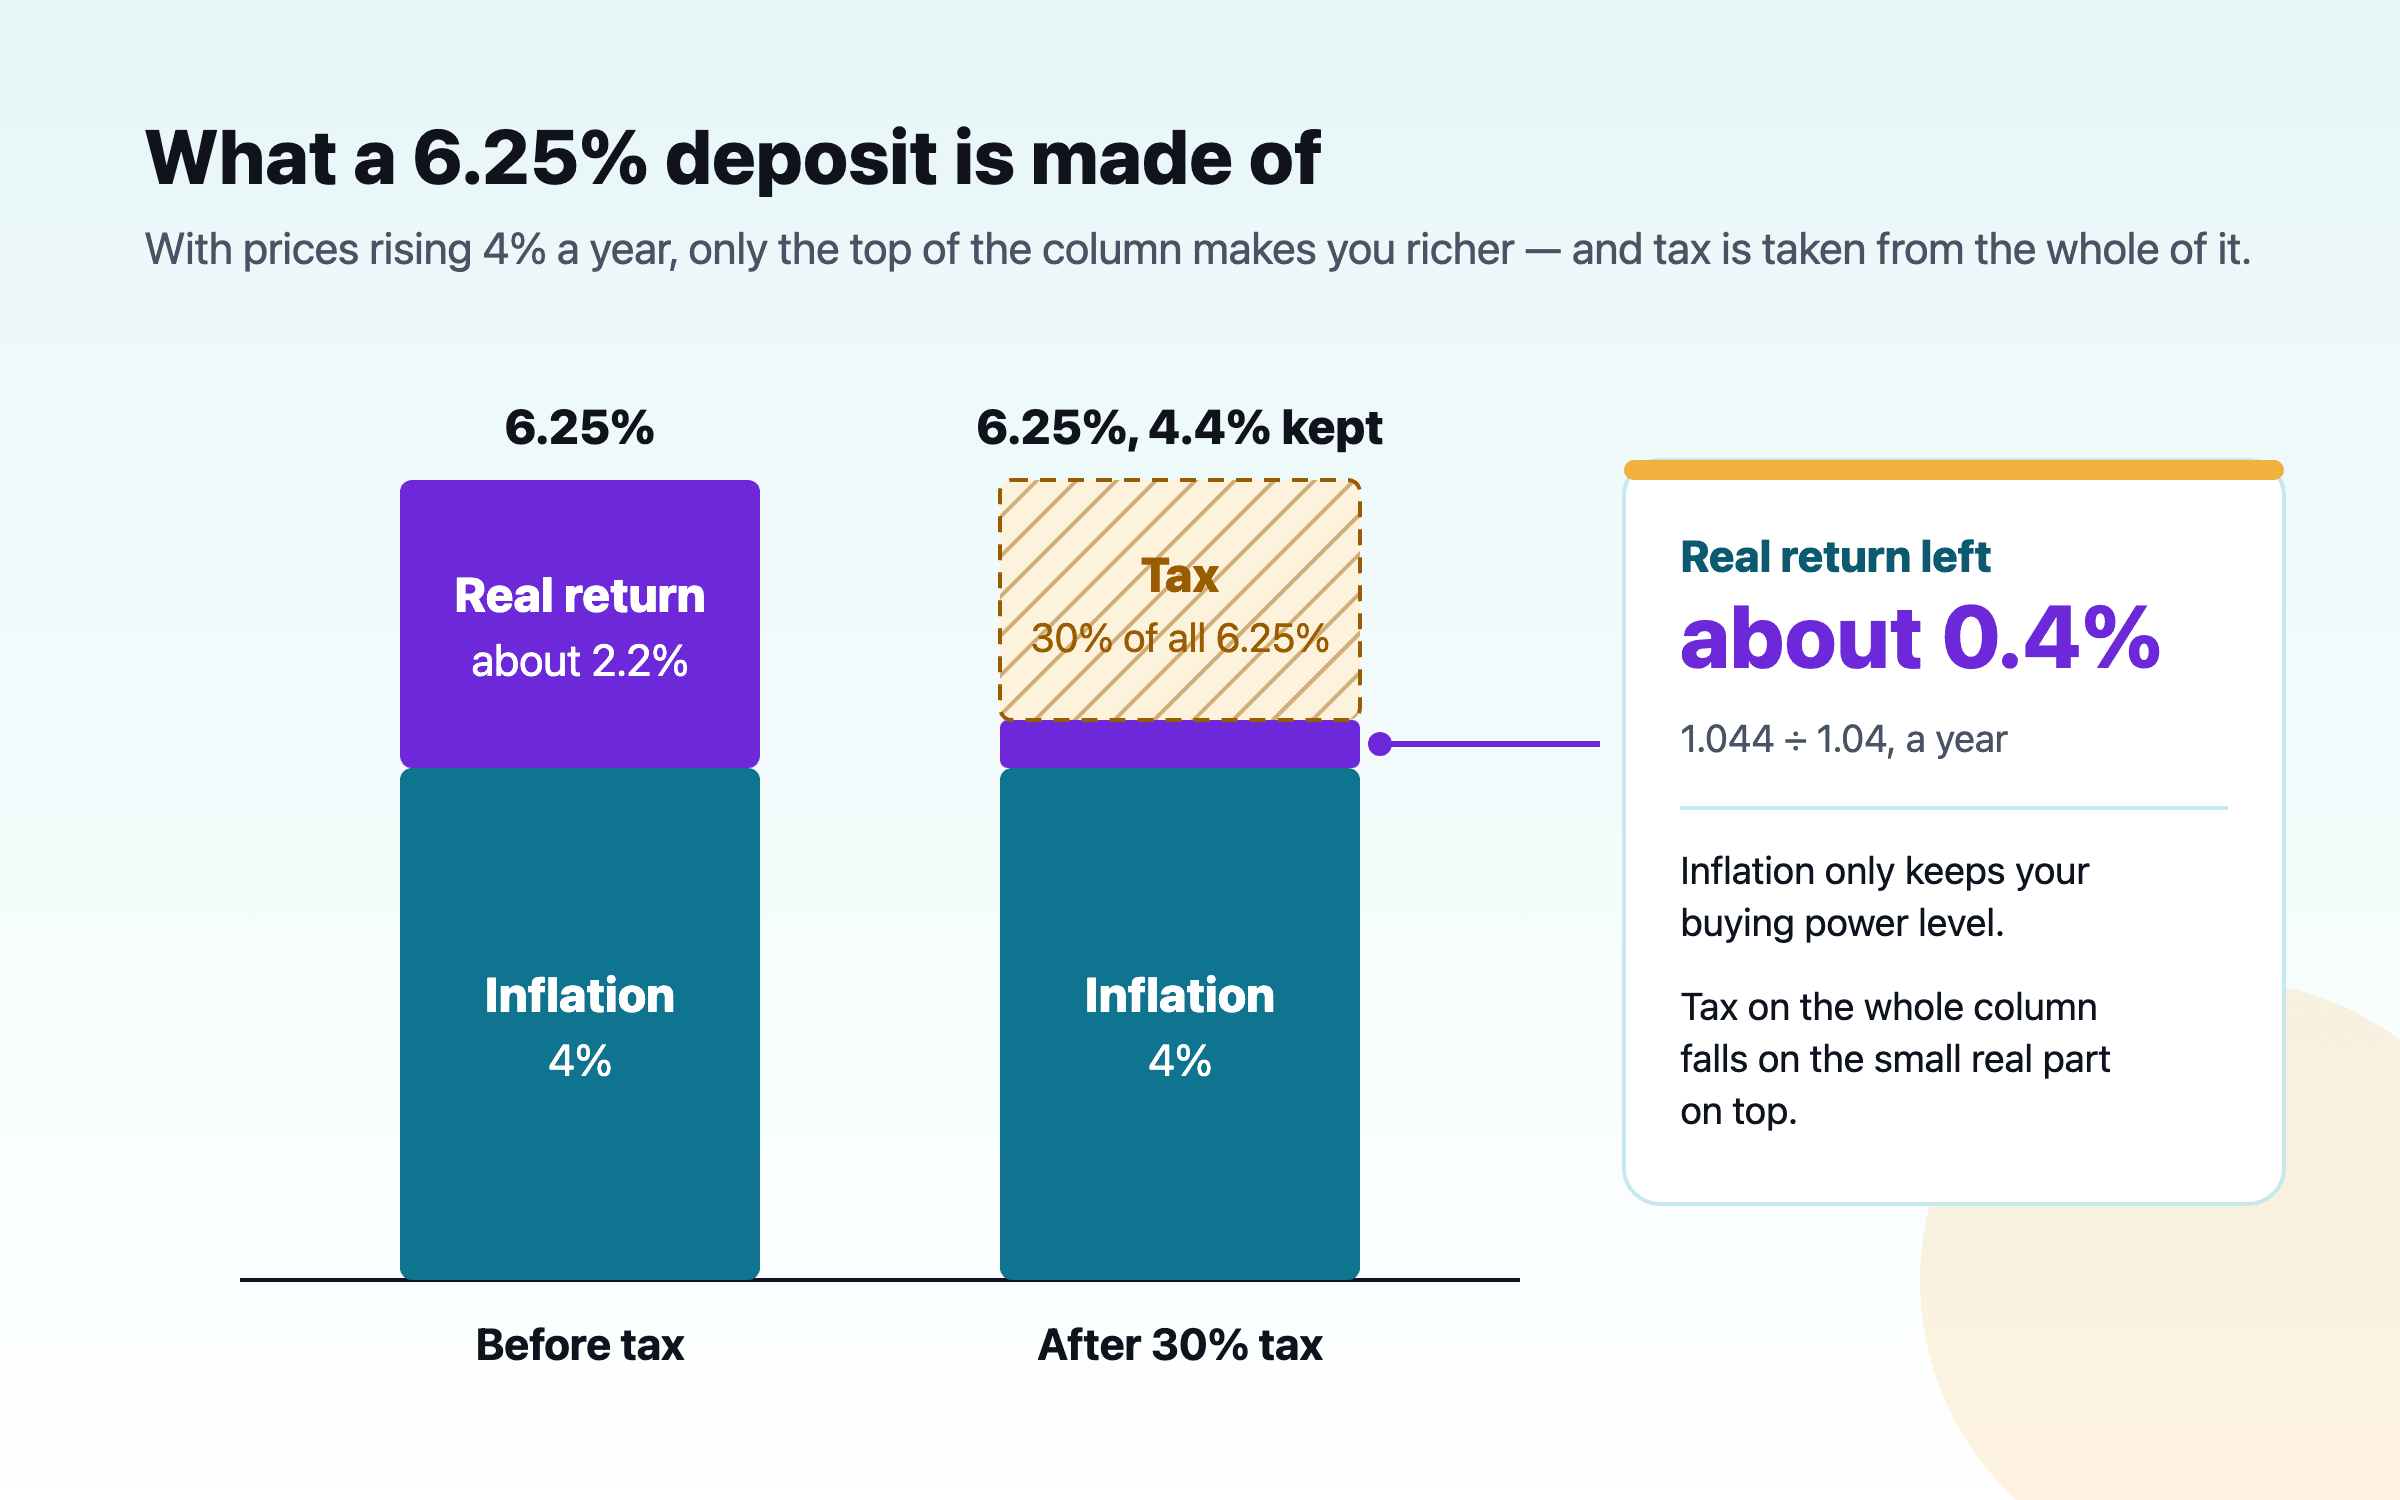
A nominal return has two parts. Inflation only keeps your buying power where it was; the real return is what makes you richer. Tax is charged on the whole column, so it falls hardest on the small part on top.
A century of returns, before and after inflation
The longest consistent record is the one Elroy Dimson, Paul Marsh and Mike Staunton keep for UBS. One US dollar put into shares at the start of 1900 had grown to $124,854 by the end of 2025, against $284 in long-term government bonds and $69 in Treasury bills — while prices rose 38-fold1. Those totals work out at about 9.8%, 4.6% and 3.4% a year before inflation. Divided by the rise in prices, they are about 6.6%, 1.6% and 0.5% a year after it1.
US returns a year, 1900–2025, before and after inflation
Nominal
Real (after inflation)
Annualised from the growth of one dollar over 126 years and a 38-fold rise in prices, about 2.9% a year. Inflation took a third of the return on shares, most of it on bonds and nearly all of it on cash. 1The figures in this chart
Nominal
Real (after inflation)
Shares
9.8%
6.6%
Long-term government bonds
4.6%
1.6%
Treasury bills
3.4%
0.5%
Read the chart from the right. Cash and bills roughly kept pace with prices for a century, which is what they are for: safety, not growth. Bonds did a little better. Almost all of the long-run growth in buying power came from shares, and even there inflation took a third of the headline. That is why a plan to stop working on your savings has to rest on real returns: the nominal ones overstate what a lifetime of saving buys by a factor that grows every year.
Your deposit, after inflation and after tax
Take a one-to-two-year fixed deposit at State Bank of India, which paid 6.25% in October 20268, against India’s 4% inflation target2. In real terms that is 1.0625 ÷ 1.04, about 2.2% a year. Deposit interest is taxed every year as income, though, and tax is charged on the whole nominal return, not on the real part. A saver taxed at 30% keeps about 4.4% of the 6.25%, and 1.044 ÷ 1.04 leaves a real return of about 0.4%.
Illustrative arithmetic, not a forecast. SBI’s card rate for one to two years and India’s inflation target; a flat 30% tax with cess and surcharge ignored. The real gain is the year-end balance divided by 1.04, less ₹10 lakh; inflation’s bite is measured on the whole year-end balance, so the rows add up. 8,2
A ₹10 lakh deposit for one year
Before tax
After 30% tax
Interest at 6.25%
₹62,500
₹43,750
Lost to 4% inflation (what the year-end balance no longer buys)
about ₹40,900
about ₹40,100
Gain in what you can buy, in today’s money
about ₹21,600
about ₹3,600
Real return
about 2.2%
about 0.4%
Nothing about the deposit is wrong. It is safe, and over a short horizon safety is the point. But a household that keeps its long-term savings in deposits because they never show a loss is, after tax, holding its buying power roughly level, and a deposit at a lower rate than inflation shrinks it. The same arithmetic runs everywhere: in the US, the ten-year Treasury yielded 5.31% on 5 October 20269 against 2.95% on the inflation-protected TIPS of the same term10, and the 2.36-point gap is roughly the inflation the market expects over the decade.
How big is a future number, really?
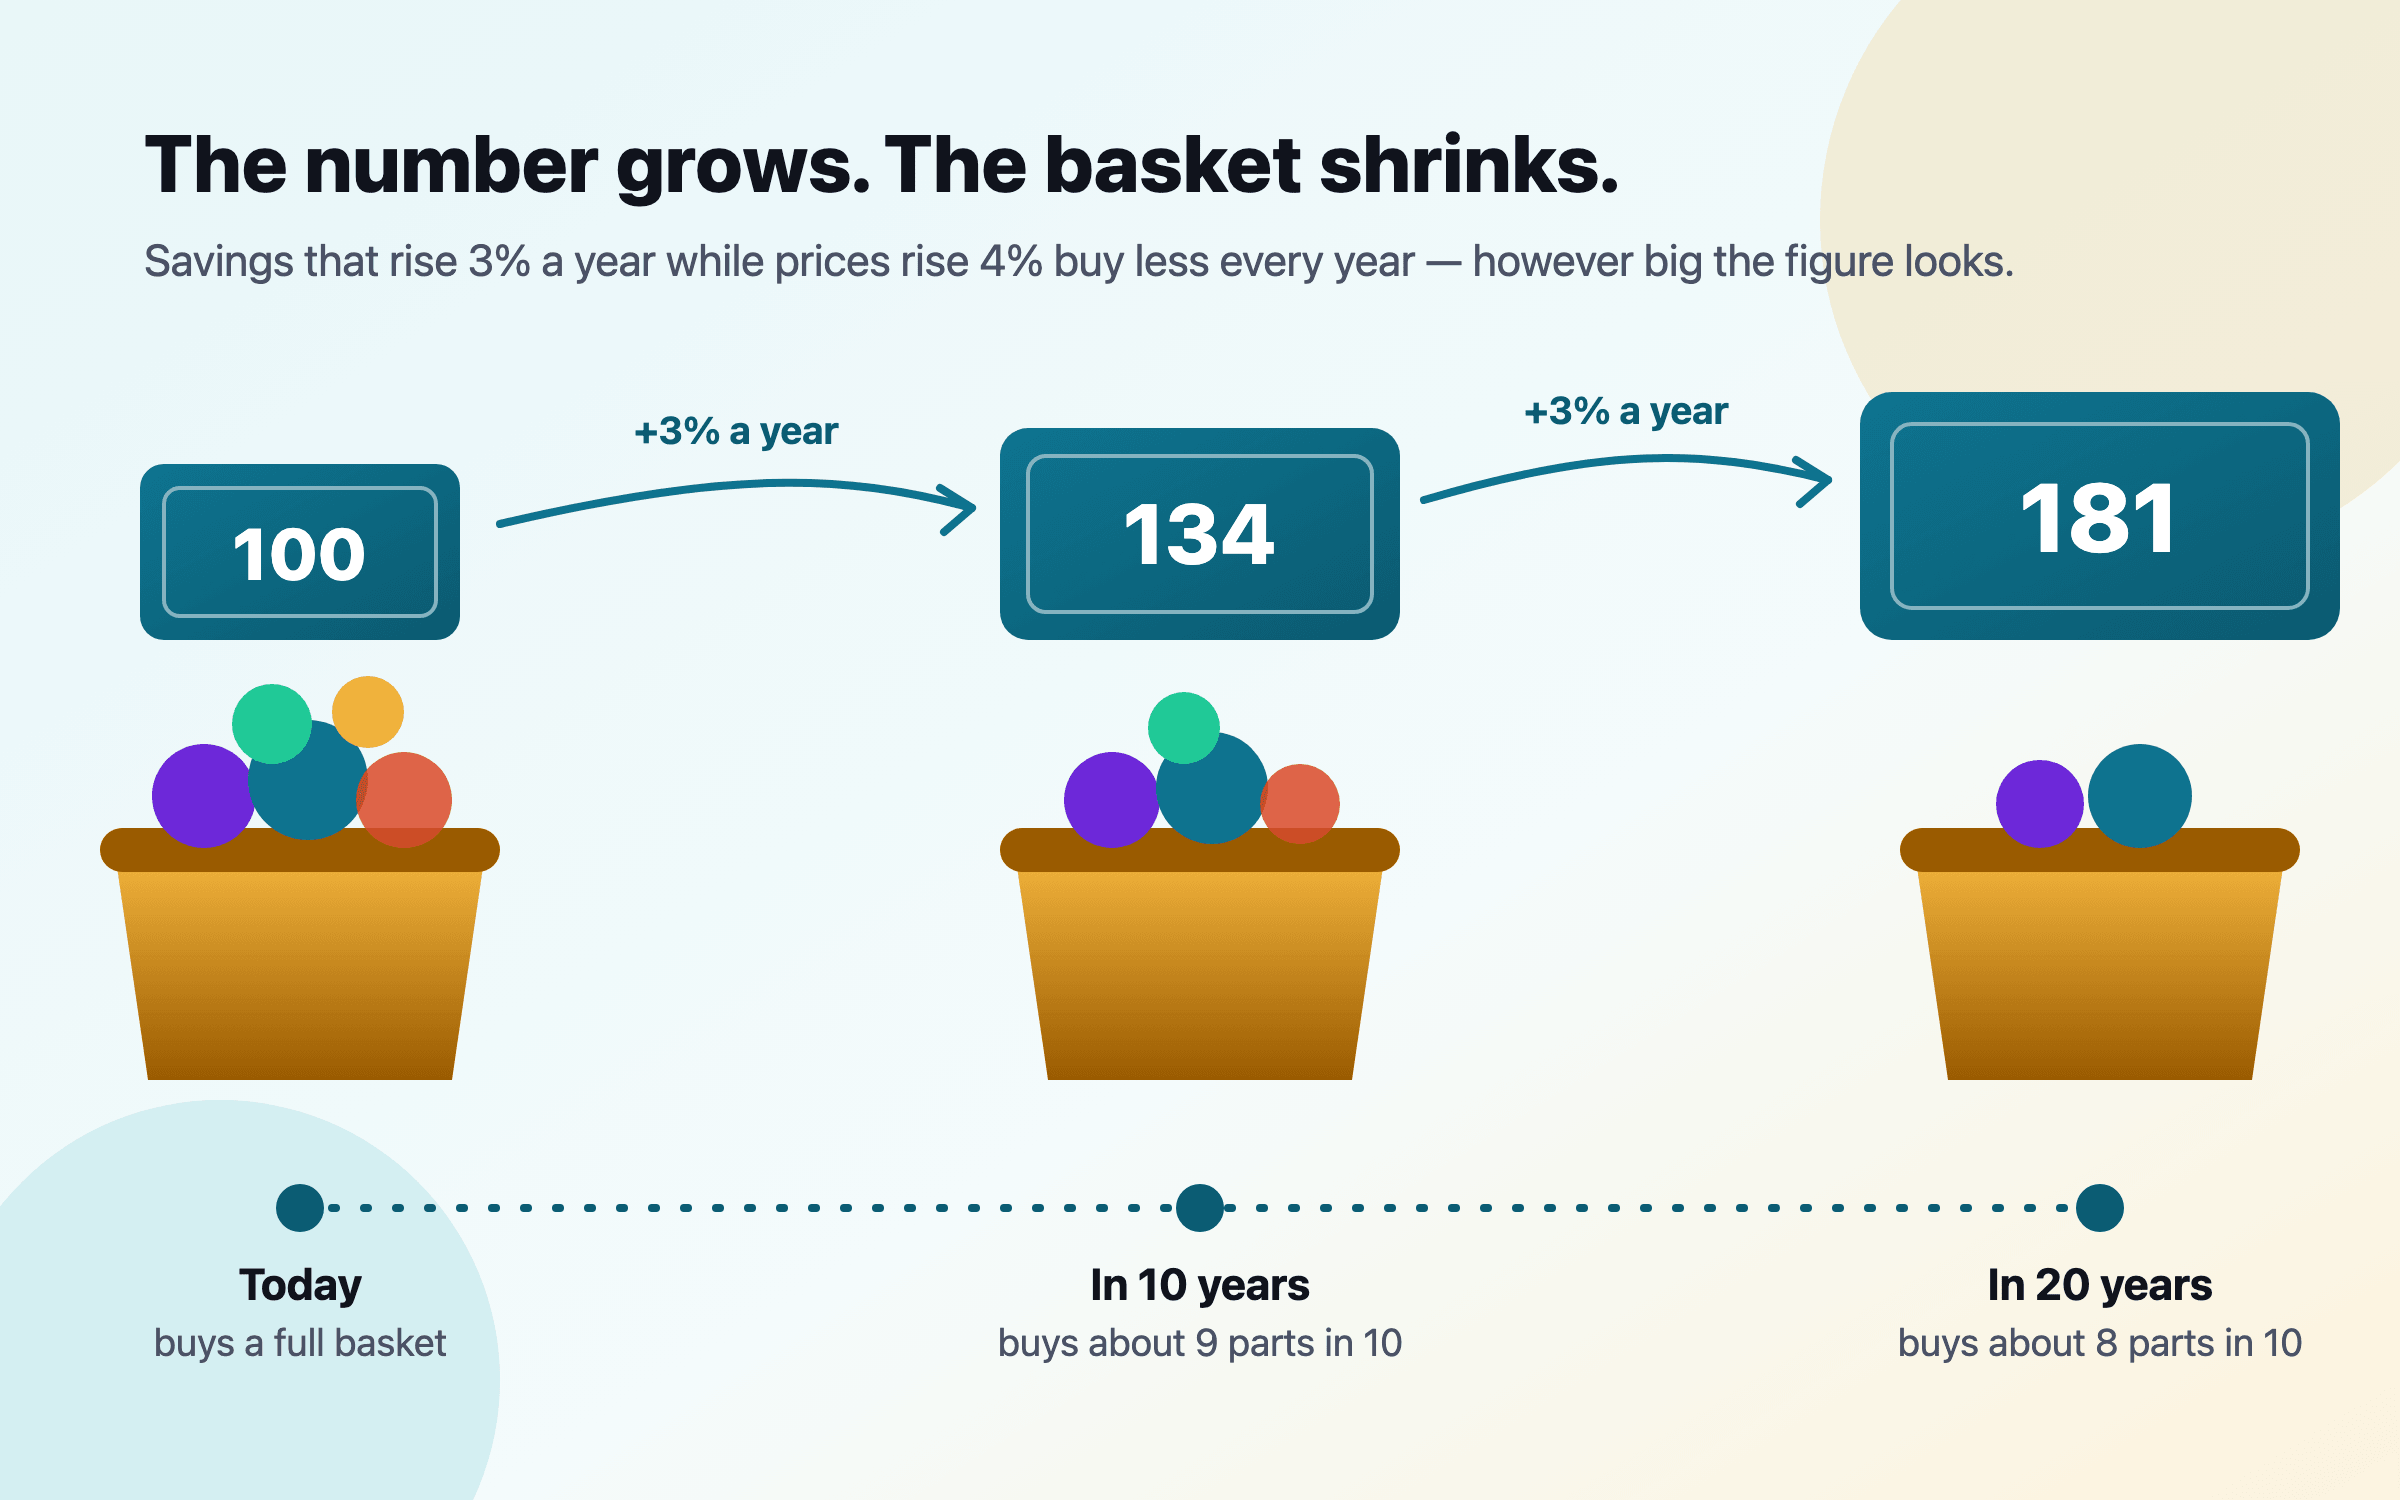
Inflation works on a target as well as on a return. A corpus of ₹1 crore twenty-five years from now, at 4% inflation, buys what about ₹37.5 lakh buys today: 1 ÷ 1.04²⁵ is 0.3752. At 2% the same sum is worth about ₹61 lakh in today’s money; at 6%, about ₹23 lakh. A projection that quotes your savings in the money of the year you stop working will show large figures, and they are right — they are simply in a smaller unit.
What 100 of today’s money buys in the years ahead, at three inflation rates
2% inflation
4% inflation
6% inflation
Buying power of 100 units of money, discounted at a steady 2%, 4% and 6% a year. Two per cent is the target in the largest advanced economies and 4% India’s; real inflation is never steady, and a few bad years move every line down. 3,2The figures in this chart
2% inflation
4% inflation
6% inflation
Today
100
100
100
5 years
91
82
75
10 years
82
68
56
15 years
74
56
42
20 years
67
46
31
25 years
61
38
23
30 years
55
31
17
The way to read any long projection is to ask which money it is in. Nivritee’s FIRE Planner projects in each year’s own money, because that is what a bank statement in that year will say, and it prices the spending your independence has to cover at the same inflated rates — so the target and the savings are measured in the same unit and the verdict compares like with like. The outcome card says in words how the large future figure and the verdict fit together.
Money illusion: why the nominal number feels real
In 1997 Eldar Shafir, Peter Diamond and Amos Tversky asked people about pay rises, house sales and contracts under different inflation rates and found that they reason in both nominal and real terms at once, with the nominal figure pulling their judgement11. A 5% raise in a year of 4% inflation tends to feel better than a 2% raise when prices are flat, though the second leaves you richer. The finding has since been replicated with new samples12.
The illusion shows up in household money in familiar ways. A house bought for ₹40 lakh and sold for ₹1 crore twenty years later feels like a large gain; at 6% inflation the price only needed to reach about ₹1.28 crore to stand still in real terms, so it lost buying power2. A salary that doubles over fifteen years looks like progress until it is set beside what rent and school fees did in the same years. And a pension that is not linked to prices loses a third of its buying power in about fourteen years at 3% inflation.
Planning in real terms: five habits
Compare every return with your own inflation, not a headline one. A household whose biggest costs are school fees and healthcare faces faster inflation than the index. See why inflation is not one number.
Ask what tax does to the real part. Tax on the whole nominal return can take most of a small real return, which is why where an investment is held can matter as much as what it is.
Keep growth money where it can outrun prices. Over long horizons shares have been the main source of real growth; cash is for the money you will need soon. See risk and return.
State every future target in the same money as the savings meant to meet it. A target in today’s money set against savings in future money makes any plan look better than it is.
Test a few bad years. Inflation is not steady. A plan that only works if prices behave is a plan with a hidden assumption — run it with a burst of high inflation and see what moves.
Questions people ask
What is the difference between a real and a nominal return?
A nominal return counts the growth in money; a real return counts the growth in what that money buys. The real return is (1 + nominal) ÷ (1 + inflation) − 1, so 7% with 5% inflation is about 1.9%4.
Is subtracting inflation from the return close enough?
When both are small, yes. As they grow the shortcut overstates the real return; at 12% returns and 8% inflation it says 4% when the true figure is about 3.7%.
What real return have shares delivered over the long run?
US shares returned about 6.6% a year after inflation from 1900 to 2025, against about 1.6% for long-term government bonds and 0.5% for Treasury bills1. Other markets returned less, and past returns are not a forecast.
Do fixed deposits beat inflation?
Before tax, often slightly: SBI’s 6.25% against India’s 4% target is about 2.2% real8,2. After tax at a high rate, the real return can fall close to zero.
Should a long-term projection be in today’s money or future money?
Either works if the target and the savings are in the same one. Mixing them — a target in today’s money against savings grown in future money — makes a plan look stronger than it is.
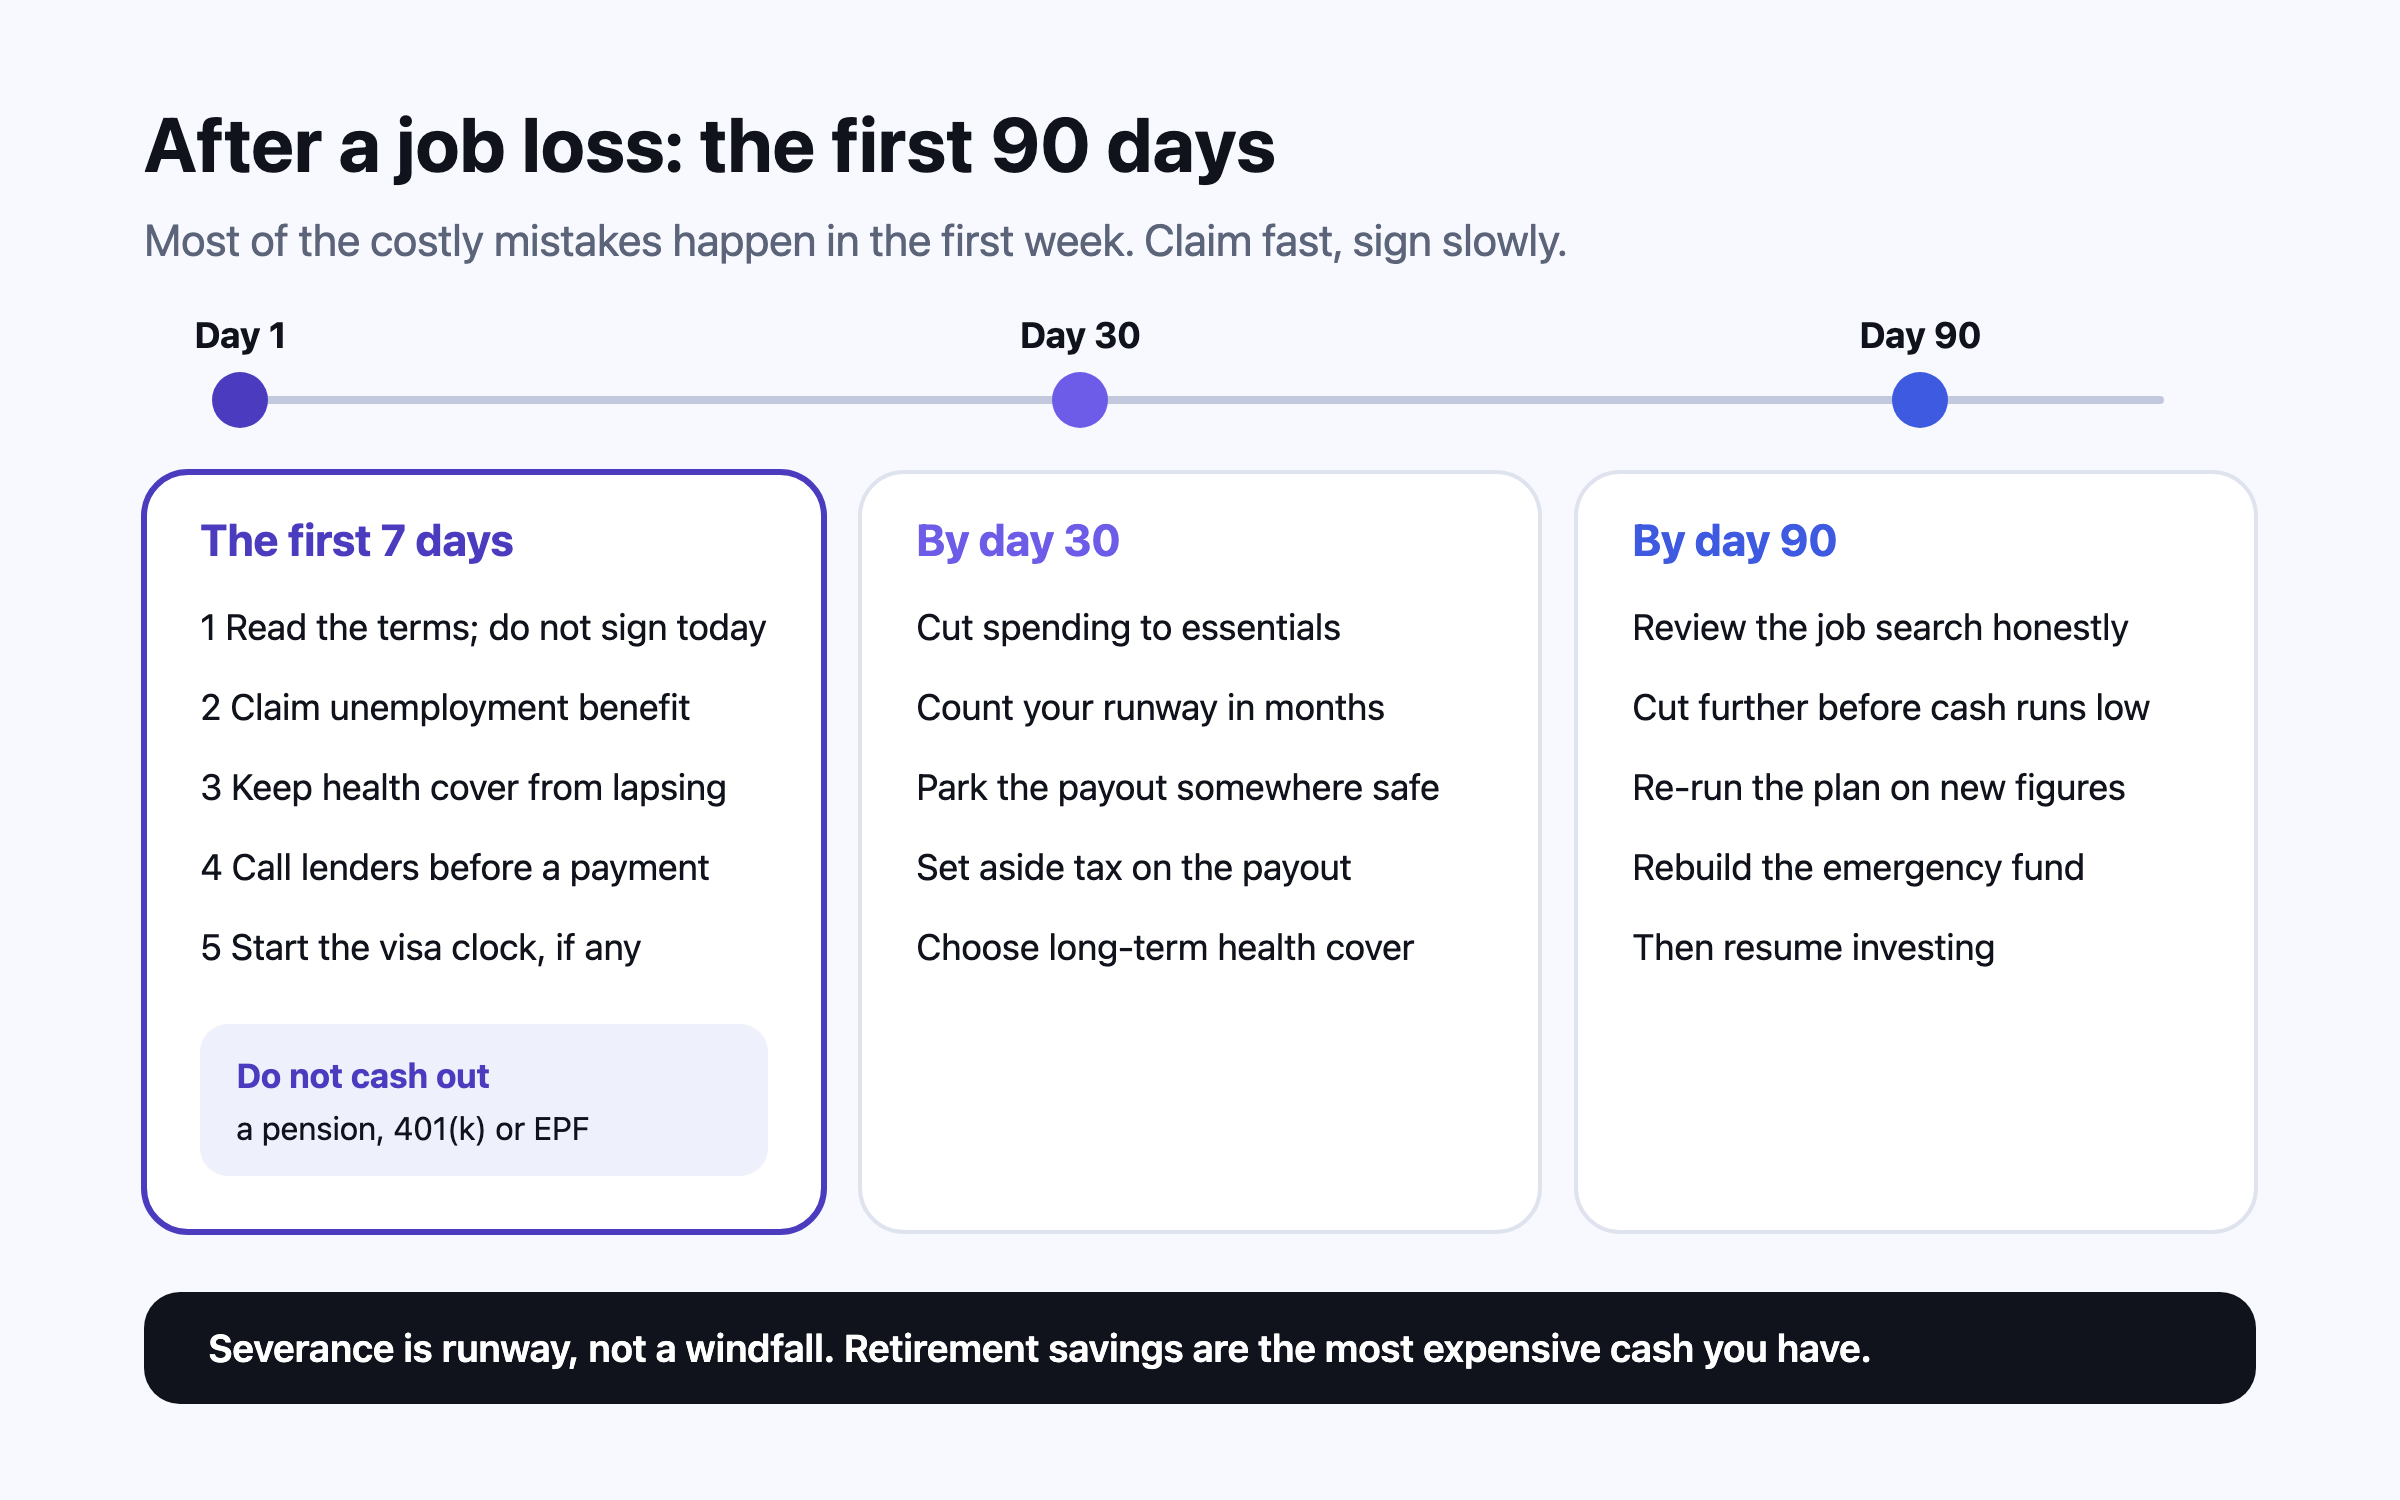
Most of the expensive mistakes after a layoff happen in the first fortnight: signing a severance agreement unread, claiming benefits late, letting health cover lapse, missing a loan payment without calling the lender, and cashing out retirement savings. This is the order to do things in, with the 2026 rules for the US, UK, India, Canada, Australia, Singapore and the UAE.
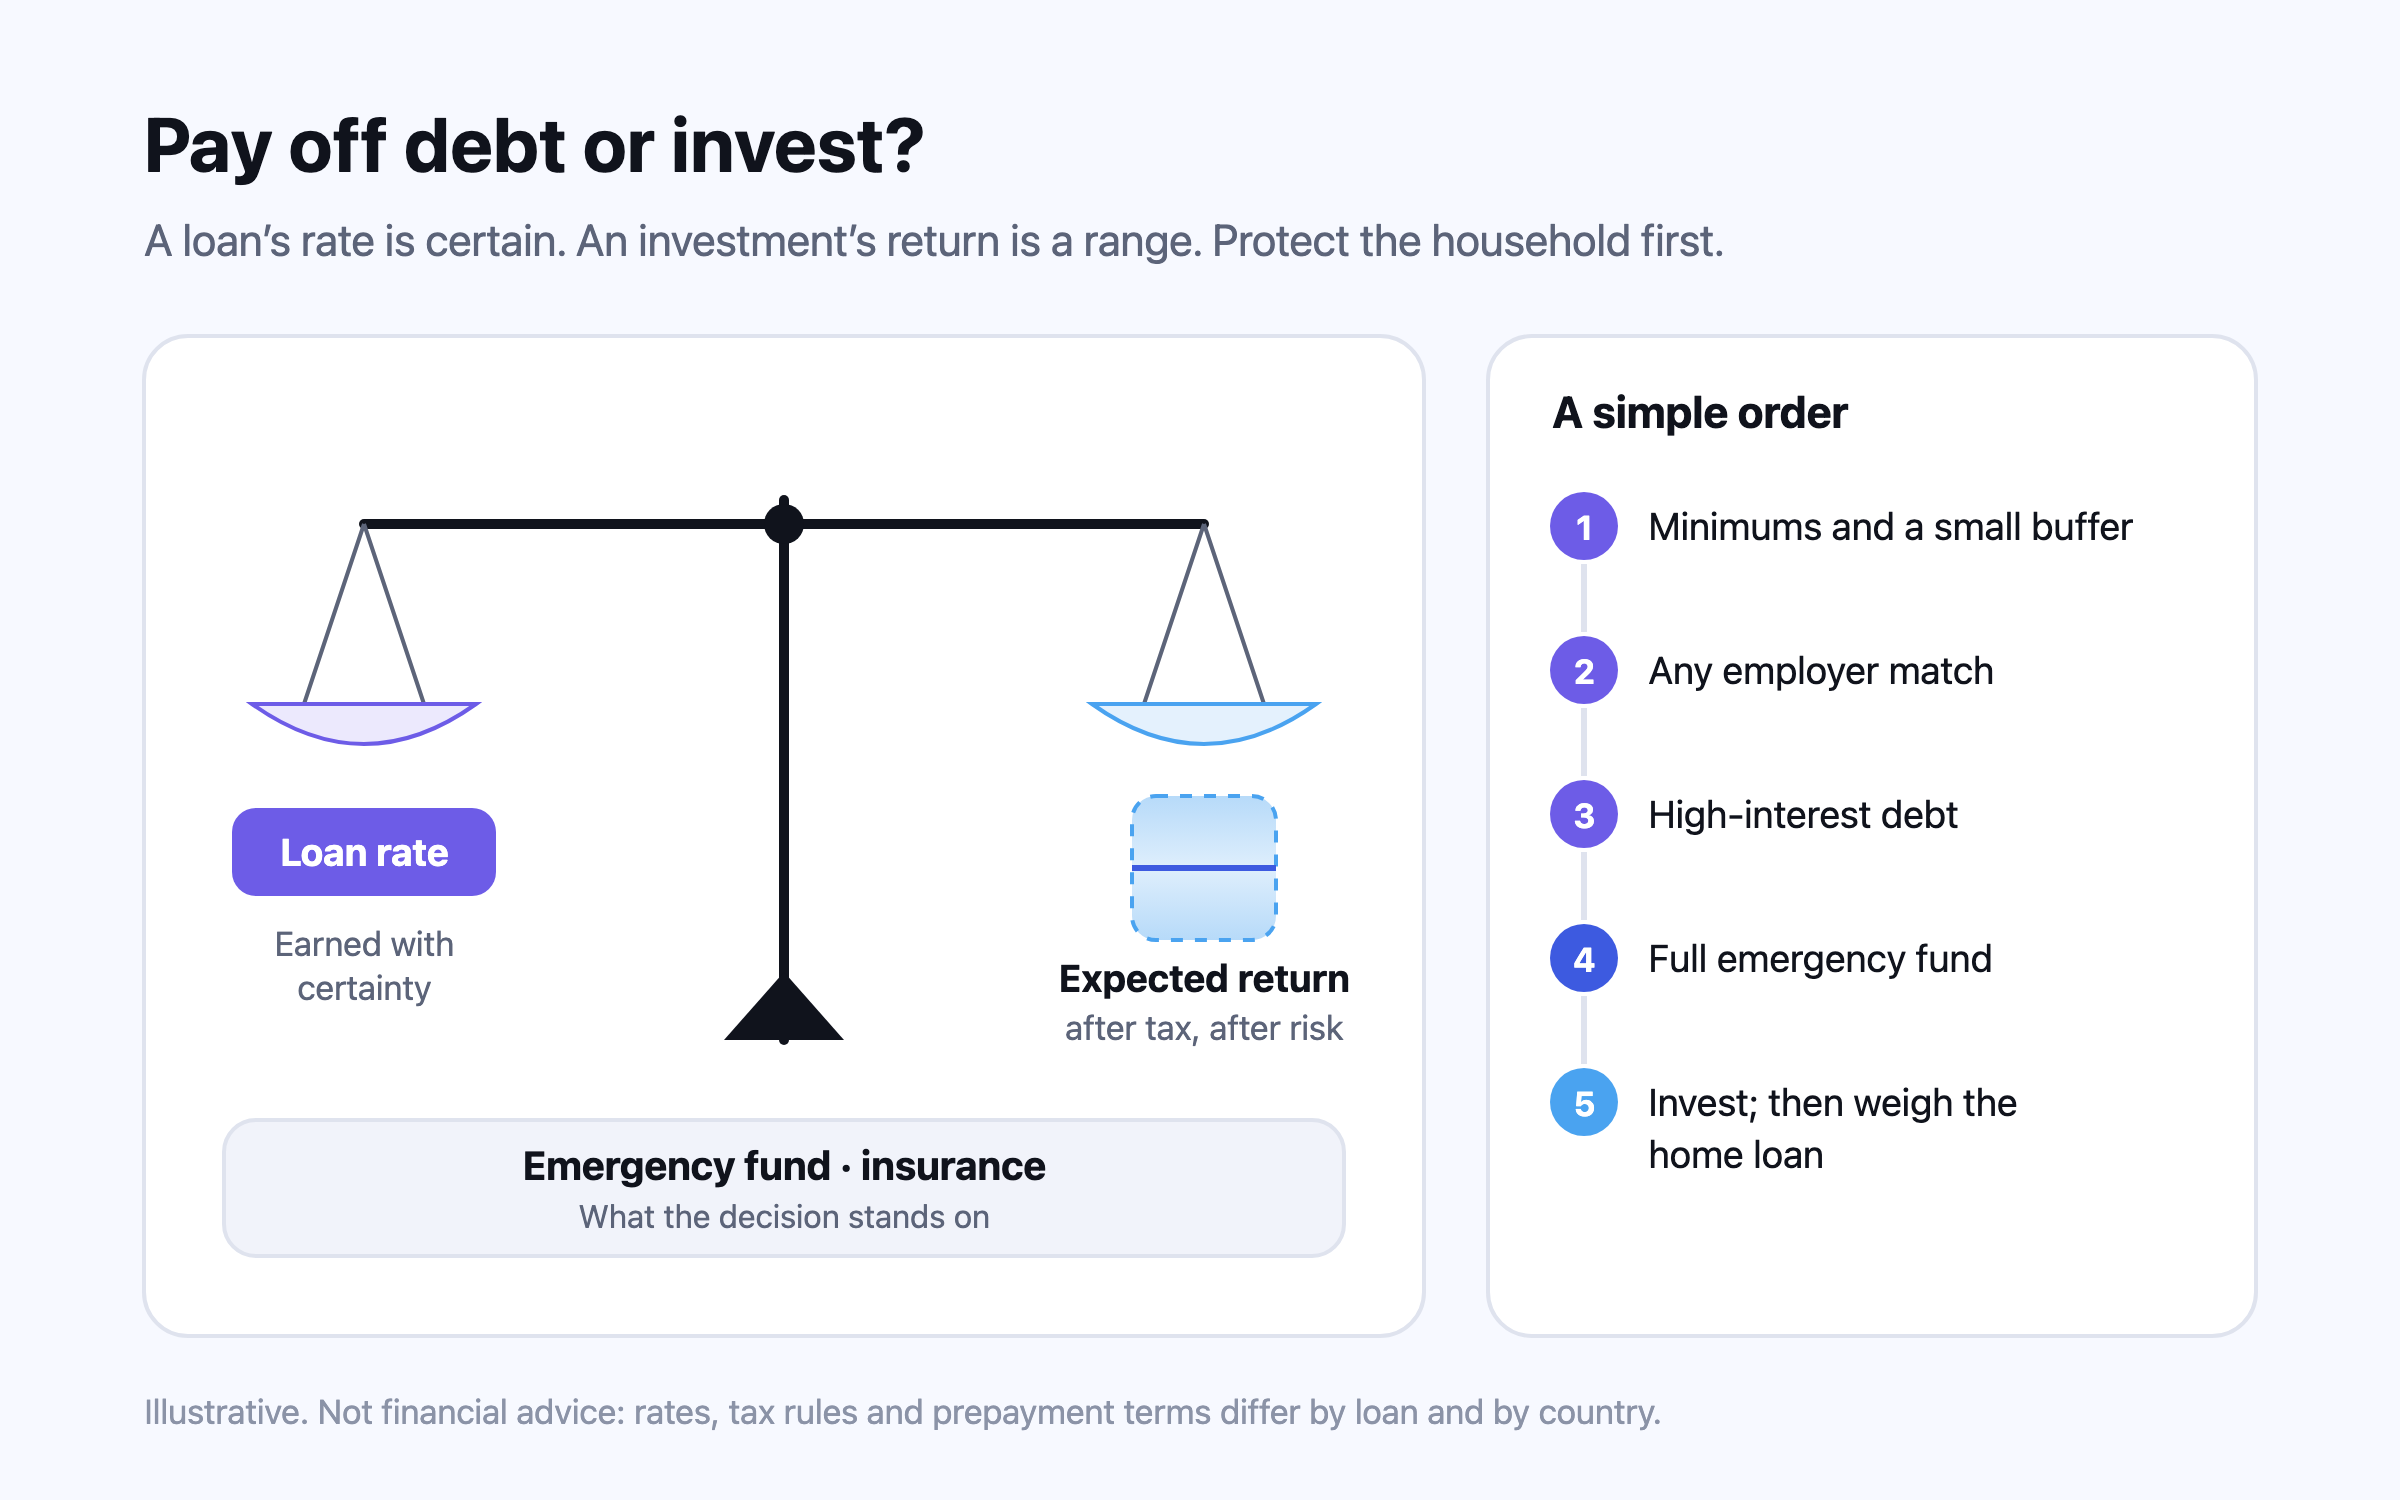
Repaying a loan earns its interest rate with certainty; investing earns an uncertain return, after tax. So costly debt goes first, a low-rate mortgage can sit beside investing, and an emergency fund and the right insurance come before both.
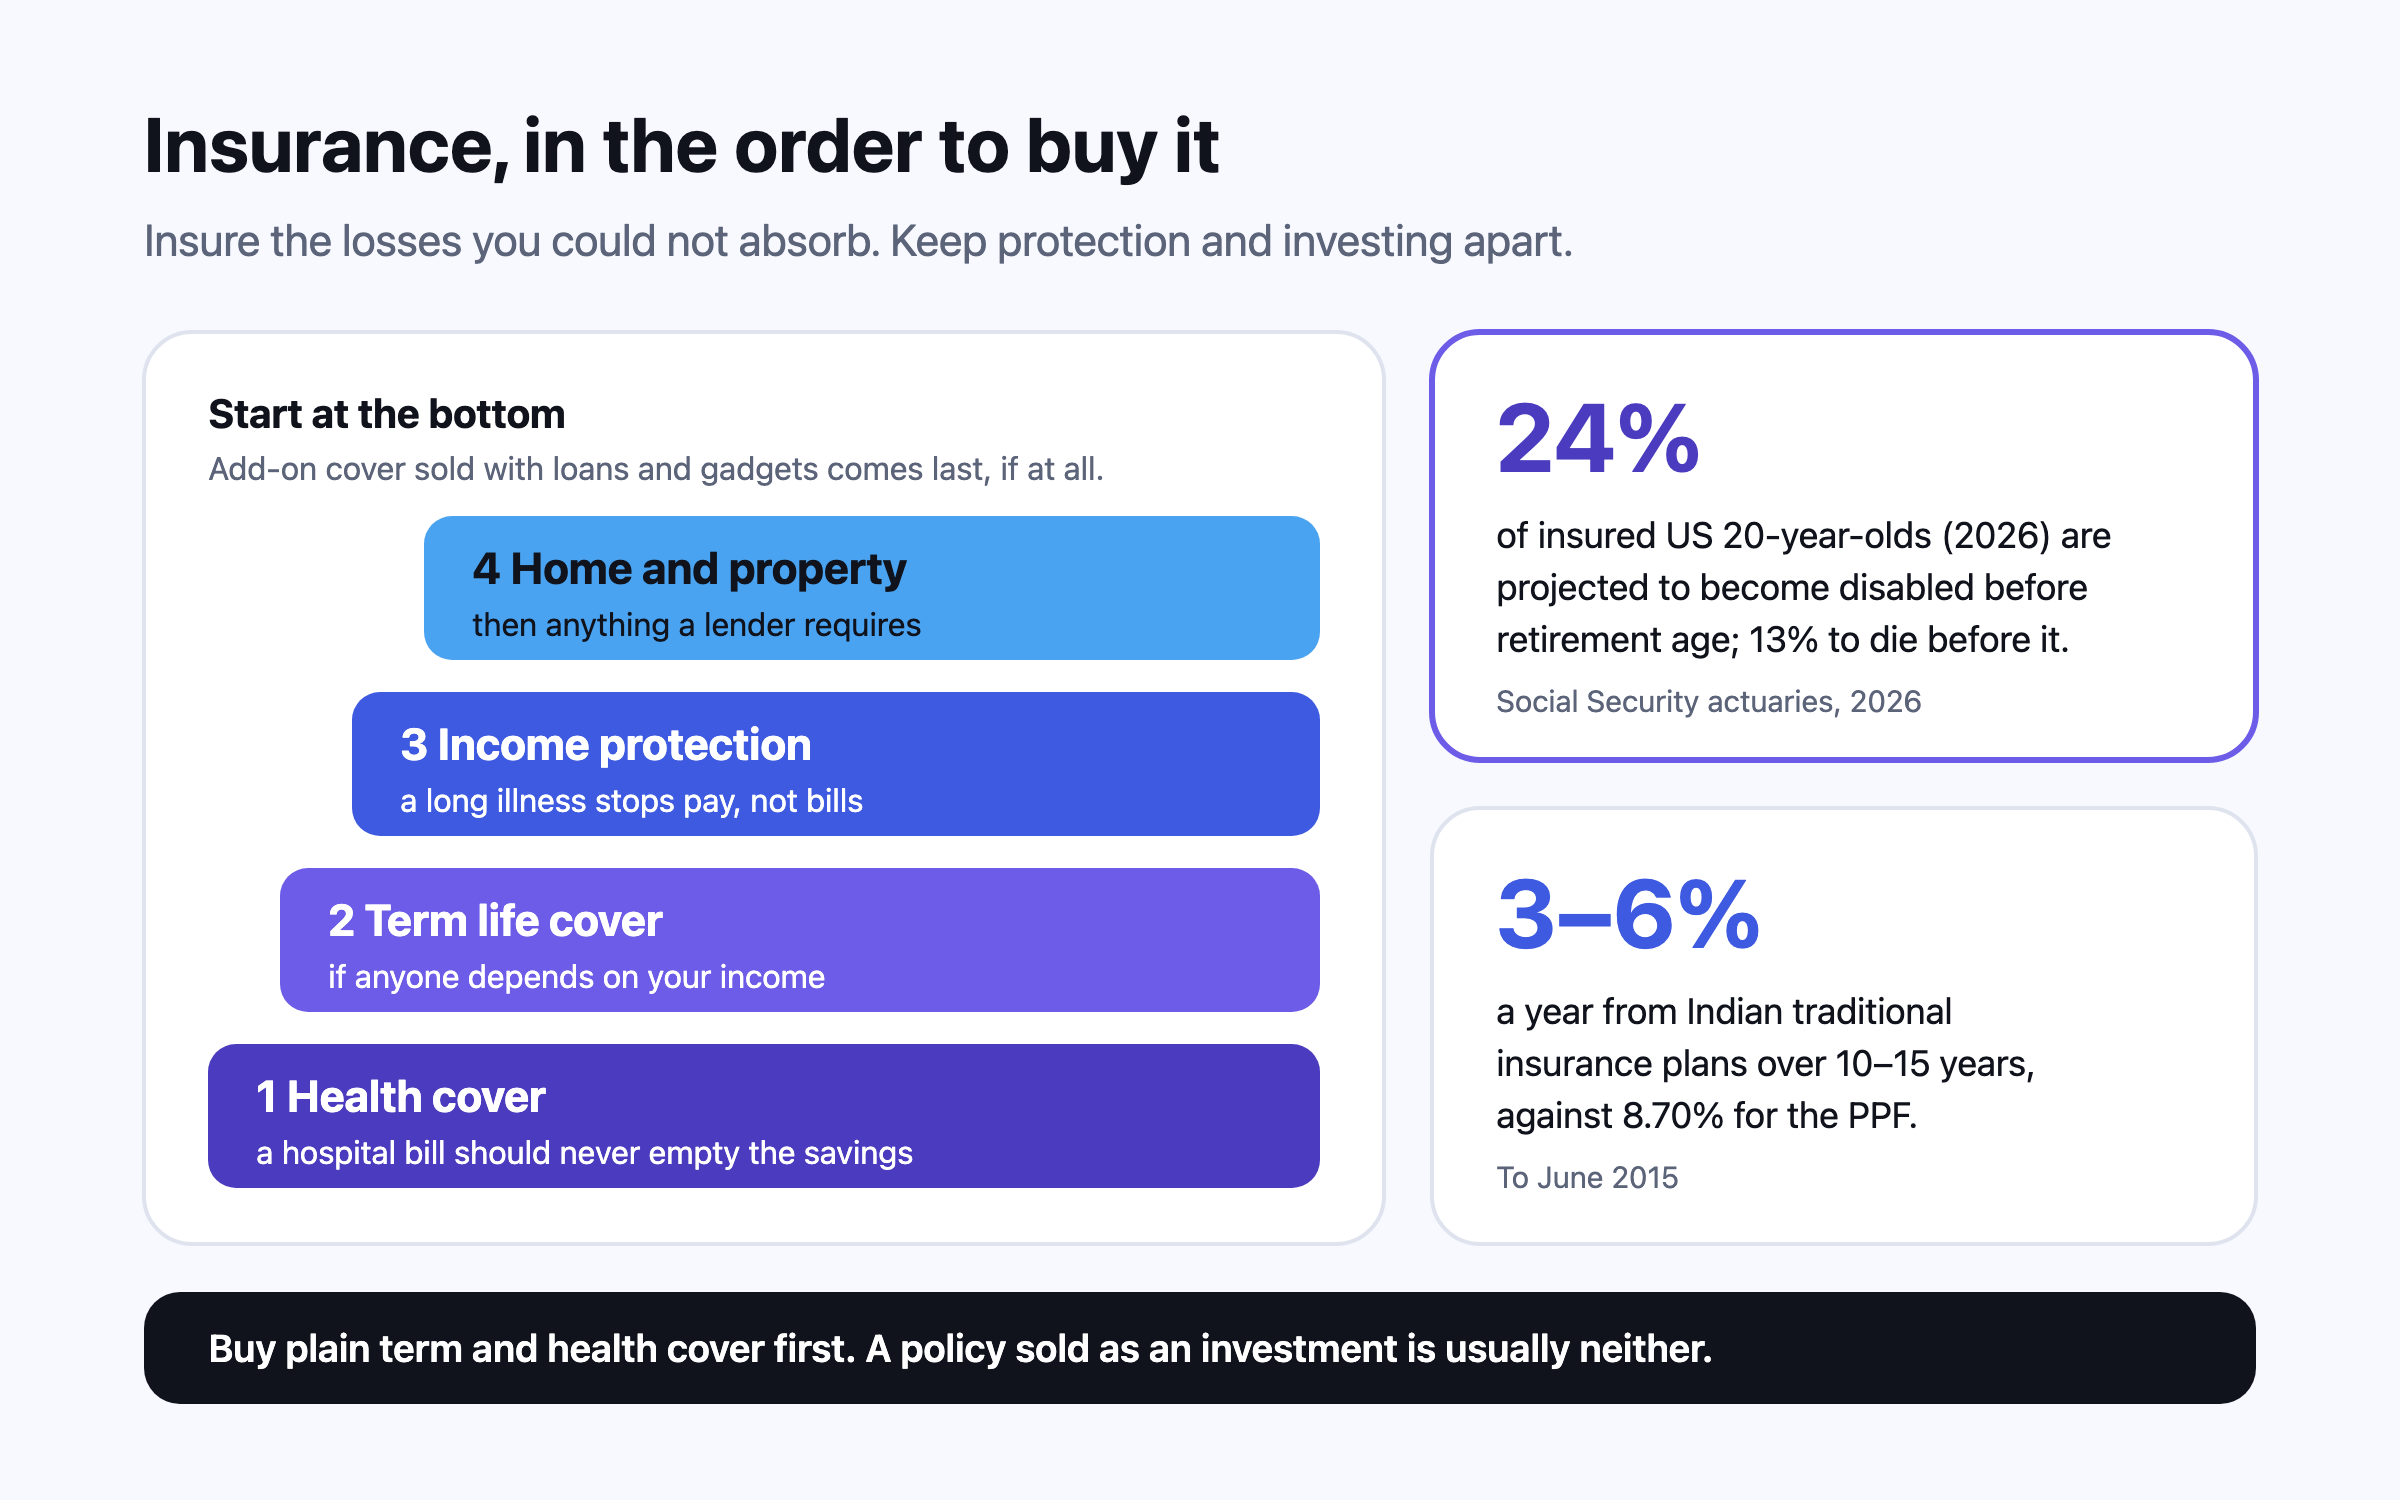
Insurance is for losses a household could not pay for itself: a large medical bill, the death of an earner somebody depends on, or years without income after an illness. Buy cover for those first, in that order, as plain term and health policies; size life cover to what dependants would need rather than to a multiple of salary; and be wary of policies that mix insurance with investment, which in India have returned 3–6% a year over 10 to 15 years.
This is general information, not financial, tax or legal advice for your circumstances. Rules and figures change; check the official source for your country, and consult a licensed professional before making financial decisions. Projections are estimates, not predictions.