Shares have paid more than cash because they can fall by half — and the longer you can hold them, the less likely that fall is to be the end of the story.
US shares returned about 10% a year from 1928 to 2025 against about 3.4% for Treasury bills, but lost money in 26 of those 98 years and fell 57% from peak to trough in 2007–09. Over every 20-year stretch in that record they still made money. Risk is the price of the extra return: what matters is whether you can afford to wait out a fall and whether you will.
Nivritee Research · 6 October 2026 · 8 min read
Return and risk come as a pair. Investors have been paid more for owning shares than for lending to a government because shares can fall a long way and stay down for years; if they could not, nobody would accept the lower return on cash. The record is clear on both halves. With dividends reinvested, the S&P 500 returned about 10.02% a year from 1928 to 2025 and three-month Treasury bills about 3.37%, yet shares lost money in 26 of those 98 calendar years, including 43.84% in 1931 and 36.55% in 20081.
how much more a loss weighs than an equal gain, averaged across 607 estimates
Two different things are both called risk
The SEC’s investor-education site defines risk as uncertainty about the return on an asset and the harm that follows when returns are not what you expected, and notes that investors seek higher returns as compensation for taking more of it4. In practice the word covers two different experiences.
Volatility is how much the value swings. It is usually measured as the standard deviation of returns: for the S&P 500, yearly returns from 1928 to 2025 had a standard deviation of about 19.4 percentage points around their average1. Roughly, that means a year 20 points better or worse than average is not unusual, and not in itself a crisis. Volatility is unpleasant, but on its own it costs nothing to somebody who does not sell.
Permanent loss is money that does not come back: a company that goes bust, a market that stays below its peak for decades, or — the most common route — an investor forced or frightened into selling near the bottom. Japan is the cautionary case. The Nikkei 225 closed at 38,915.87 on 29 December 1989 and did not close higher until 22 February 2024, 34 years and 2 months later5. William Bernstein draws the same line in *Deep Risk*: short-term volatility, measured by standard deviation, is a poor guide to the dangers that actually ruin long-term investors, which he names as inflation, deflation, confiscation and devastation6.
Dividends change the arithmetic of recovery more than most charts suggest. The FTSE 100’s price index did not pass its end-1999 level of about 6,930 until February 2015; with dividends reinvested, the total-return index was back above its end-1999 high by February 20067. When you read that a market “took 15 years to recover”, check whether the figure counts dividends.
How far markets fell, and how long they took to come back
A drawdown is the fall from a peak to the lowest point before a new peak. The four big falls of this century give a sense of the range. They are measured on price indices, which leave out dividends.
Price-index drawdowns, peak close to trough. S&P 500 falls from J.P. Morgan’s Guide to the Markets; “with dividends” recoveries from Damodaran’s yearly total returns; MSCI World is the factsheet’s maximum drawdown (net returns). Sensex: closing peaks of 20,873.33 (8 January 2008) and 41,952.63 (14 January 2020); 2009 low taken as 8,047, the early-March figure Business Standard reported; 2020 low the 25,981.24 close of 23 March; recoveries are the record closes of November 2010 and 9 November 2020. 21891011121314155
Index
Episode
Peak to trough
Fall
Back above the previous peak
S&P 500
Dot-com bust
March 2000 to October 2002
−49%
With dividends, by the end of 2006
S&P 500
Global financial crisis
October 2007 to March 2009
−57%
With dividends, by the end of 2012
S&P 500
Covid
19 February to 23 March 2020
−34%
18 August 2020
S&P 500
Inflation and rate rises
January to October 2022
−25%
19 January 2024
MSCI World (US dollars)
Global financial crisis
October 2007 to March 2009
−57.8%
—
BSE Sensex
Global financial crisis
8 January 2008 to March 2009
About −61%
November 2010
BSE Sensex
Covid
14 January to 23 March 2020
−38%
9 November 2020
Nikkei 225
Japan’s bubble
Peak close on 29 December 1989
—
February 2024, 34 years and 2 months later
Falls inside a year are routine. From 1980 to 2025 the S&P 500’s largest fall within each calendar year averaged 14.2%, yet the index ended the year higher in 35 of those 46 years2. J.P. Morgan’s data also show how much a mix of shares and bonds shortens the wait: from 1988 to 2025, a 20% fall in shares took 24 months on average to recover, against 11 months for a 60/40 mix of shares and bonds after a fall of the same size2.
Bonds do not always cushion shares. In 2008, US shares lost 36.55% while ten-year Treasury bonds gained 20.10%, so a 60/40 mix of the two lost about 13.9%. In 2022 both fell together — shares 18.04%, ten-year Treasuries 17.83% — and the same mix lost about 18.0%1. Global shares had a similar year: MSCI World returned −18.14% in 2022, in US dollars with dividends reinvested after withholding tax10. Diversification reduces risk most of the time, not every time. Global diversification over 125 years has the longer record.
Why shares pay more: the equity risk premium
The extra return investors demand for holding shares rather than a safe asset is the equity risk premium. Measured after the fact, it has been large: from 1928 to 2025 the S&P 500 compounded about 6.65 percentage points a year above three-month Treasury bills and about 5.48 points above ten-year Treasury bonds1. The longest record, the UBS Global Investment Returns Yearbook compiled by Elroy Dimson, Paul Marsh and Mike Staunton, shows US shares returning 6.6% a year after inflation from 1900 to 2025, against 1.6% for bonds and 0.5% for bills16. Equities were the best-performing asset in all 21 Yearbook countries with continuous histories16.
A historical premium is not a promise. Aswath Damodaran also estimates the premium the market is pricing in now, from share prices and expected cash flows. It was 4.23% at the start of 2026 and 5.94% at the start of 2023, after the 2022 fall had made shares cheaper17; his monthly update put it at 4.20% on 1 October 202618. The lower figure today says investors are accepting less extra return for the same risk, partly because safe assets pay more than they did: the yield on three-month US Treasury bills was 4.22% on 5 October 202619.
Real returns: the figure that matters
A nominal return is the percentage your money grew; a real return is what is left after inflation, and after tax where tax applies20. The difference is large over a lifetime. In the UBS record for the US, shares returned 9.8% a year in nominal terms from 1900 to 2025 and 6.6% after inflation, which averaged 2.9%; Treasury bills returned 3.4% nominal and only 0.5% real16. Cash has kept up with prices over the long run, but only just. That is the risk of avoiding risk.
Headline inflation from each statistics office, and a short-term rate where one is cited here. These move every month; the Reserve Bank of India raised its repo rate to 5.50% on 7 October 2026. 212223242526192728
Country
Consumer price inflation, year to August 2026
A reference short-term rate
United States
3.4%
3-month Treasury bill yield 4.22% (5 October 2026)
United Kingdom
3.1%
Bank Rate 3.75% (held 17 September 2026)
India
4.82% (provisional)
RBI repo rate 5.50% (from 7 October 2026)
Canada
3.0%
—
Australia
4.0%
—
Singapore
2.3%
—
With inflation where it is in late 2026, the real return on short-term cash is close to zero or slightly positive in most of these countries, before tax. Over 20 years, a safe asset paying a fraction of a point above inflation barely grows in purchasing power. Inflation is not one number explains why a household’s own inflation can run above the headline.
Time and the chance of losing money
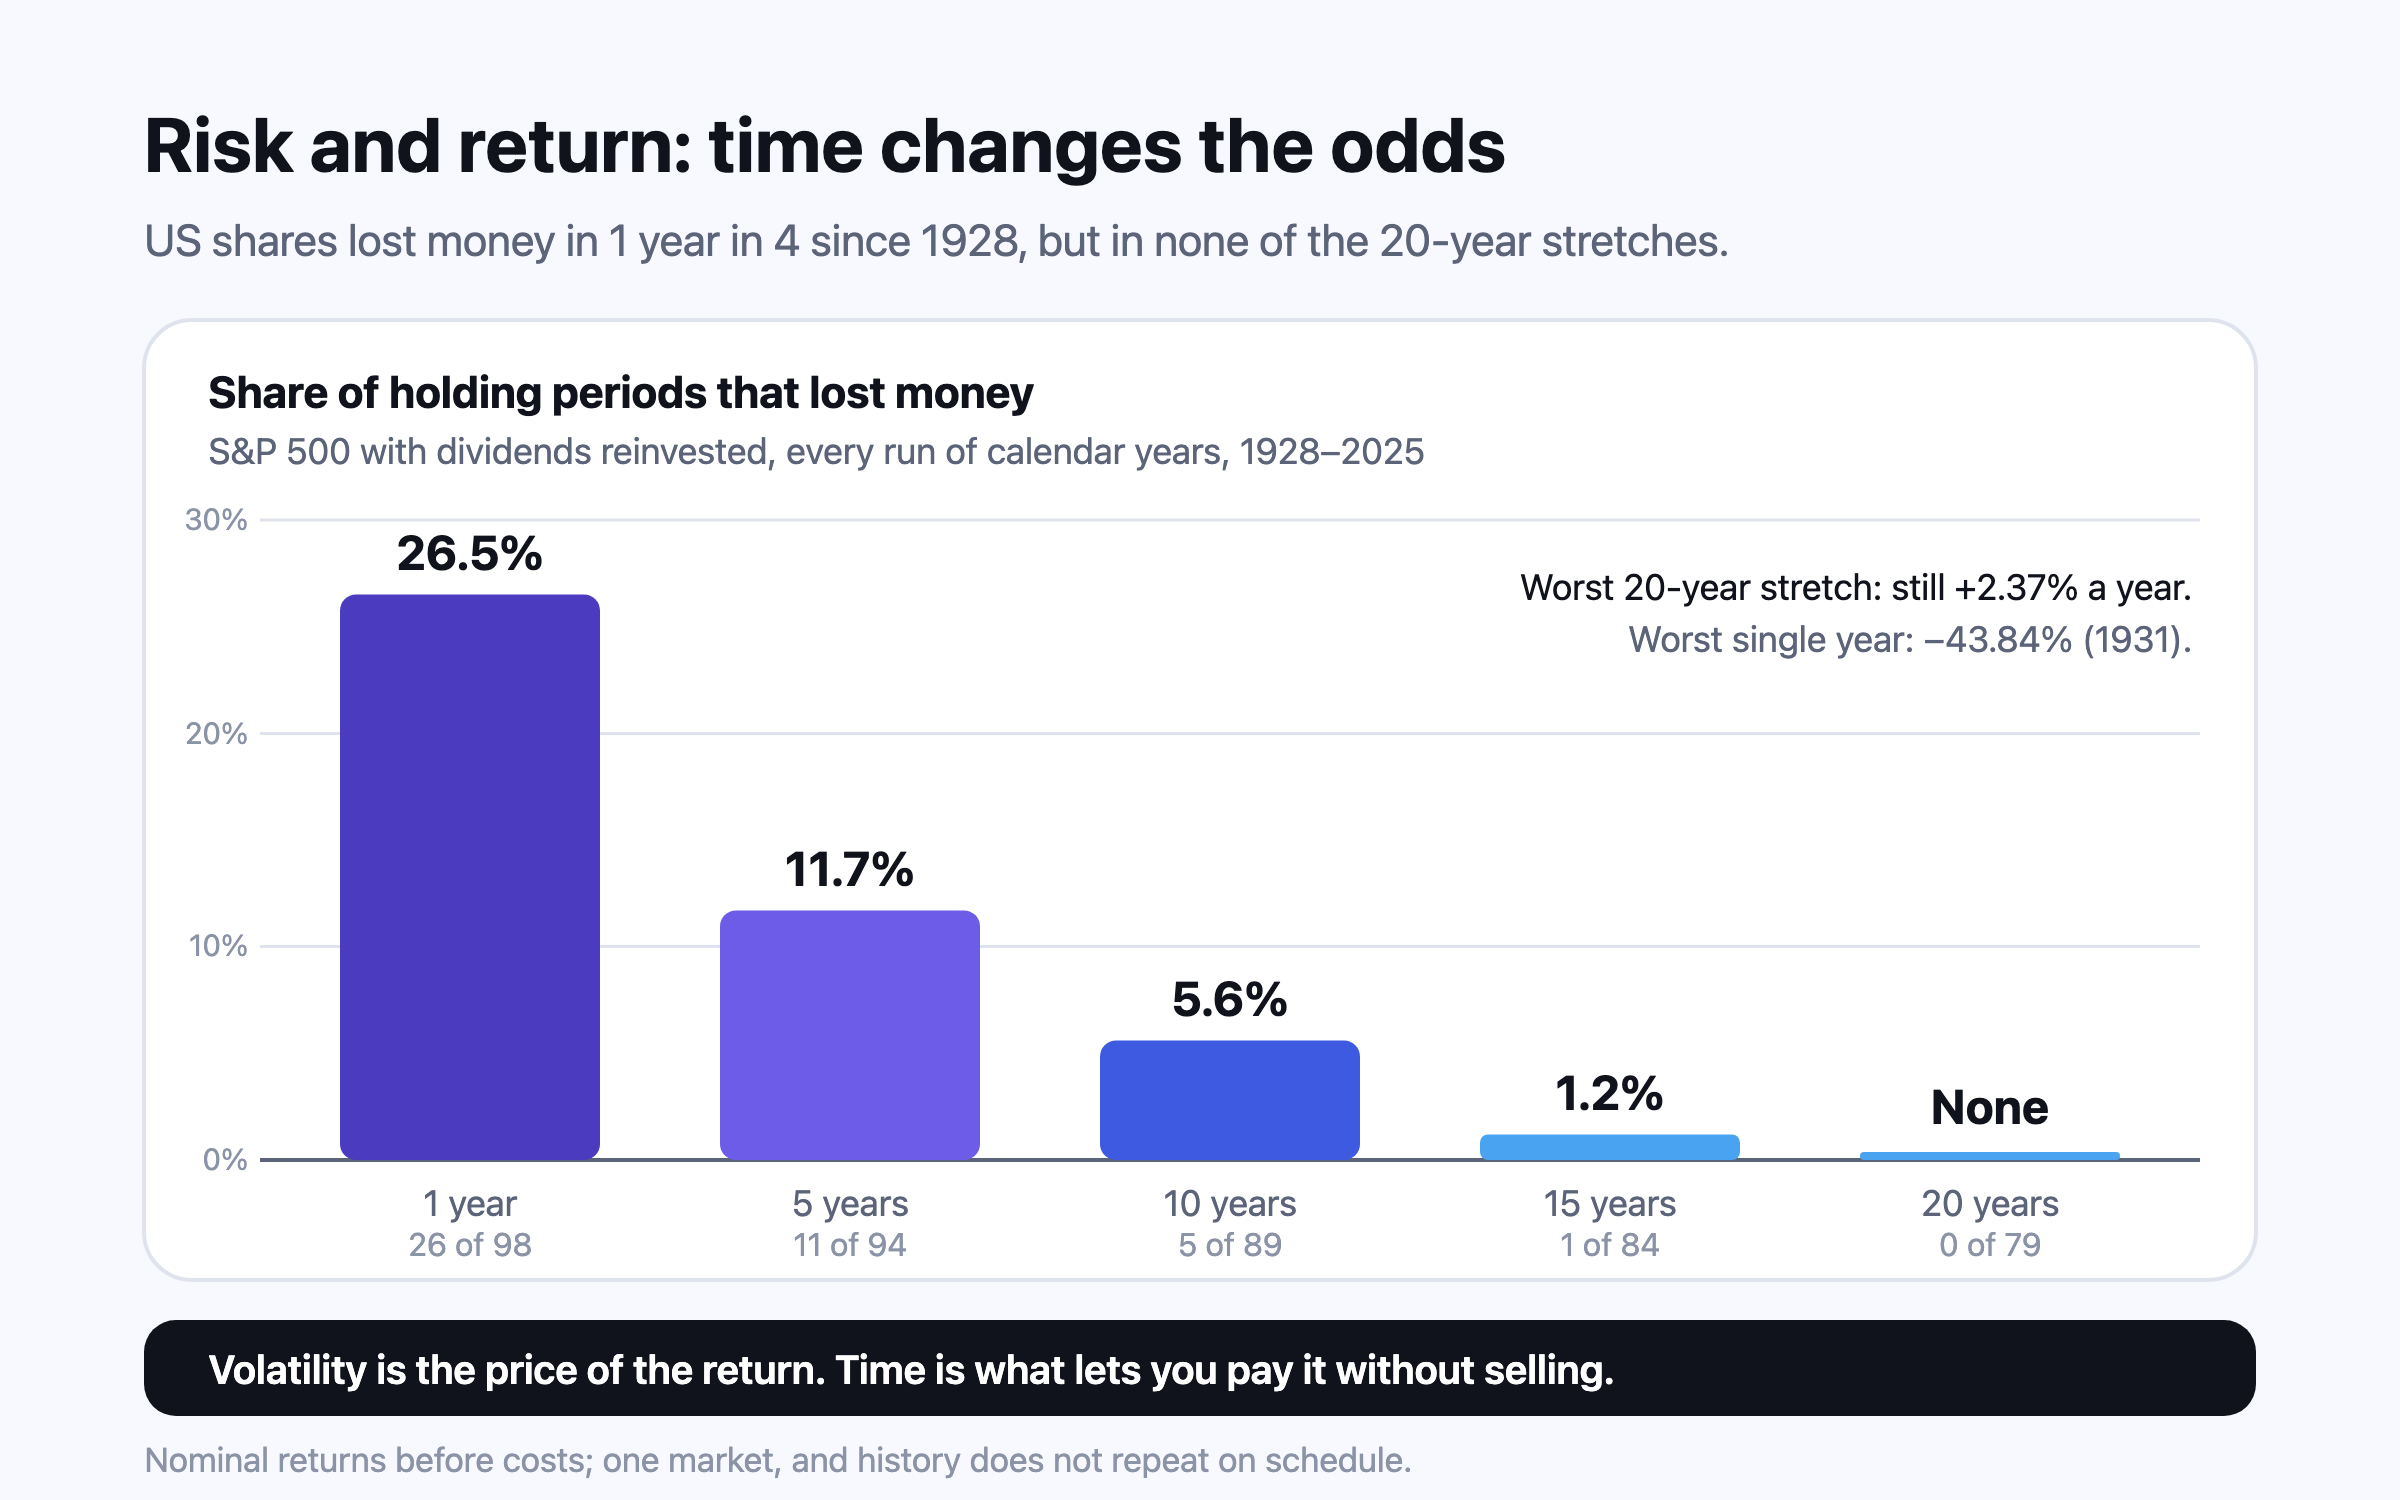
The single most useful fact about risk in shares is how the chance of a loss changes with the holding period. The table is built from Damodaran’s yearly S&P 500 returns with dividends, looking at every run of consecutive calendar years from 1928 to 20251.
S&P 500 with dividends reinvested, before costs and inflation, calendar-year windows 1928–2025, compounded a year. Computed from Damodaran’s published yearly returns. 1
Holding period
Periods in the record
Periods that lost money
Share that lost money
Worst, a year
Best, a year
1 year
98
26
26.5%
−43.84%
+52.56%
5 years
94
11
11.7%
−12.71%
+28.30%
10 years
89
5
5.6%
−1.67%
+20.11%
15 years
84
1
1.2%
−0.20%
+18.80%
20 years
79
0
0.0%
+2.37%
+17.70%
J.P. Morgan’s Guide to the Markets shows the same pattern from 1950 to 2025: one-year returns on US shares ranged from +52% to −37%, rolling ten-year returns from +20% to −1% a year, and rolling 20-year returns from +18% to +6% a year. Bonds ranged far less in a single year (+33% to −13%) but also earned less over 20 years (+11% to +1% a year)2.
Three caveats keep this honest. These are nominal returns; after inflation, losing periods are longer, and the UBS Yearbook records that shares and bonds have each lost more than 70% in real terms on several occasions since 1900, while a 60:40 blend never fell more than 50%16. They are US returns, from what became the world’s most successful market; Japan’s 34-year wait shows a single market can do far worse5. And they assume the investor held on, which many do not: Morningstar found that the average dollar in US funds earned about 8.7% a year over the ten years to 2025, against 9.9% for the funds themselves, because money came in late and left early29.
Risk tolerance and risk capacity are different questions
FINRA describes risk tolerance as the investment risk you are willing and able to accept30, and those two words are worth separating. Willingness — risk tolerance — is psychological. Capacity is financial: the UK regulator’s 2011 suitability guidance defines capacity for loss as the ability to absorb falls in value, and says a loss that would materially harm somebody’s standard of living must count against the risk they can take31. Capacity depends on time, income security, other assets and what the money is for. Tolerance is tested by the first real fall.
Most people overrate their tolerance in a rising market. Prospect theory, set out by Daniel Kahneman and Amos Tversky in 1979, showed that people weigh losses more heavily than equal gains32. A 2024 meta-analysis of 607 estimates from 150 studies put the average loss-aversion coefficient at 1.955: a loss feels about twice as bad as an equal gain feels good3. That is why the investors in Morningstar’s study gave up part of the return their funds earned29.
Three households, three different answers
Meera and Rohan, both 34, in Pune, have ₹40 lakh in equity mutual funds, two steady salaries, six months of spending in a bank deposit and about 25 years before they plan to stop working. Their capacity is high. A 57% fall, the size of the S&P 500’s in 2007–09 (MSCI World fell 57.8% and the Sensex about 61%), would cut their ₹40 lakh to about ₹17.2 lakh on paper21012. With 60% in shares and 40% in something that held its value, the same fall would leave about ₹26.3 lakh, a fall of about 34%. The question for them is tolerance: whether they would keep their SIPs going while the statement showed half the money gone.
Owen, 58, an engineer in Leeds, has £300,000 in a workplace pension he plans to start drawing on in two years. His capacity is lower, not because he is nervous but because of timing. A 34% fall like early 2020 would take it to £198,000 just before he starts withdrawing, and selling to fund spending in a fall locks the loss in2. This is sequence risk: the same average return does more damage when the bad years come first. Sequence of returns risk works through it, and the bucket strategy shows one way of holding the next few years’ spending apart.
Karen and Dev, 45, in Toronto, will need C$60,000 for their daughter’s university fees in three years. Even if they are comfortable with risk, the money has no capacity for it: a 20% fall in shares took two years on average to recover between 1988 and 2025, and the worst took far longer2. Money with a date on it inside five years belongs in deposits or short-term bonds, whatever the household’s long-term mix.
Managing risk without avoiding it
Hold an emergency fund in cash first. ASIC’s Moneysmart suggests three months of expenses as a good target33, so a job loss never forces a sale in a falling market (emergency fund: how much).
Give each pot of money a date. Spending due within about five years sits in cash or short-term bonds; money for 15 years or more can sit mainly in shares.
Spread shares across countries and companies, not one market or a handful of stocks (home bias and currency risk).
Choose a mix you can hold through a 50% fall in shares — the S&P 500 fell 57% in 2007–092 — and write it down while markets are calm (asset allocation by age).
Rebalance back to that mix once a year or when it drifts far, which means selling some of what rose and buying what fell.
What is the difference between risk and volatility?
Volatility is how much a value swings; the S&P 500’s yearly returns from 1928 to 2025 had a standard deviation of about 19.4 points1. Risk in the sense that matters is permanent loss, which usually happens when somebody has to sell during a fall, or when a market stays down for decades, as Japan’s did from 1989 to 20245.
How long does the stock market take to recover from a crash?
It has ranged from months to decades. The S&P 500 regained its February 2020 peak by August 20208 and its January 2022 peak in January 20249; after 2007–09, with dividends reinvested, it was back above its 2007 level by the end of 20121. Japan’s Nikkei 225 took 34 years and 2 months5.
Can you lose money in the stock market over 20 years?
In US shares with dividends reinvested, none of the 79 twenty-year periods from 1928 to 2025 lost money in nominal terms1. Other markets and inflation-adjusted figures are less kind: Japan’s index stayed below its 1989 peak for over 34 years5.
What is the equity risk premium today?
Aswath Damodaran’s estimate of the premium priced into US shares was 4.20% on 1 October 202618, down from 5.94% at the start of 202317. Historically, US shares compounded about 6.65 points a year above Treasury bills from 1928 to 20251.
What is a real return?
The return after inflation, and after tax where tax applies20. US shares returned 9.8% a year from 1900 to 2025 before inflation and 6.6% after it; Treasury bills 3.4% and 0.5%16.
What is the difference between risk tolerance and risk capacity?
Tolerance is how much risk you are willing to take; capacity is how much loss you can absorb without harming your standard of living, which the UK regulator asks advisers to assess separately31. A young saver with a secure job usually has high capacity, whatever their nerves say.
Do bonds always protect a portfolio when shares fall?
No. In 2008 ten-year US Treasuries gained 20.10% while shares lost 36.55%, but in 2022 both lost about 18%1. A mix of the two has still fallen far less than shares alone in most bad years; since 1900 a 60:40 blend has never fallen more than 50% in real terms16.
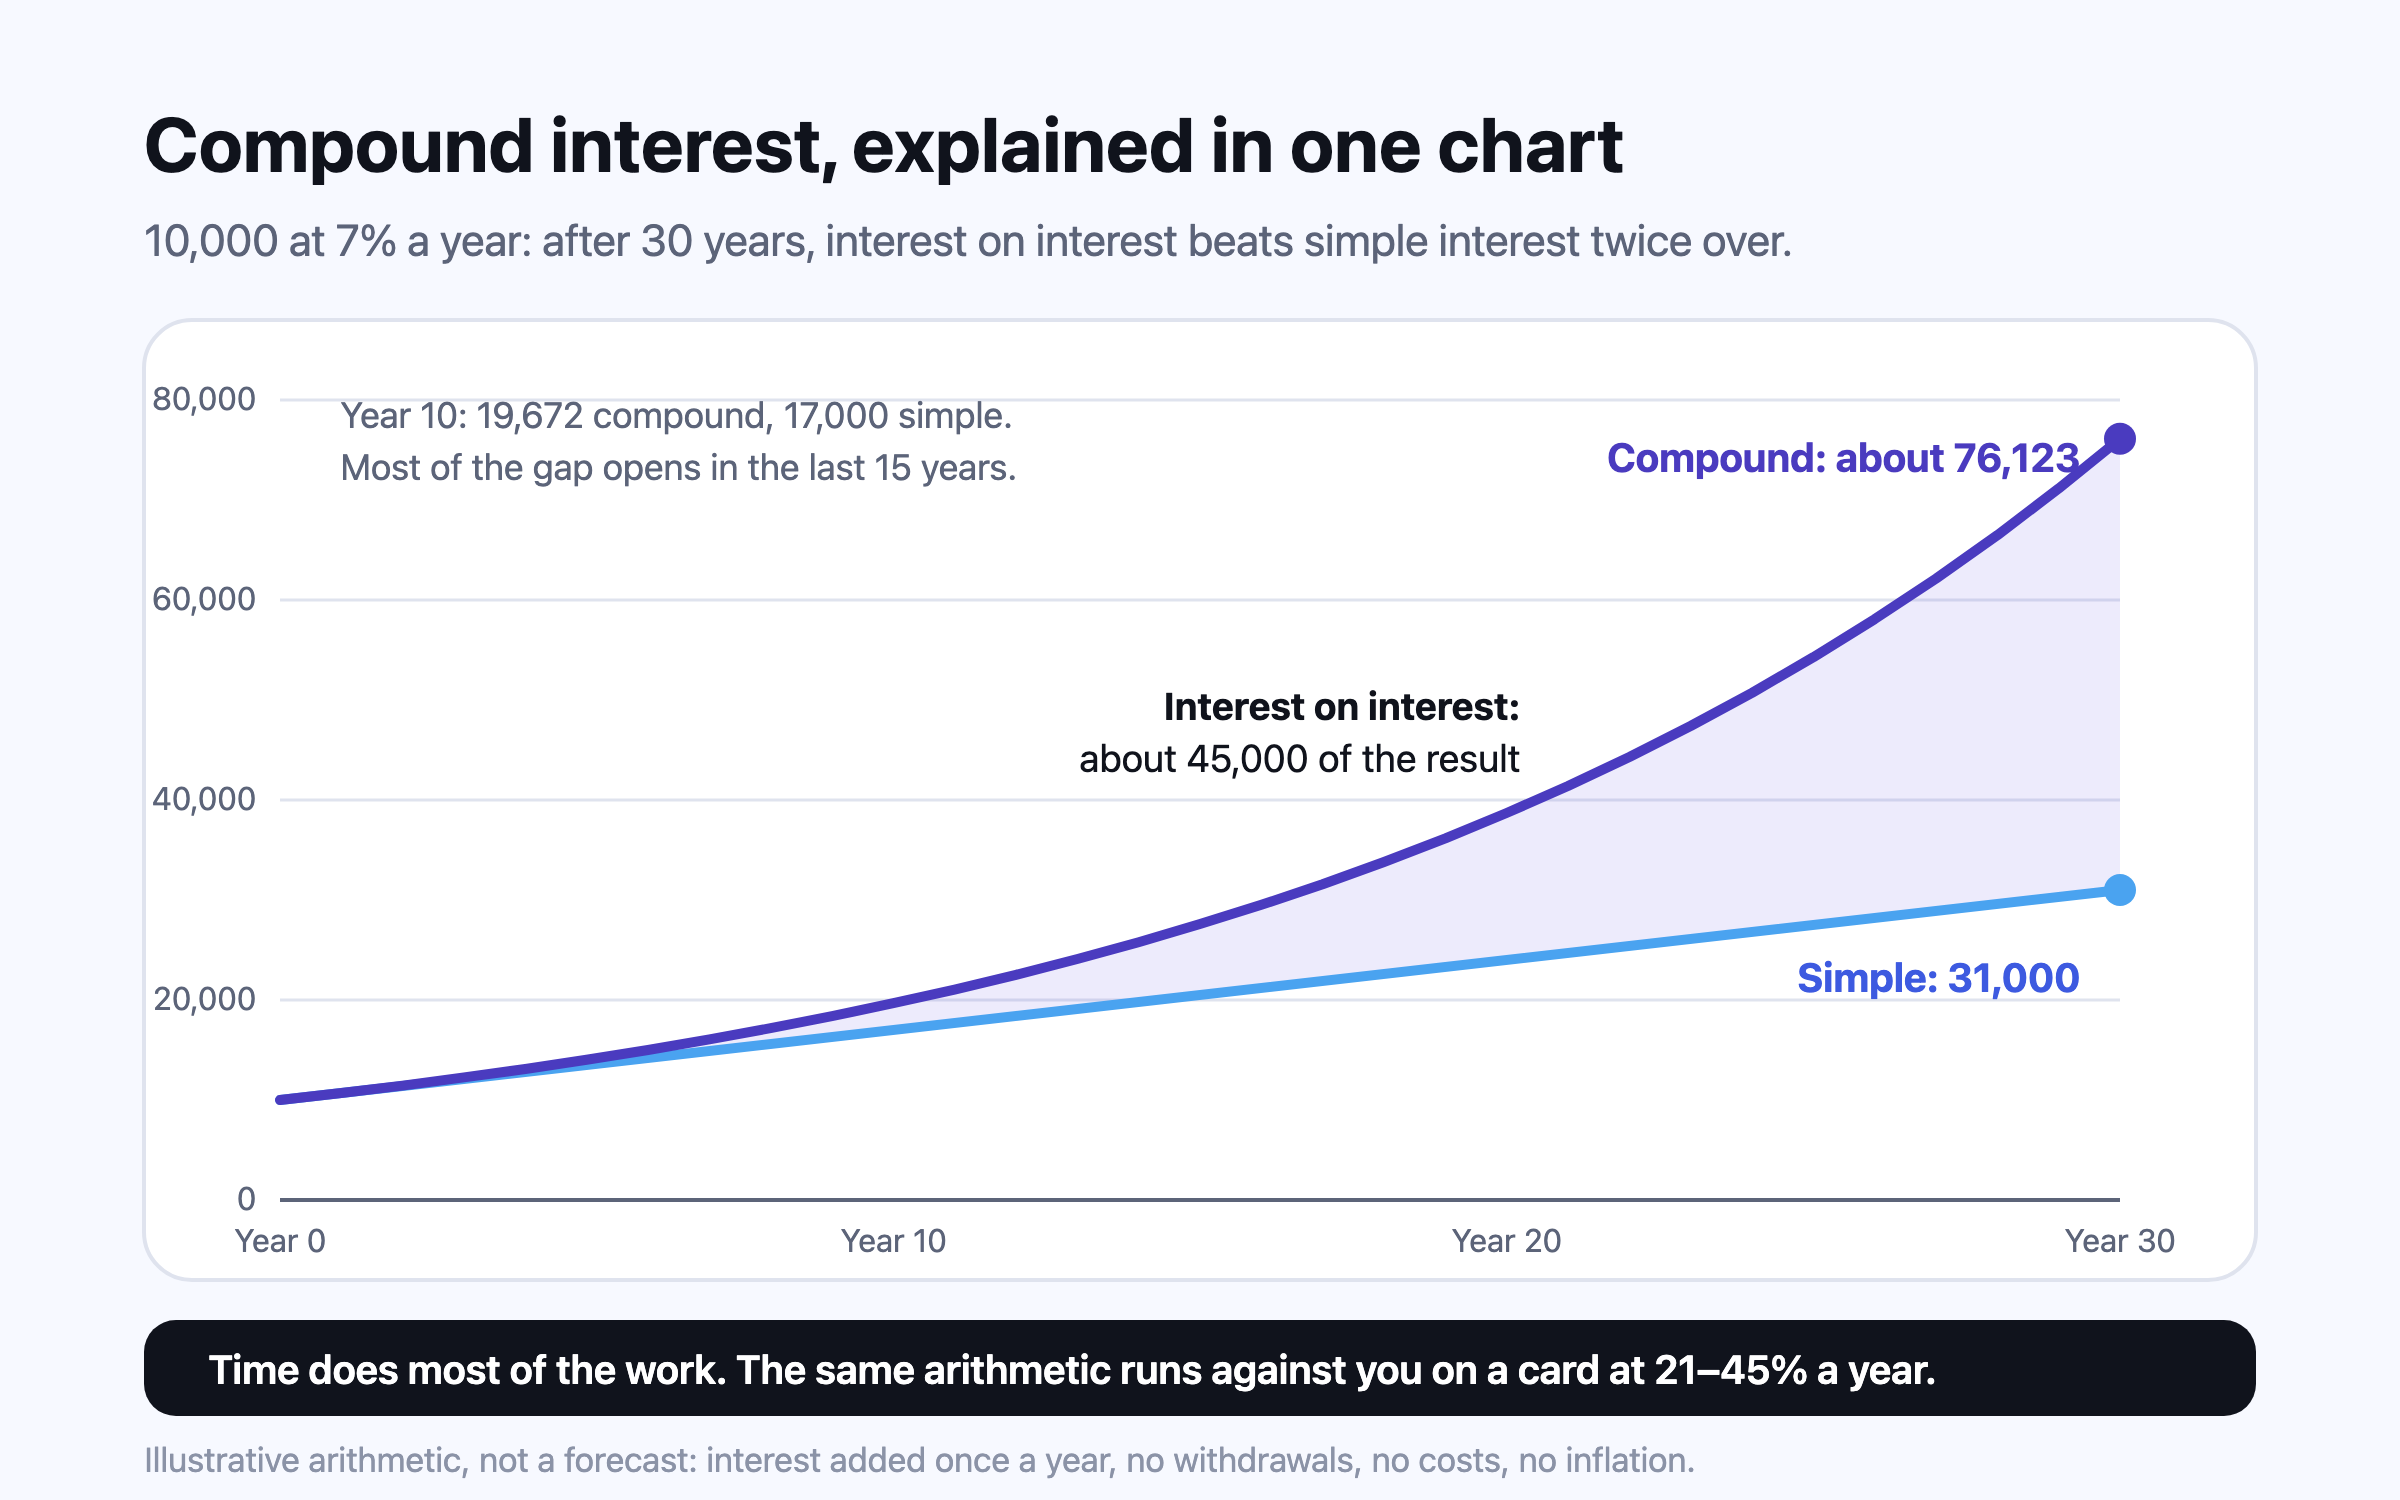
Compound interest is growth on growth: 10,000 at 7% a year becomes about 76,000 in 30 years, against 31,000 if only the original sum earned interest. The rule of 72 estimates doubling time well between about 4% and 12%. Fees and inflation slow compounding, and the same arithmetic on a card charging 21–45% a year doubles a debt in roughly one and a half to three and a half years.
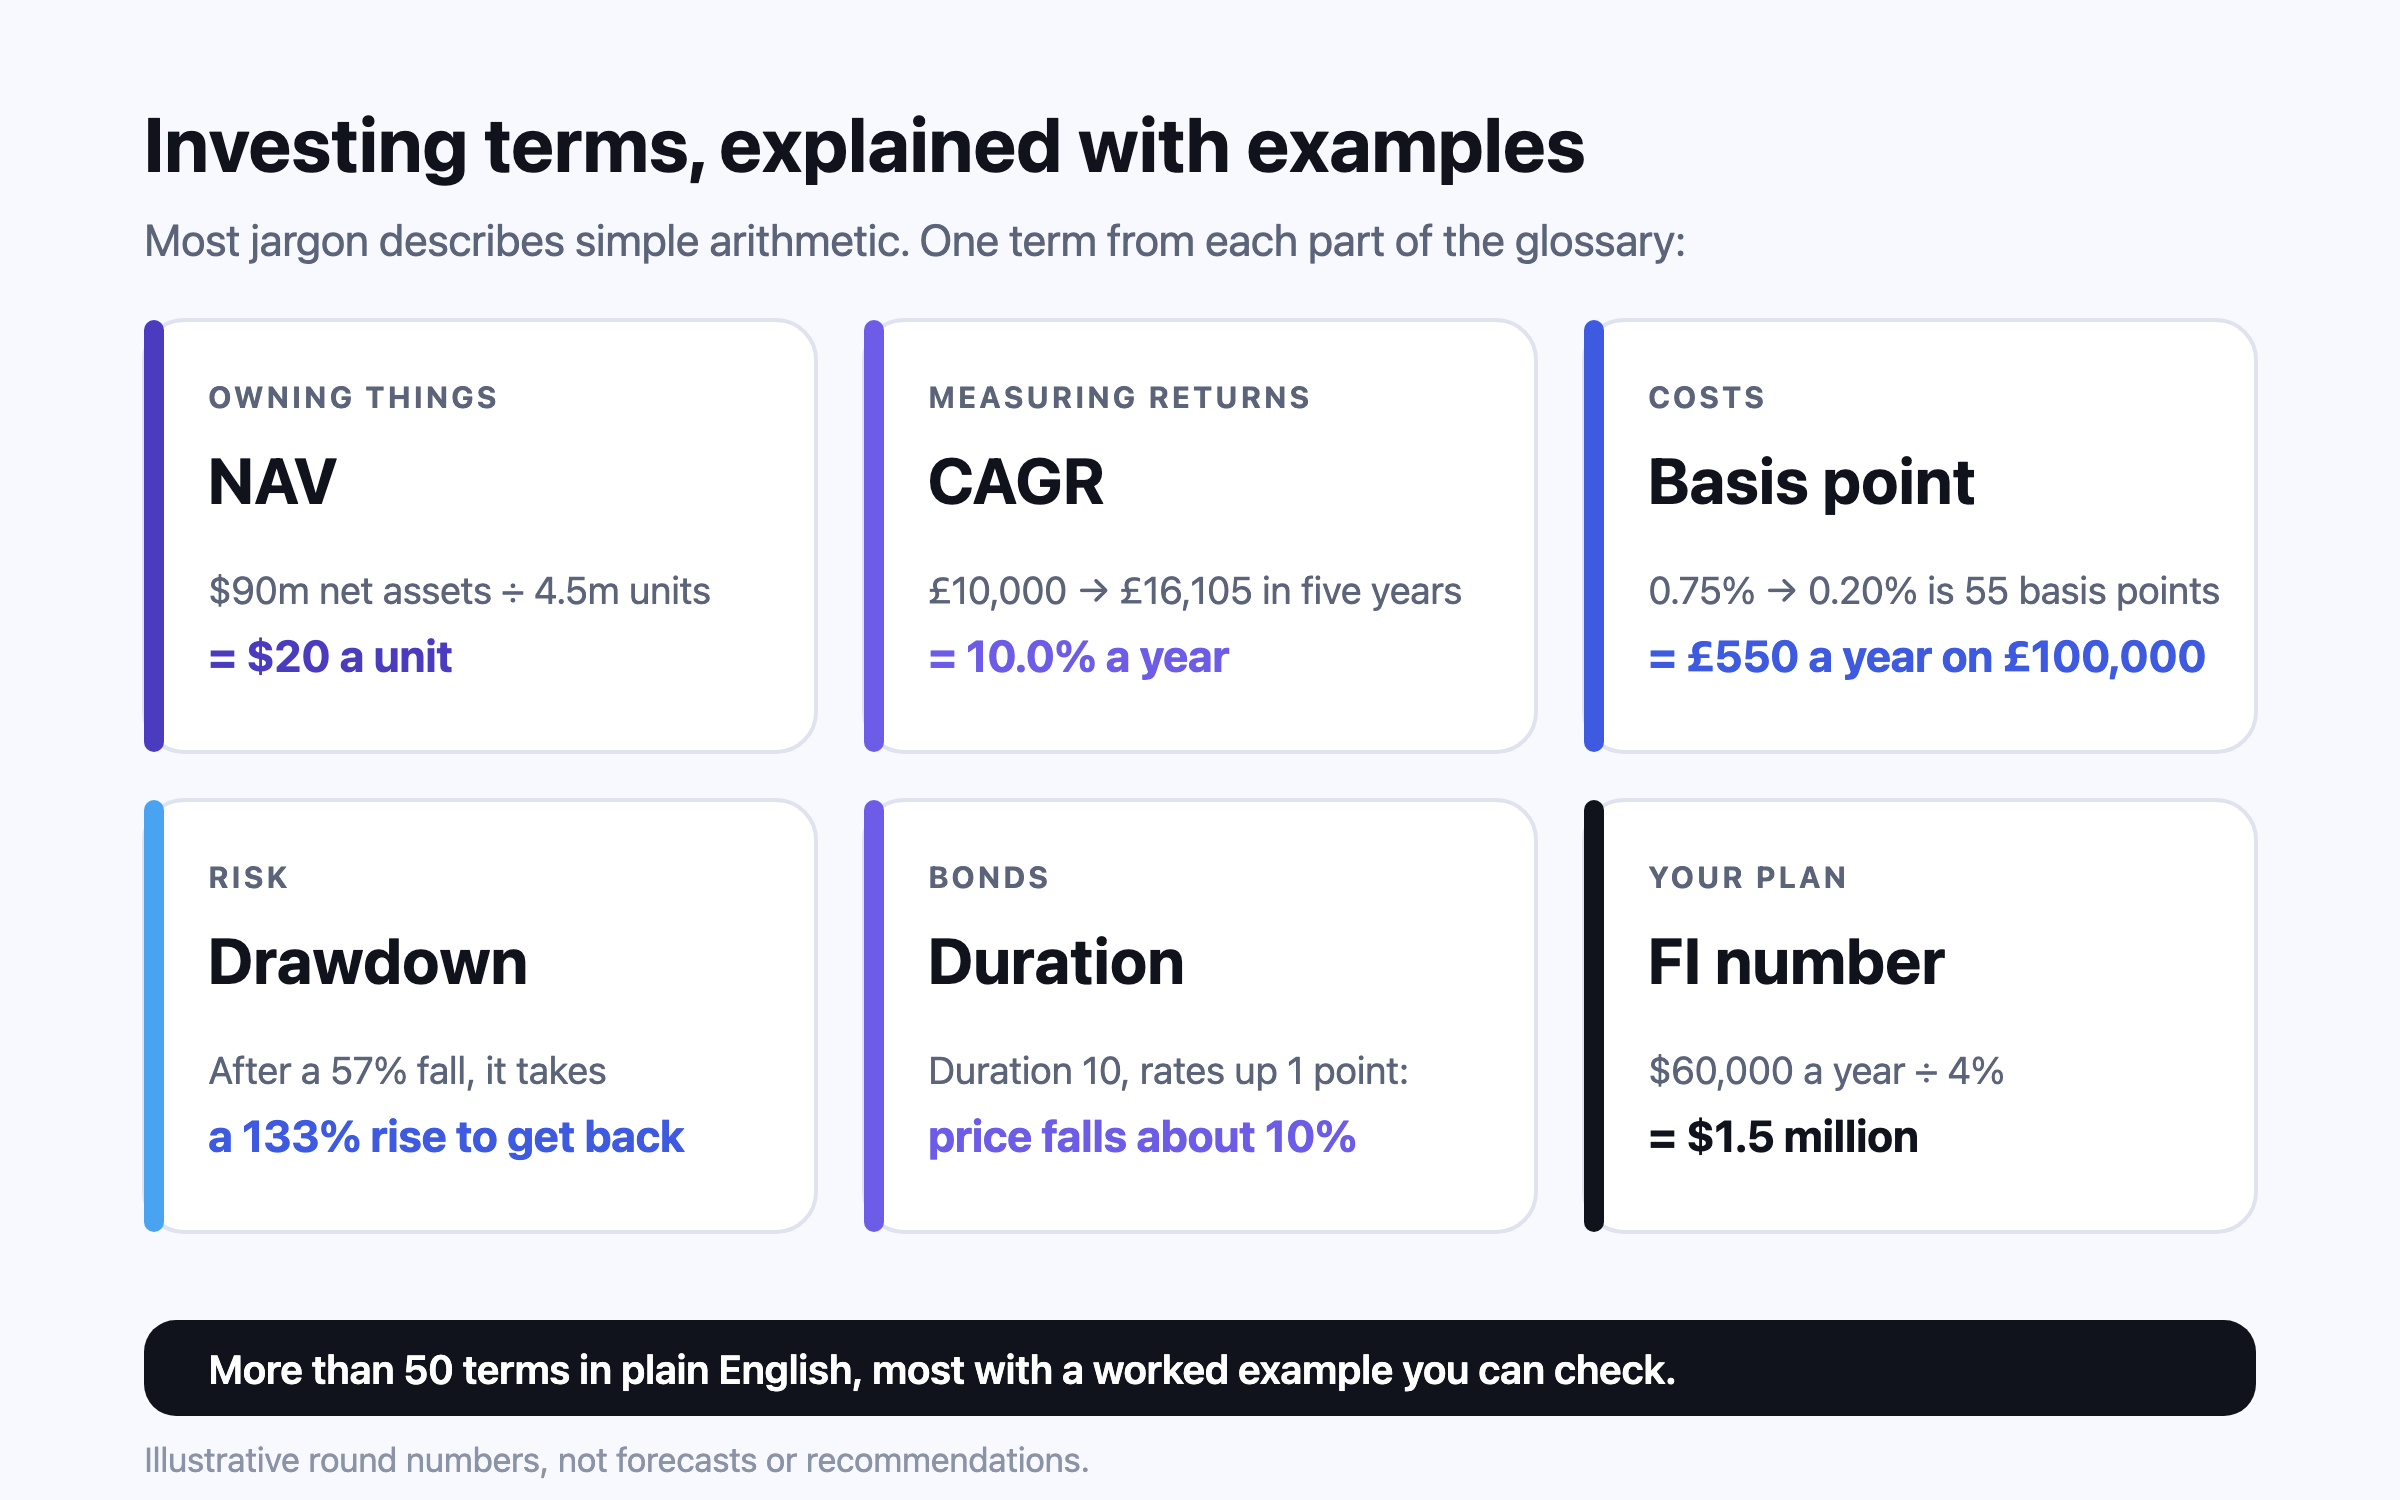
Most investing jargon describes something simple. A basis point is a hundredth of a percentage point; NAV is what one unit of a fund is worth; XIRR is your real yearly return when money went in at different times; duration says how far a bond falls when rates rise. This glossary gives each term a short definition, from a regulator or the original source where one exists, and most of them a worked example you can check.
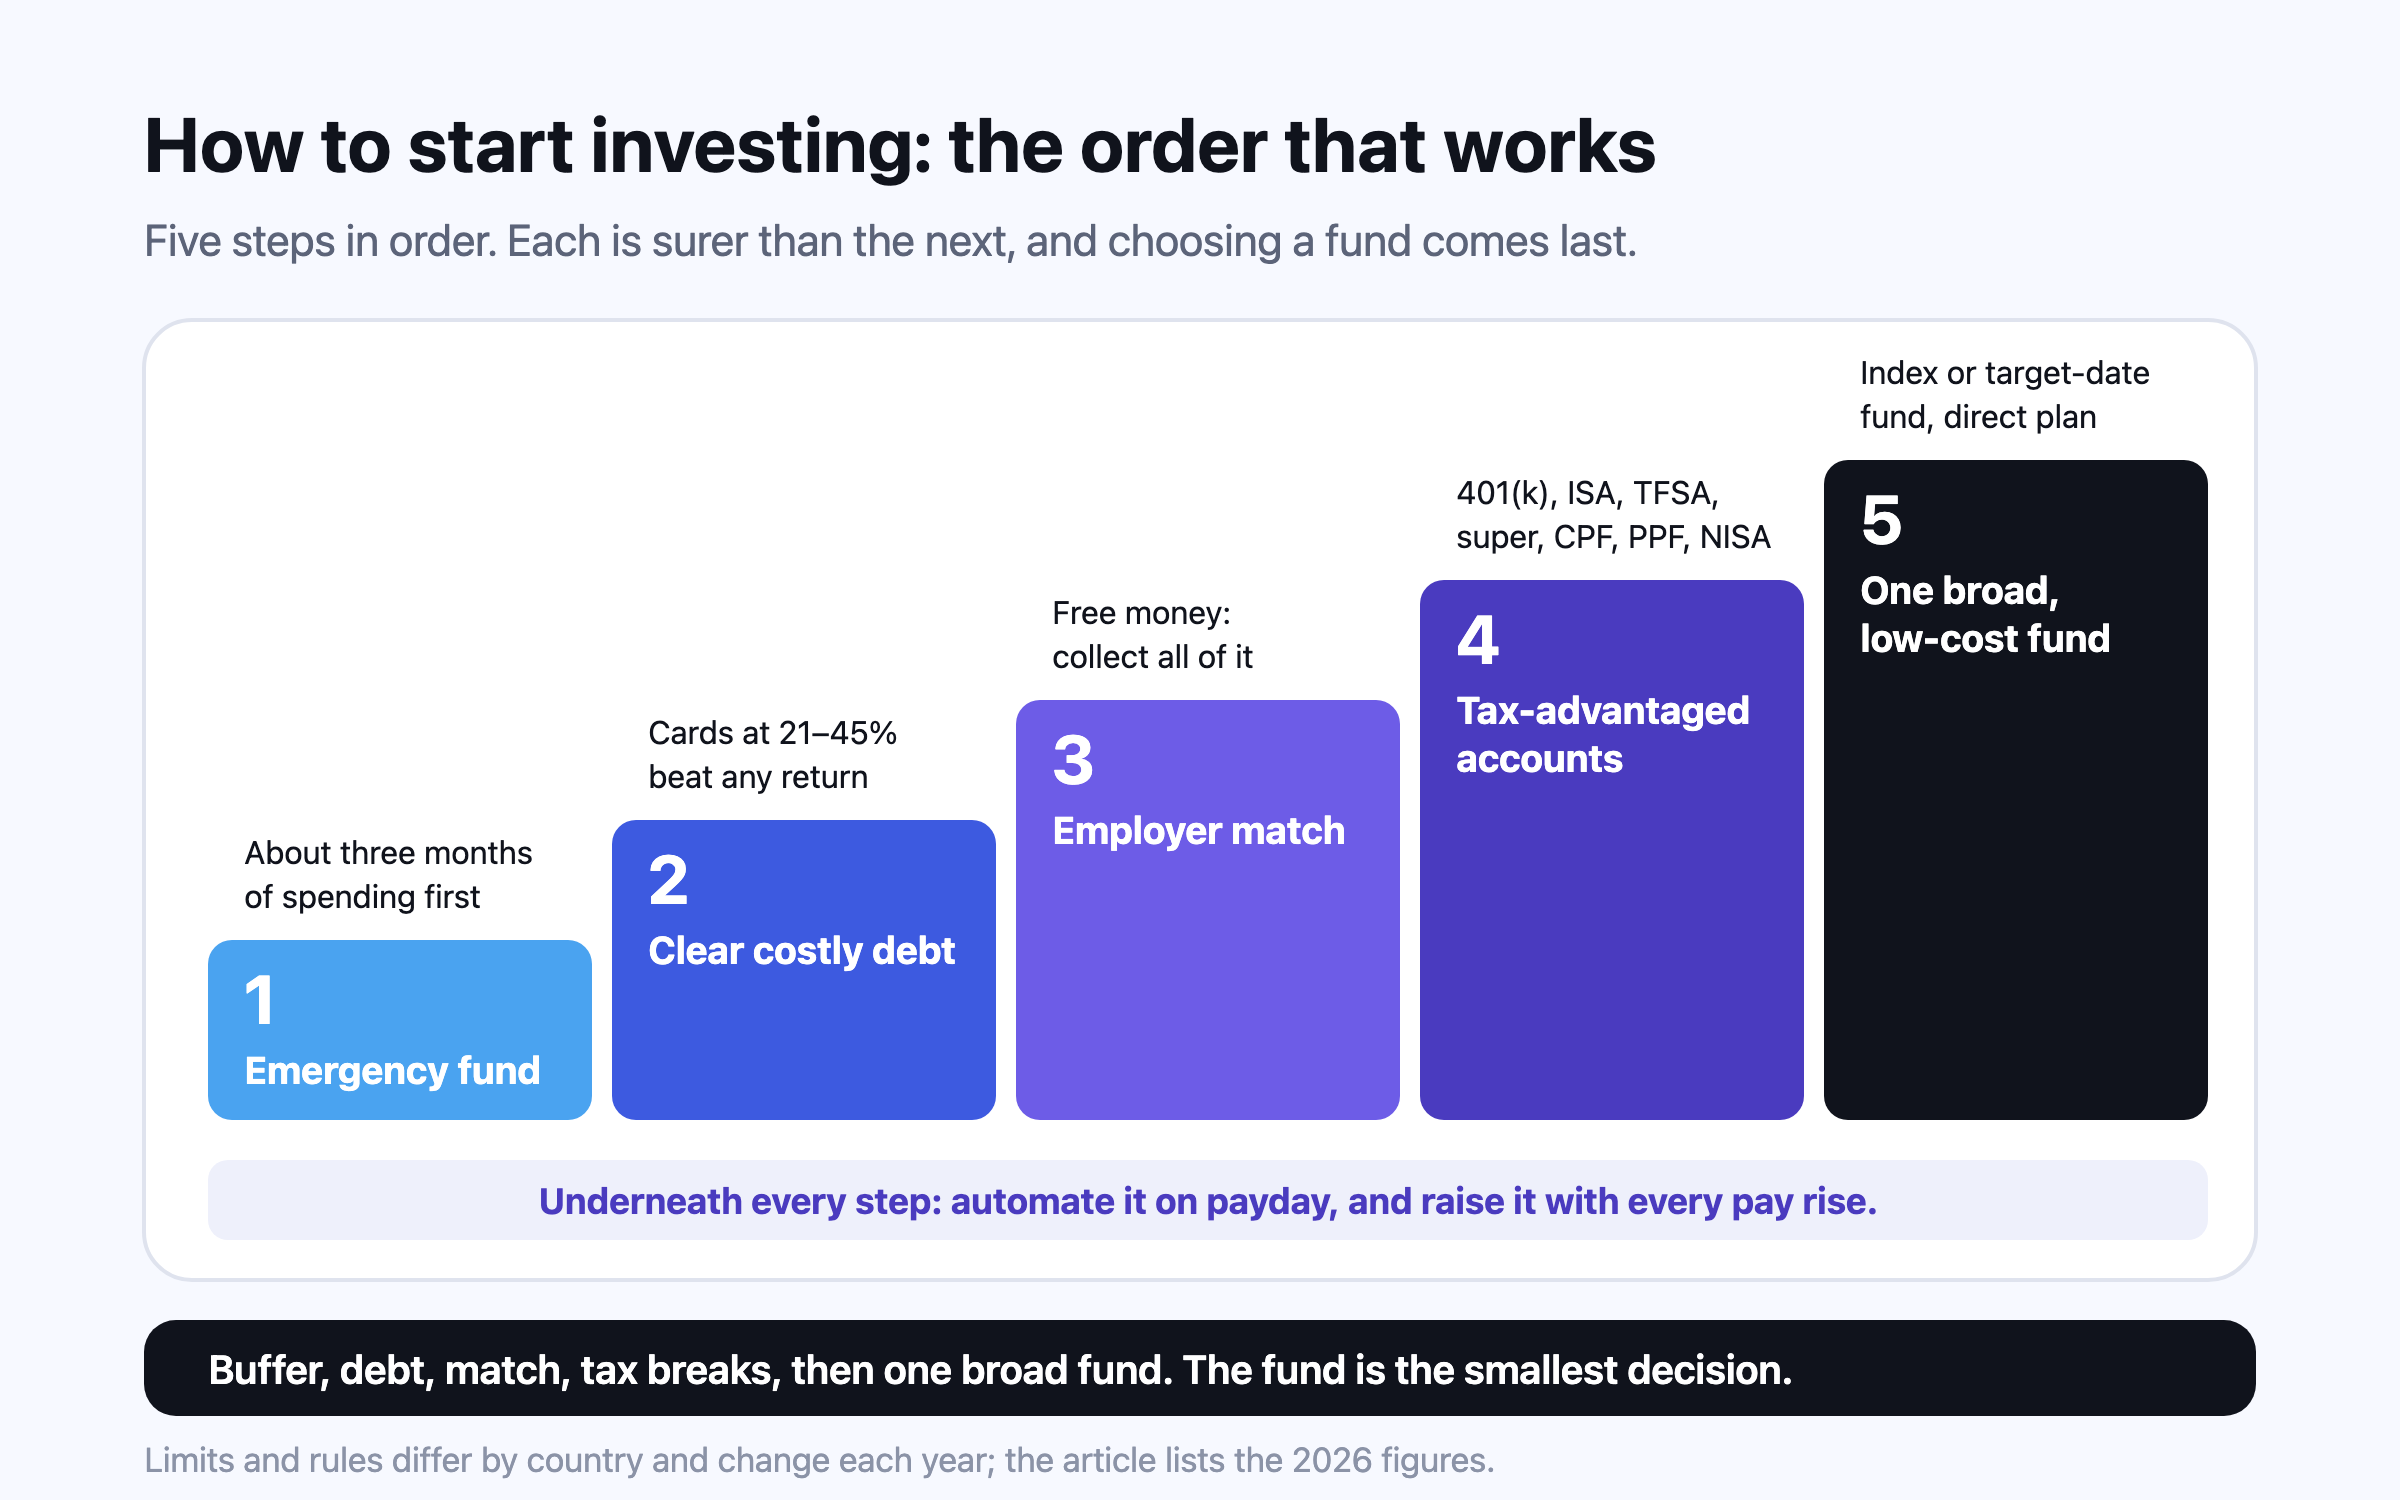
The order matters more than the product: an emergency fund first, then any debt costing more than investments can earn, then free money from an employer and the tax breaks your country offers, then a broad, low-cost index fund. In 2026 that means, for example, up to $24,500 in a US 401(k), £20,000 in a UK ISA, C$7,000 in a TFSA and a 12% employer super contribution in Australia. Automating it does more than picking the perfect fund.
This is general information, not financial, tax or legal advice for your circumstances. Rules and figures change; check the official source for your country, and consult a licensed professional before making financial decisions. Projections are estimates, not predictions.