More than fifty investing terms in plain English, most with a worked example — from NAV and expense ratio to XIRR, duration and your FI number.
Most investing jargon describes something simple. A basis point is a hundredth of a percentage point; NAV is what one unit of a fund is worth; XIRR is your real yearly return when money went in at different times; duration says how far a bond falls when rates rise. This glossary gives each term a short definition, from a regulator or the original source where one exists, and most of them a worked example you can check.
Nivritee Research · 6 October 2026 · 17 min read
Investing has more vocabulary than ideas. Most of the words below describe something you could explain to a teenager, and the ones that sound hardest — duration, XIRR, tracking error — turn out to answer questions people ask anyway: how far will this fall, what did I really earn, does this fund do what it says? Each entry gives a short definition, taken where possible from a regulator’s own glossary, and most give a worked example with round numbers you can check. The examples are illustrations, not forecasts or recommendations.
The terms are grouped as a beginner meets them: what you can own, how returns are measured, what it costs, what risk means, how bonds work, how you invest, and the handful of figures that describe your own plan. This is part of the investing basics series; how the stock market works is the place to start if you are new to all of it.
Owning things: shares, bonds and funds
Asset
Anything of value you own: a bank account, a home and shares are all assets1. Example: Matt, a pharmacist in Leeds, owns a house worth £310,000, a pension worth £84,000 and £12,000 in savings — £406,000 of assets in all.
Liability
Money you owe, usually with interest: loans, mortgages and bonds you have issued are all liabilities2. Example: Matt still owes £165,000 on his mortgage and £9,000 on a car loan, so his liabilities are £174,000.
Share, stock or equity
A share is part-ownership of a company and a claim on its assets and profits; “stock” and “equity” mean the same thing, and most shares carry a vote3. Example: own 100 of a company’s 10 million shares and you own 0.001% of it, with 0.001% of every dividend it pays.
Bond
A loan you make to a government or company, which promises to pay interest for a set period and repay the face value when the bond matures4. Example: a bond with a face value of $1,000 and a 4.5% coupon pays $45 a year, usually as two payments of $22.505. Bonds explained covers them in full.
Mutual fund
A pool of many investors’ money, managed as one portfolio, in which each unit is a share of everything the fund owns6. The UK calls the same structure a unit trust or OEIC, and Australia a managed fund. Example: invest ₹10,000 in a fund whose units are priced at ₹50 and you receive 200 units. See mutual funds explained.
ETF (exchange-traded fund)
A fund that pools money like a mutual fund but whose units trade on a stock exchange through the day, at whatever price buyers and sellers agree7. Example: buy 10 units at £85.40 and you pay £854, plus any dealing charge. See ETFs explained.
Index
A measure of how a defined basket of shares or bonds has moved, used to stand for a market; the Dow Jones Industrial Average, for instance, follows 30 large US companies8. Others you will meet are the S&P 500, FTSE 100, S&P/TSX Composite, S&P/ASX 200, Straits Times Index and Nifty 50. Example: if the Nifty 50 rises from 24,000 to 24,600, it has risen 2.5%.
Index fund (passive fund)
A mutual fund or ETF designed to match the return of an index before fees, by holding the shares or bonds in it rather than choosing among them9. Example: if its index returns 10.0% in a year and the fund costs 0.10% a year, the fund should return about 9.9%. The evidence on how index funds compare with active ones is in index vs active funds.
Active fund
A fund whose manager picks investments to try to beat a benchmark index, rather than copy it10. It usually costs more than an index fund, and its result depends on the manager’s choices, which can go either way.
NAV (net asset value)
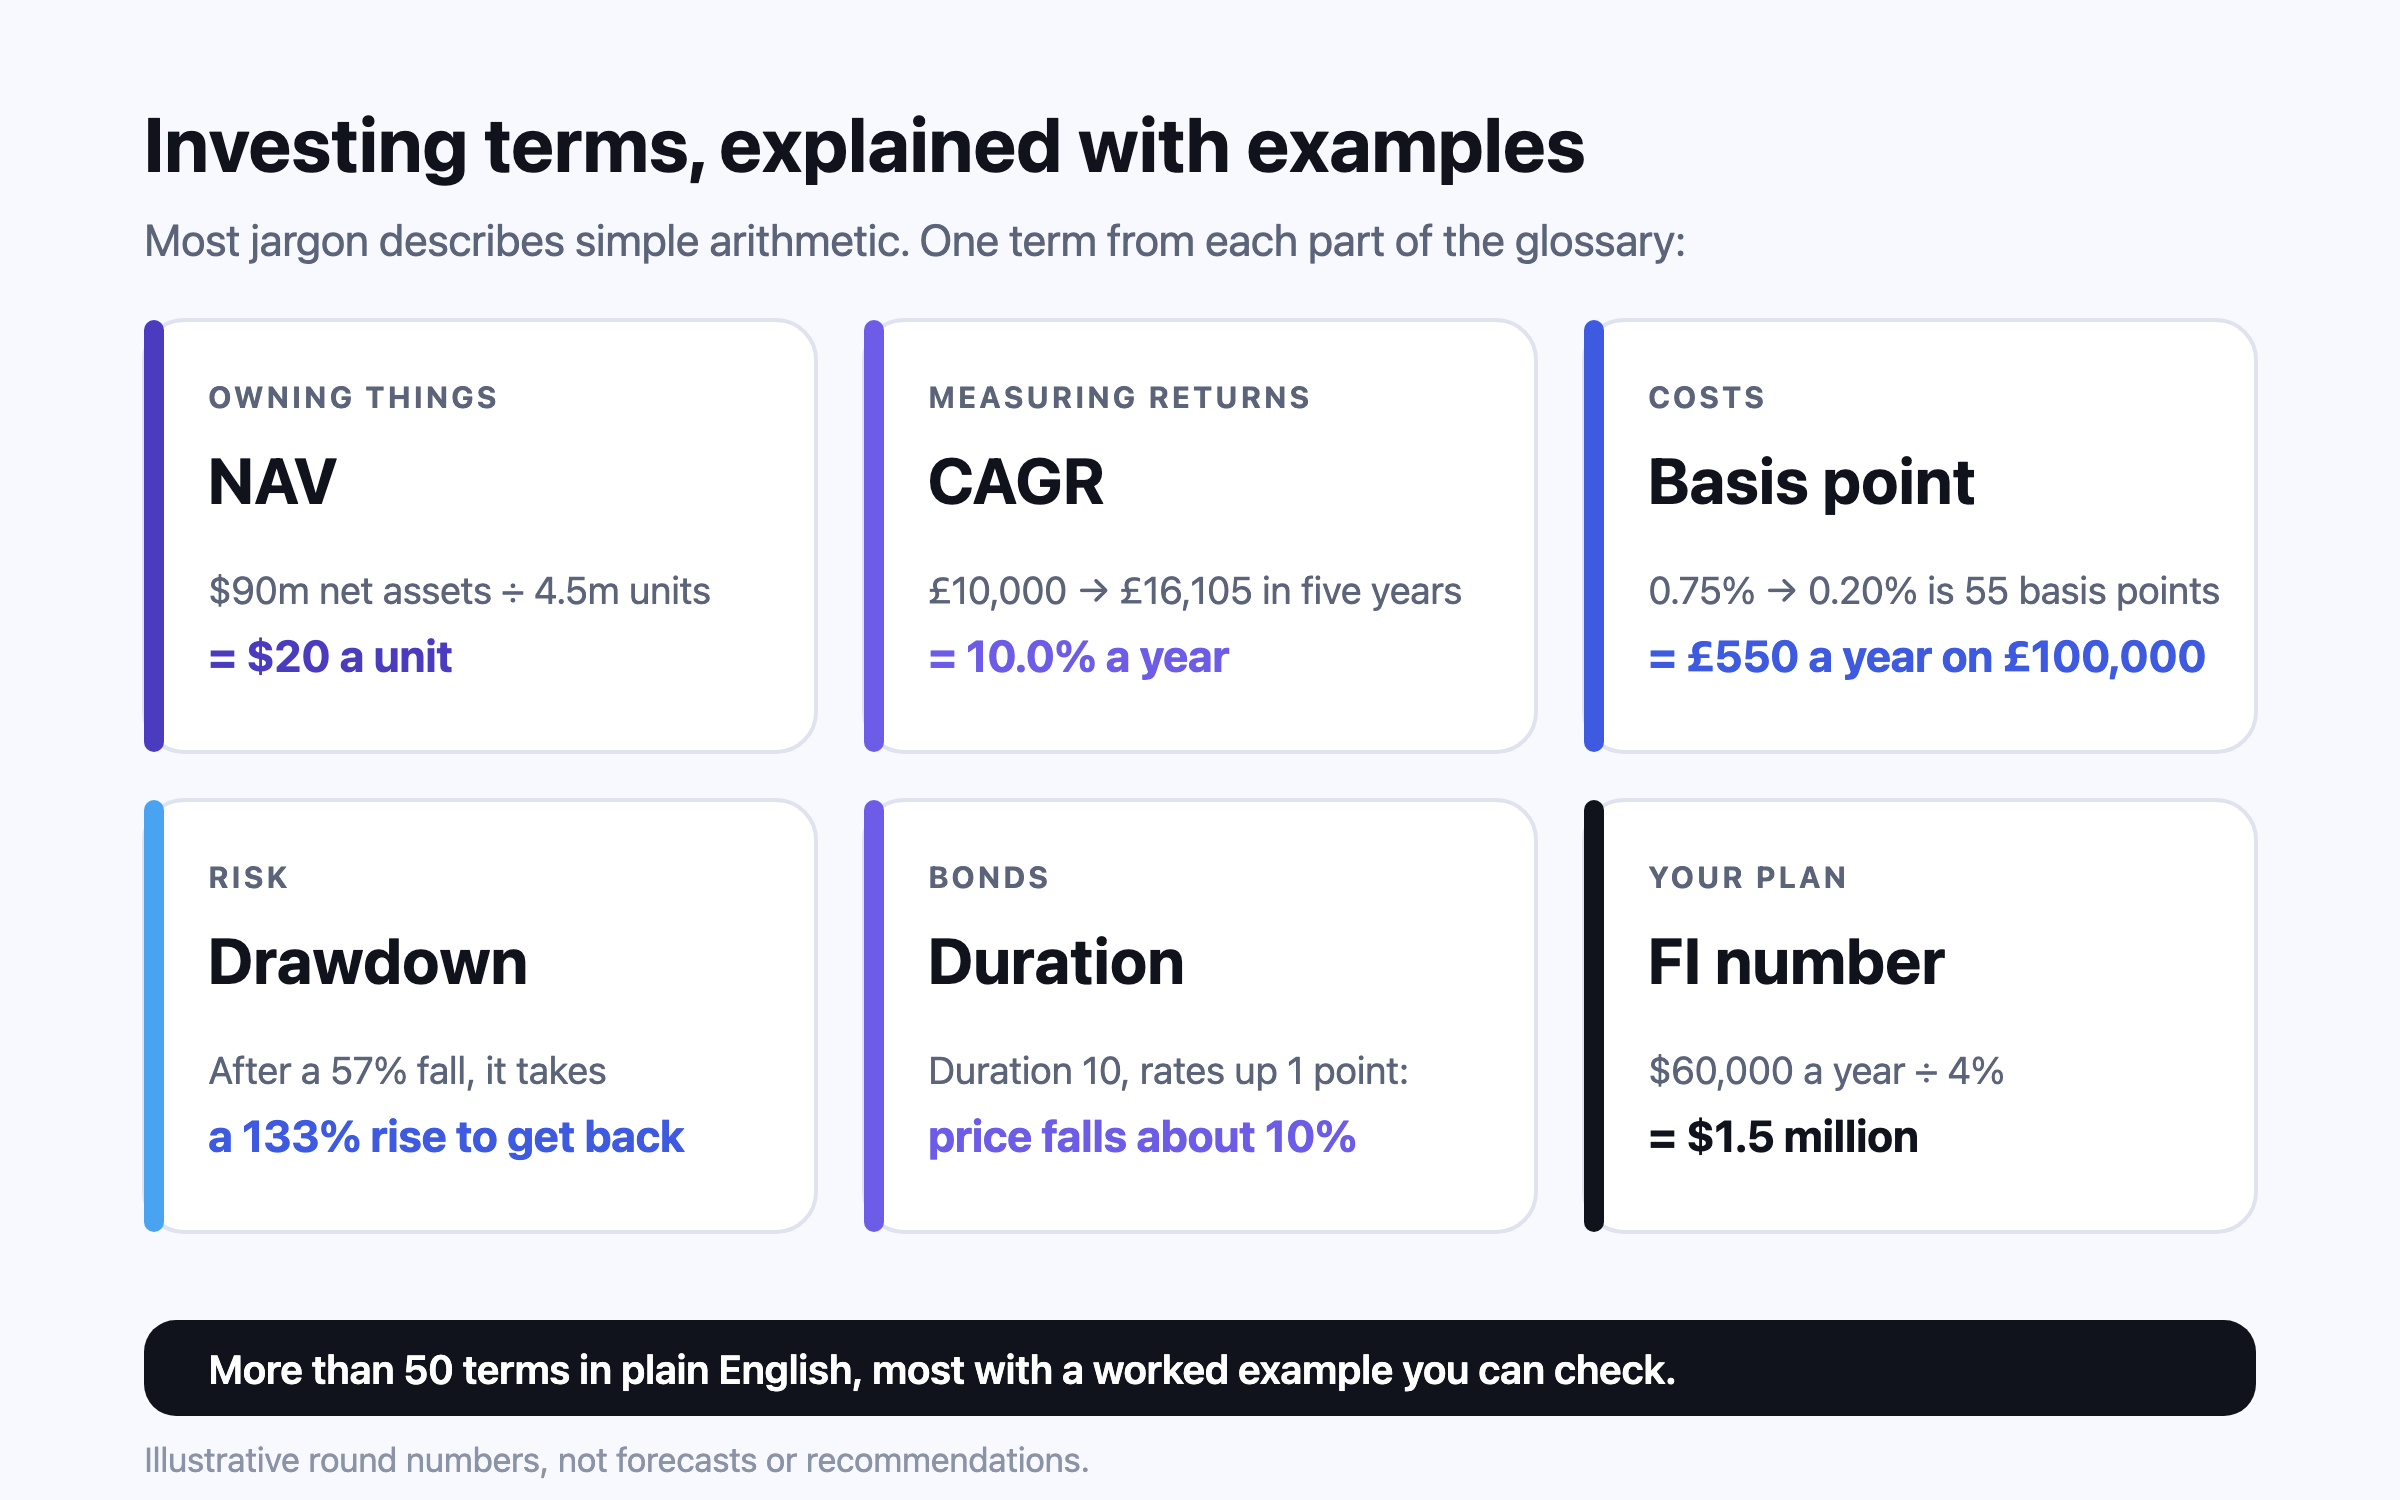
A fund’s total assets minus its liabilities; divided by the number of units, it is the price of one unit, worked out at least once every business day for a mutual fund11. Example, using the SEC’s own figures: a fund with $100 million of assets and $10 million of liabilities has a NAV of $90 million11. With 4.5 million units in issue, each is worth $20. A low NAV does not make a fund cheap; it only means each unit is a smaller slice.
AUM (assets under management)
The total value of money a fund, or a fund company, manages for investors. Example: India’s mutual fund industry managed an average of ₹88.31 lakh crore (₹88,30,776 crore) in August 2026, according to AMFI12. A single fund with ₹20,000 crore of assets and an expense ratio of 0.50% collects about ₹100 crore a year to run it.
Market capitalisation (market cap)
What a company is worth on the stock market: the share price times the number of shares13. Example: a share at ₹1,200 with 50 crore shares in issue gives a market cap of ₹60,000 crore. In India, SEBI defines large caps as the 100 biggest listed companies by full market capitalisation, mid caps as the 101st to 250th, and small caps as everything below14.
Portfolio
Everything you hold as investments, taken together15. Example: ₹5 lakh in an index fund, ₹2 lakh in a PPF account and ₹1 lakh in gold make an ₹8 lakh portfolio, 62.5% of it in shares.
Money market fund, REIT and target-date fund
A money market fund holds short-term, high-quality debt and cash, and pays roughly what short-term interest rates pay16. A REIT (real estate investment trust) owns and runs income-producing property — offices, warehouses, flats — and lets you own a slice through a share17. A target-date fund holds a mix of shares and bonds that shifts towards bonds automatically as its target year approaches, so the manager makes the allocation and rebalancing decisions18.
Measuring returns
Compounding
Earning a return on past returns as well as on the original sum19. Example: S$10,000 at 4% a year becomes about S$14,802 in ten years if the interest is left in, against S$14,000 if it is paid out each year. Compound interest explained works through it.
CAGR (compound annual growth rate)
An annual return is the profit or loss over one year20; CAGR is the single steady yearly rate that would turn a starting value into an ending value over several years, which makes it the fair way to state a multi-year return. Example: £10,000 that becomes £16,105 in five years has a CAGR of 10.0%. A simple average can mislead: a fund that rises 50% then falls 50% has an average return of 0% but has lost 25% of your money, a CAGR of about −13.4% a year.
XIRR
The one yearly rate that, applied to each amount you put in from the date you put it in, arrives at what your investments are worth today — the right measure when money went in at different times, as with a SIP21. Example: ₹50,000 invested two years ago and ₹50,000 one year ago, worth ₹1,15,500 today, is a gain of only 15.5% but an XIRR of 10% a year, because half the money has had only one year21.
Total return and price return
Price return counts only the change in price; total return adds the dividends or interest received. Example: a share bought at A$40, now A$42, that paid A$1.60 in dividends has a price return of 5% and a total return of 9%. Over decades the difference is large: the FTSE 100’s price index took until February 2015 to pass its end-1999 level, but its total-return index had done so by February 200622.
Dividend and dividend yield
A dividend is a share of a company’s profit paid to shareholders, usually on a fixed schedule23. Dividend yield is a year’s dividends divided by the share price. Example: a share at $80 paying $2.40 a year yields 3%.
Ex-dividend date
The cut-off for who receives a declared dividend: buy on or after the ex-dividend date and the seller, not you, gets it. It is set from the company’s record date under exchange rules: in the US it is usually the record date itself, or the business day before if the record date is not a business day24. The share price typically drops by about the dividend on that morning, so buying just before it gains nothing.
Accumulation and income units
Many funds come in two versions with the same portfolio: one that reinvests dividends and interest inside the fund (accumulation units in the UK, the growth option in India), and one that pays them out to you (income or distribution units). The reinvesting version keeps compounding without any action on your part; the paying-out version suits somebody who lives on the income.
Capital gain
The profit when an investment is sold for more than it cost25. Example: 50 shares bought at ₹800 and sold at ₹1,000 make a gain of ₹200 a share, ₹10,000 in all, or 25%. How it is taxed depends on the country, the account it was held in and how long it was held; how to start investing covers the tax-advantaged accounts.
Benchmark
The index a fund is measured against; an active fund tries to beat it and an index fund tries to match it10. Example: a fund that returned 11% in a year when its benchmark returned 12% underperformed by one percentage point, whatever its own advertising says about an 11% return.
Nominal and real return
A nominal return is the percentage your money grew; a real return is what is left after inflation and, where they apply, taxes26. Example: a 7% return in a year when prices rose 3% is a real return of about 3.9%, because 1.07 ÷ 1.03 is 1.0388.
Inflation
The rate at which prices rise, usually measured by a consumer price index — the cost of a fixed basket of goods and services compared with a year earlier. The Bank of England’s own example: with 2% inflation, a basket that cost £100 a year ago costs £102 today27. Over time it compounds: at 3% a year for 20 years, 100 buys what about 55.37 buys today. Inflation is not one number explains why your own rate may differ.
Equity risk premium
The extra return investors expect, or have received, for owning shares rather than a safe asset such as a Treasury bill. Example: from 1928 to 2025 the S&P 500 compounded about 6.65 percentage points a year more than three-month US Treasury bills28. See risk and return explained.
Costs
Basis point
One hundredth of a percentage point, so 8% is 800 basis points29. Fees and rate changes are quoted in them because the numbers are small. Example: cutting a yearly charge from 0.75% to 0.20% saves 55 basis points, which on £100,000 is £550 a year.
Expense ratio (TER, OCF, MER)
The share of a fund’s assets taken each year to pay its running costs, including the manager’s fee30. India calls it the total expense ratio (TER), the UK the ongoing charges figure (OCF) and Canada the management expense ratio (MER). It is deducted inside the fund, so it never appears on a bill. Example: $25,000 in a fund with an expense ratio of 0.40% costs about $100 a year at that balance. What fees cost over 30 years shows how it compounds.
Load (entry or exit charge)
A sales charge taken when you buy (front-end) or sell (back-end) units in a fund, much like a commission31. Example: a 5% front-end load on $10,000 means $9,500 is actually invested.
Direct and regular plans
In India every mutual fund scheme has had to offer a direct plan, bought without a distributor, since 1 January 2013; it holds the same portfolio as the regular plan but has a lower expense ratio and a separate NAV, because no commission is paid from it32.
Tracking error and tracking difference
How closely an index fund follows its index. Tracking difference is the gap between the fund’s return and the index’s over a period; tracking error is how much that gap varies, measured by SEBI as the annualised standard deviation of the difference in daily returns, which may not exceed 2% for an Indian equity index fund or ETF33. Example: if the index returns 12.0% in a year and the fund 11.7%, the tracking difference is 0.3 points, mostly the fund’s costs.
Platform fee
A charge for holding investments on a platform or with a broker, on top of the funds’ own costs. They vary widely: in its 2019 market study the UK regulator found the yearly charge on £5,000 in a stocks and shares ISA ranged from 0.20% to 2.40% depending on the platform34.
Risk
Risk
Uncertainty about what an investment will return, and the harm if it returns less than you expected; investors generally demand higher returns for taking more of it35.
Volatility (standard deviation)
How much returns swing around their average, usually measured as the standard deviation; William Sharpe’s risk-adjusted measure uses it as the yardstick of risk36. Example: the S&P 500’s yearly returns from 1928 to 2025 had a standard deviation of about 19.4 points28. If returns averaged 10% with a standard deviation of 20 points and followed a normal curve, about two years in three would land between −10% and +30%; real markets produce extreme years more often than that curve suggests.
Drawdown
The fall from a peak to the lowest point before a new peak. Example: the S&P 500 fell 57% from October 2007 to March 200937. Recovering from a fall needs a larger rise than the fall itself: after losing 57%, what is left must rise about 133% to get back to the start.
Bear market and bull market
A bear market is generally a fall of 20% or more in a broad index over at least two months; a bull market is a rise of 20% or more3839. Example: the S&P 500’s 25% fall from January to October 2022 was a bear market; its rise from 3,577 in October 2022 to 7,652 at the end of September 2026, about 114%, was a bull market37.
Diversification and correlation
Diversification is spreading money across investments that do not all fall at once40; correlation measures how far two investments move together. Example: since 1900 shares and bonds have each lost more than 70% in real terms on several occasions, yet a 60:40 mix of the two never fell more than 50%41. The protection is not constant: in 2008 US shares fell 36.55% while ten-year Treasuries rose 20.10%, but in 2022 both fell about 18%28.
Liquidity
How quickly and cheaply you can turn an investment into cash without moving its price42. Example: units of a large listed fund can usually be sold within a day or two, a flat can take months, and a PPF account runs for 15 years, with only limited withdrawals before then43.
Risk tolerance and capacity for loss
Risk tolerance is your ability and willingness to lose some or all of an investment in exchange for a higher possible return44. UK regulators separate out capacity for loss: your ability to absorb a fall without harming your standard of living45. A 30-year-old with a secure job may have high capacity and low tolerance, or the reverse; both matter.
Sharpe ratio
Return above a safe rate, divided by volatility: how much extra return each unit of risk bought, as William Sharpe defined it36. Example: with cash at 4%, a fund returning 9% with a standard deviation of 15 points scores about 0.33; one returning 7% with a standard deviation of 6 points scores 0.50, a better reward for the risk taken even though it earned less.
Sequence risk
The risk that bad returns arrive just when you start drawing money out, which does more damage than the same returns arriving later. It matters most in the years around stopping work; sequence of returns risk explains it with examples.
Bonds and interest rates
Coupon
The interest a bond pays, set when it is issued and quoted as a percentage of its face value, usually paid twice a year5. Example: a 4.5% coupon on a $1,000 bond is $45 a year5.
Yield and current yield
Current yield is a bond’s yearly interest divided by its market price. The SEC’s example: a bond priced at $1,000 paying $80 a year has a current yield of 8%46. If the price falls to $900, the same $80 is a yield of about 8.89%, which is why prices and yields move in opposite directions.
Yield to maturity (YTM)
The total yearly return from buying a bond at today’s price and holding it to maturity, counting every coupon and the repayment of face value5. Example: a bond with one year left, a 5% coupon and a face value of 100, bought at 98, pays 5 plus 100 for an outlay of 98 — a yield to maturity of about 7.14%.
Duration
How sensitive a bond’s price is to interest rates, in years. FINRA’s rule of thumb: for each one-point change in rates, the price moves the other way by roughly its duration47. Example: a bond fund with a duration of 10 would be expected to fall about 10% if rates rose one percentage point, and rise about 10% if they fell one point47.
Government bonds: Treasuries, gilts and G-secs
Bonds issued by a national government in its own currency — Treasuries in the US, gilts in the UK, government securities (G-secs) in India — treated as the safest bonds in that currency because the government stands behind them48. Example: the yield on three-month US Treasury bills was 4.22% on 5 October 202649.
Credit rating and default
A credit rating is an agency’s opinion of how likely a borrower is to pay50; a default is a failure to pay interest or principal when due51. Bonds rated BBB (S&P and Fitch) or Baa (Moody’s) and above are investment grade; those rated BB or Ba and below are high yield, or junk, and pay more because they are likelier to default5253.
Policy rate and real interest rate
The policy rate is the rate a central bank sets to steer borrowing costs across the economy; deposit and loan rates tend to follow it. The real interest rate is a rate minus inflation. Example: the Bank of England held Bank Rate at 3.75% on 17 September 2026, with UK inflation at 3.1% in August, a real policy rate of about 0.65 points; the RBI raised its repo rate to 5.50% on 7 October 2026, against Indian inflation of 4.82%, about 0.68 points54555657.
Yield curve
A line showing the yields on debt of different maturities, from three months to 30 years58. It usually slopes upward, because lenders want more to tie money up for longer; when short rates sit above long ones it is called inverted, which markets read as a sign of expected rate cuts. Interest rates and your money covers what rates do to a household.
How you invest
Asset allocation
How your money is divided between kinds of investment, such as shares, bonds and cash59. Example: ₹20 lakh held 70/30 is ₹14 lakh in shares and ₹6 lakh in bonds. It has more effect on your results than any single fund choice; asset allocation by age covers the evidence.
Rebalancing
Bringing a portfolio back to its intended mix after some parts have grown faster than others60. Example: £100,000 held 60/40 sees its shares rise 25% while bonds stay flat. It is now £75,000 in shares and £40,000 in bonds, about 65.2% shares; selling £6,000 of shares and buying bonds restores 60/40 on £115,000.
SIP (systematic investment plan)
A fixed amount invested at regular intervals, usually monthly, by standing instruction — the Indian name for what elsewhere is a regular investment plan. Example, following SEBI’s investor-education calculator: ₹10,000 a month for ten years at an assumed 12% a year grows to about ₹23.0 lakh from ₹12 lakh paid in61. SIP vs lump sum covers when it beats investing at once.
Rupee-, pound- or dollar-cost averaging
Investing equal amounts at regular intervals whatever the market does, so you buy more units when prices are low and fewer when they are high62. Example: $300 a month for three months at prices of $10, $8 and $12 buys 92.5 units at an average cost of about $9.73, below the $10 average price.
Lump sum
Investing a sum you already have all at once rather than feeding it in over months. Because markets rise more often than they fall, Vanguard found that across global shares from 1976 to 2022 investing at once beat a three-month split 68% of the time, while splitting it still beat holding cash 69% of the time63. A monthly SIP from salary is a different decision: it invests money as soon as you have it. SIP vs lump sum has the detail.
Currency risk
The chance that an investment held in another currency gains or loses value for you because the exchange rate moves, even if the investment itself does not. It cuts both ways, and it matters most when the money will be spent in a different currency from the one it is held in. Home bias and currency risk covers how much of it to keep.
P/E ratio and earnings yield
The share price divided by the company’s earnings per share over the past year, a rough gauge of how expensive a share is against its past or its peers64. Example: a share at ₹1,500 earning ₹60 a share has a P/E of 25; turned upside down, its earnings yield is 4%. At the end of September 2026 the S&P 500 traded at 19.0 times the earnings analysts expected over the next year37.
Time horizon
How long you expect to keep money invested before you need it for its goal65. It decides more about where money should sit than any forecast does: money needed in two years and money needed in twenty face different risks.
Your own plan
Net worth
Everything you own minus everything you owe12. Example: Matt’s £406,000 of assets less £174,000 of liabilities gives a net worth of £232,000. How that compares with households like yours is in household wealth by age.
Savings rate
The share of income left after spending and loan payments, which is what funds every plan66. Example: a household taking home ₹2.4 lakh a month and spending ₹1.7 lakh saves ₹70,000, about 29.2% of take-home pay. How to save more covers what works.
Emergency fund
Cash set aside for job loss or unexpected bills, so that you never have to sell investments or borrow at a bad moment. ASIC’s Moneysmart suggests three months of expenses as a good target67. Example: essential spending of £2,400 a month means £7,200 for three months, or £14,400 for six. See emergency fund: how much.
FI number
The amount, in today’s money, you would need invested to cover your spending from savings and other income: your yearly need after you stop working, grossed up for tax and divided by a withdrawal rate, plus your goals68. Example, before tax and goals: $60,000 a year divided by 4% is $1.5 million. The 4% rule by country explains why 4% is not a universal answer.
Withdrawal rate
The share of your savings you draw in a year to cover what other income does not69. Example: drawing $48,000 in a year from $1.2 million is a withdrawal rate of 4%.
Financial independence
The point at which your savings and other income could pay for your life without a salary, so work becomes a choice. FIRE (financial independence, retire early) is the movement built around reaching it sooner; what the FIRE movement gets right looks at the evidence.
Questions people ask
What is the difference between a mutual fund and an ETF?
Both pool investors’ money into one portfolio67. A mutual fund is bought and sold at the NAV worked out at the end of each business day; an ETF trades on a stock exchange through the day at whatever price buyers and sellers agree.
What is a basis point?
One hundredth of a percentage point: 8% is 800 basis points29. A fee cut from 0.75% to 0.20% is 55 basis points, worth £550 a year on £100,000.
What does NAV mean in a mutual fund?
Net asset value: the fund’s assets minus its liabilities, usually quoted per unit and worked out at least once every business day11. A low NAV does not make a fund cheaper or better value.
What is the difference between CAGR and XIRR?
CAGR is the steady yearly rate between one starting value and one ending value. XIRR does the same when money went in at different dates, as with a SIP, weighting each amount by how long it was invested21.
What is a good expense ratio?
Lower is better for the same exposure, because the charge is taken every year from the whole balance30. A cut of 55 basis points is worth £550 a year on £100,000; what fees cost over 30 years gives typical figures by country.
What counts as a bear market?
Generally a fall of 20% or more in a broad index over at least two months38. The S&P 500’s 25% fall in 2022 was one37.
What is duration in a bond fund?
A measure of how much its price moves when interest rates change: roughly its duration in per cent for each one-point move. A fund with a duration of 10 would fall about 10% if rates rose one point47.
What is an FI number?
The amount you would need invested for your savings and other income to cover your spending without a salary; before tax and goals, $60,000 a year at a 4% withdrawal rate is $1.5 million68.
Sources
Glossary: Asset — Investor.gov, U.S. Securities and Exchange Commission, 2026.
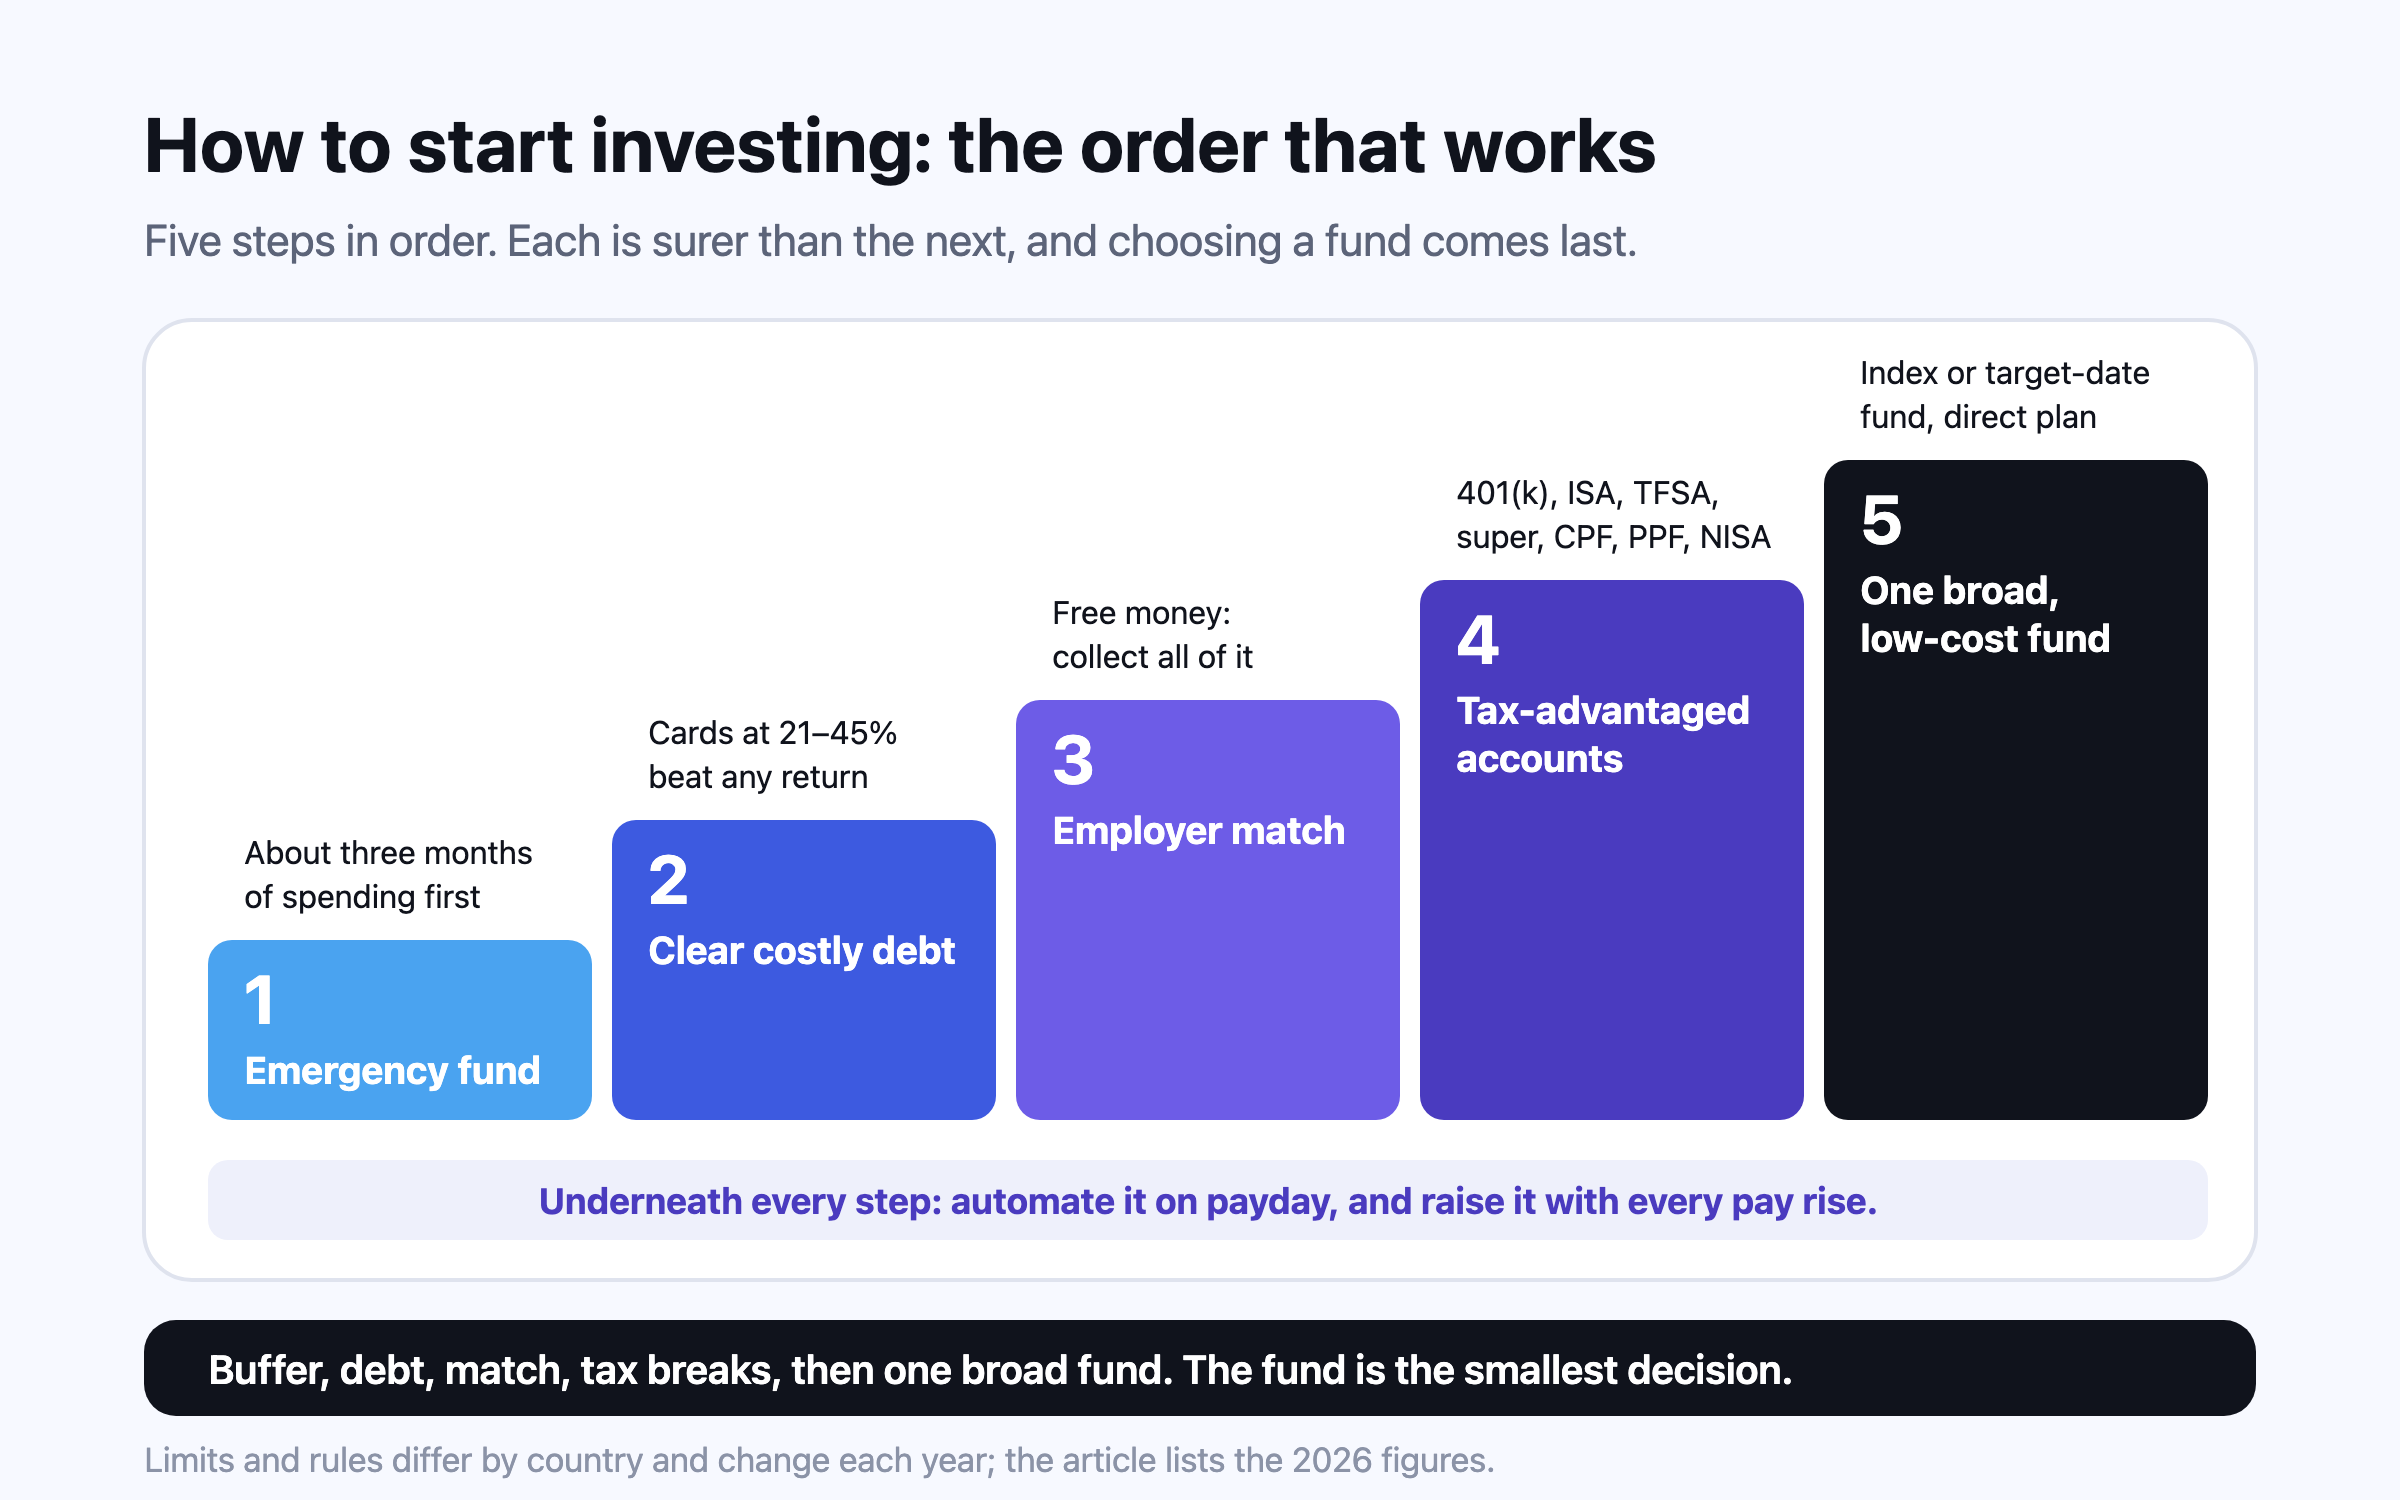
The order matters more than the product: an emergency fund first, then any debt costing more than investments can earn, then free money from an employer and the tax breaks your country offers, then a broad, low-cost index fund. In 2026 that means, for example, up to $24,500 in a US 401(k), £20,000 in a UK ISA, C$7,000 in a TFSA and a 12% employer super contribution in Australia. Automating it does more than picking the perfect fund.
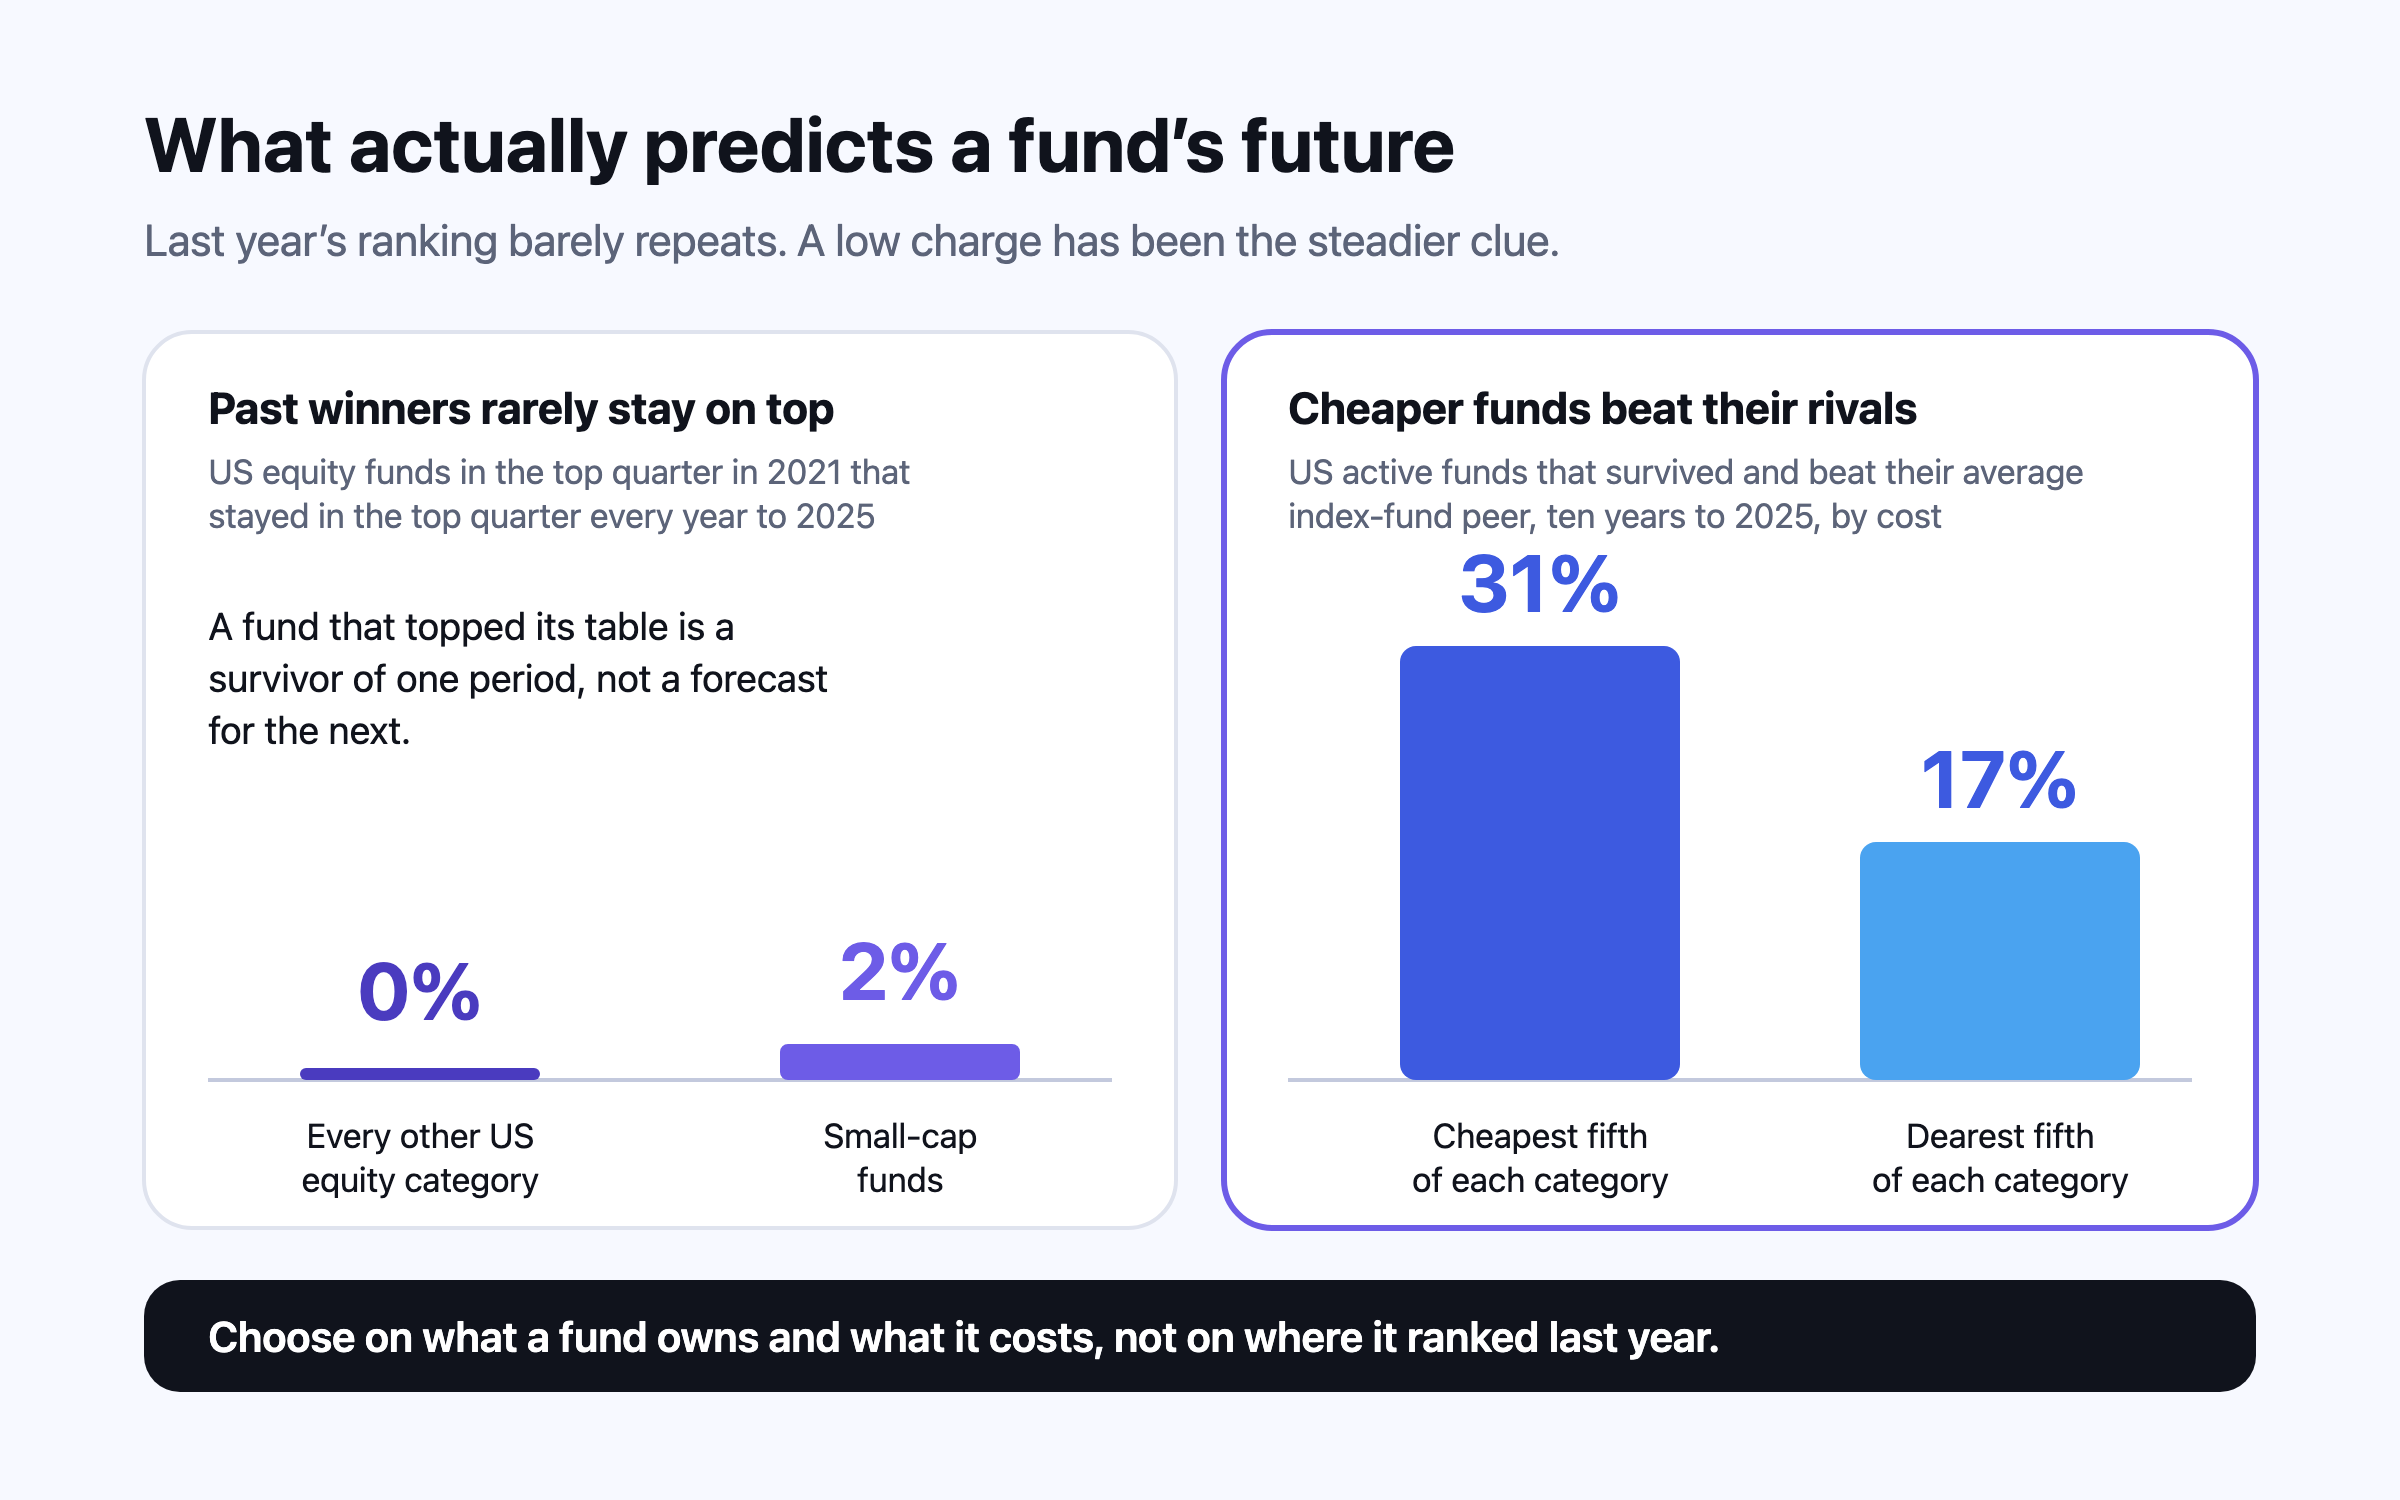
Start with what the fund owns and what it charges; those two decide most of the result. The evidence on past performance is discouraging: almost no US equity fund that was in the top quarter in 2021 stayed there every year to 2025, while Morningstar has called the expense ratio the most proven predictor of future fund returns. For index funds, compare tracking difference, size and, if you live outside the US, where the fund is domiciled.
Over the ten years to 2025, the average dollar in US funds earned about 1.2 points a year less than the funds themselves, because of when money went in and out — though a 2026 study argues timing explains far less of that. Better evidenced are the costs of heavy trading, leverage and concentration: 87.7% of individual Indian F&O traders lost money in FY26, and the most active US households in one classic study trailed the market by over six points a year.
This is general information, not financial, tax or legal advice for your circumstances. Rules and figures change; check the official source for your country, and consult a licensed professional before making financial decisions. Projections are estimates, not predictions.