A mutual fund is a shared pot priced once a day; what separates a good one from a poor one is mostly cost, which is why index funds now hold the majority of US long-term fund assets.
A mutual fund pools many investors’ money into one portfolio and issues units priced at the net asset value (NAV) once a day. The NAV itself says nothing about value; the costs and the holdings do. A yearly charge of 0.9% instead of 0.1% leaves about 17% less after 25 years, most active funds trail their index over long periods, and index mutual funds and index ETFs together held 52% of US long-term fund assets at the end of 2025.
Nivritee Research · 6 October 2026 · 10 min read
A mutual fund is a shared pot. Thousands of people put money in, a manager invests the whole pool in shares, bonds or both, and each investor owns units in proportion to what they put in. The pot is valued once every business day, after the markets close, and that value per unit is the net asset value, or NAV; you buy or sell at the next NAV calculated after your order, plus any fees1. That is the whole mechanism. Everything else, from the plan type to the fund category, is a variation on who pays whom, how much, and for what.
Mutual funds are how most middle-class households own shares at all. In India the industry managed ₹87.08 lakh crore at the end of August 2026, across 28.35 crore folios2, and ₹32,297 crore went in through monthly SIPs in August alone3. In the US, 72.7 million households owned mutual funds in 20254. The shift of the last fifteen years is towards funds that simply track an index: they now hold the majority of US long-term fund assets.
US index vs active equity mutual funds, asset-weighted expense ratio, 2025
How a fund works: units, NAV and the money you pay in
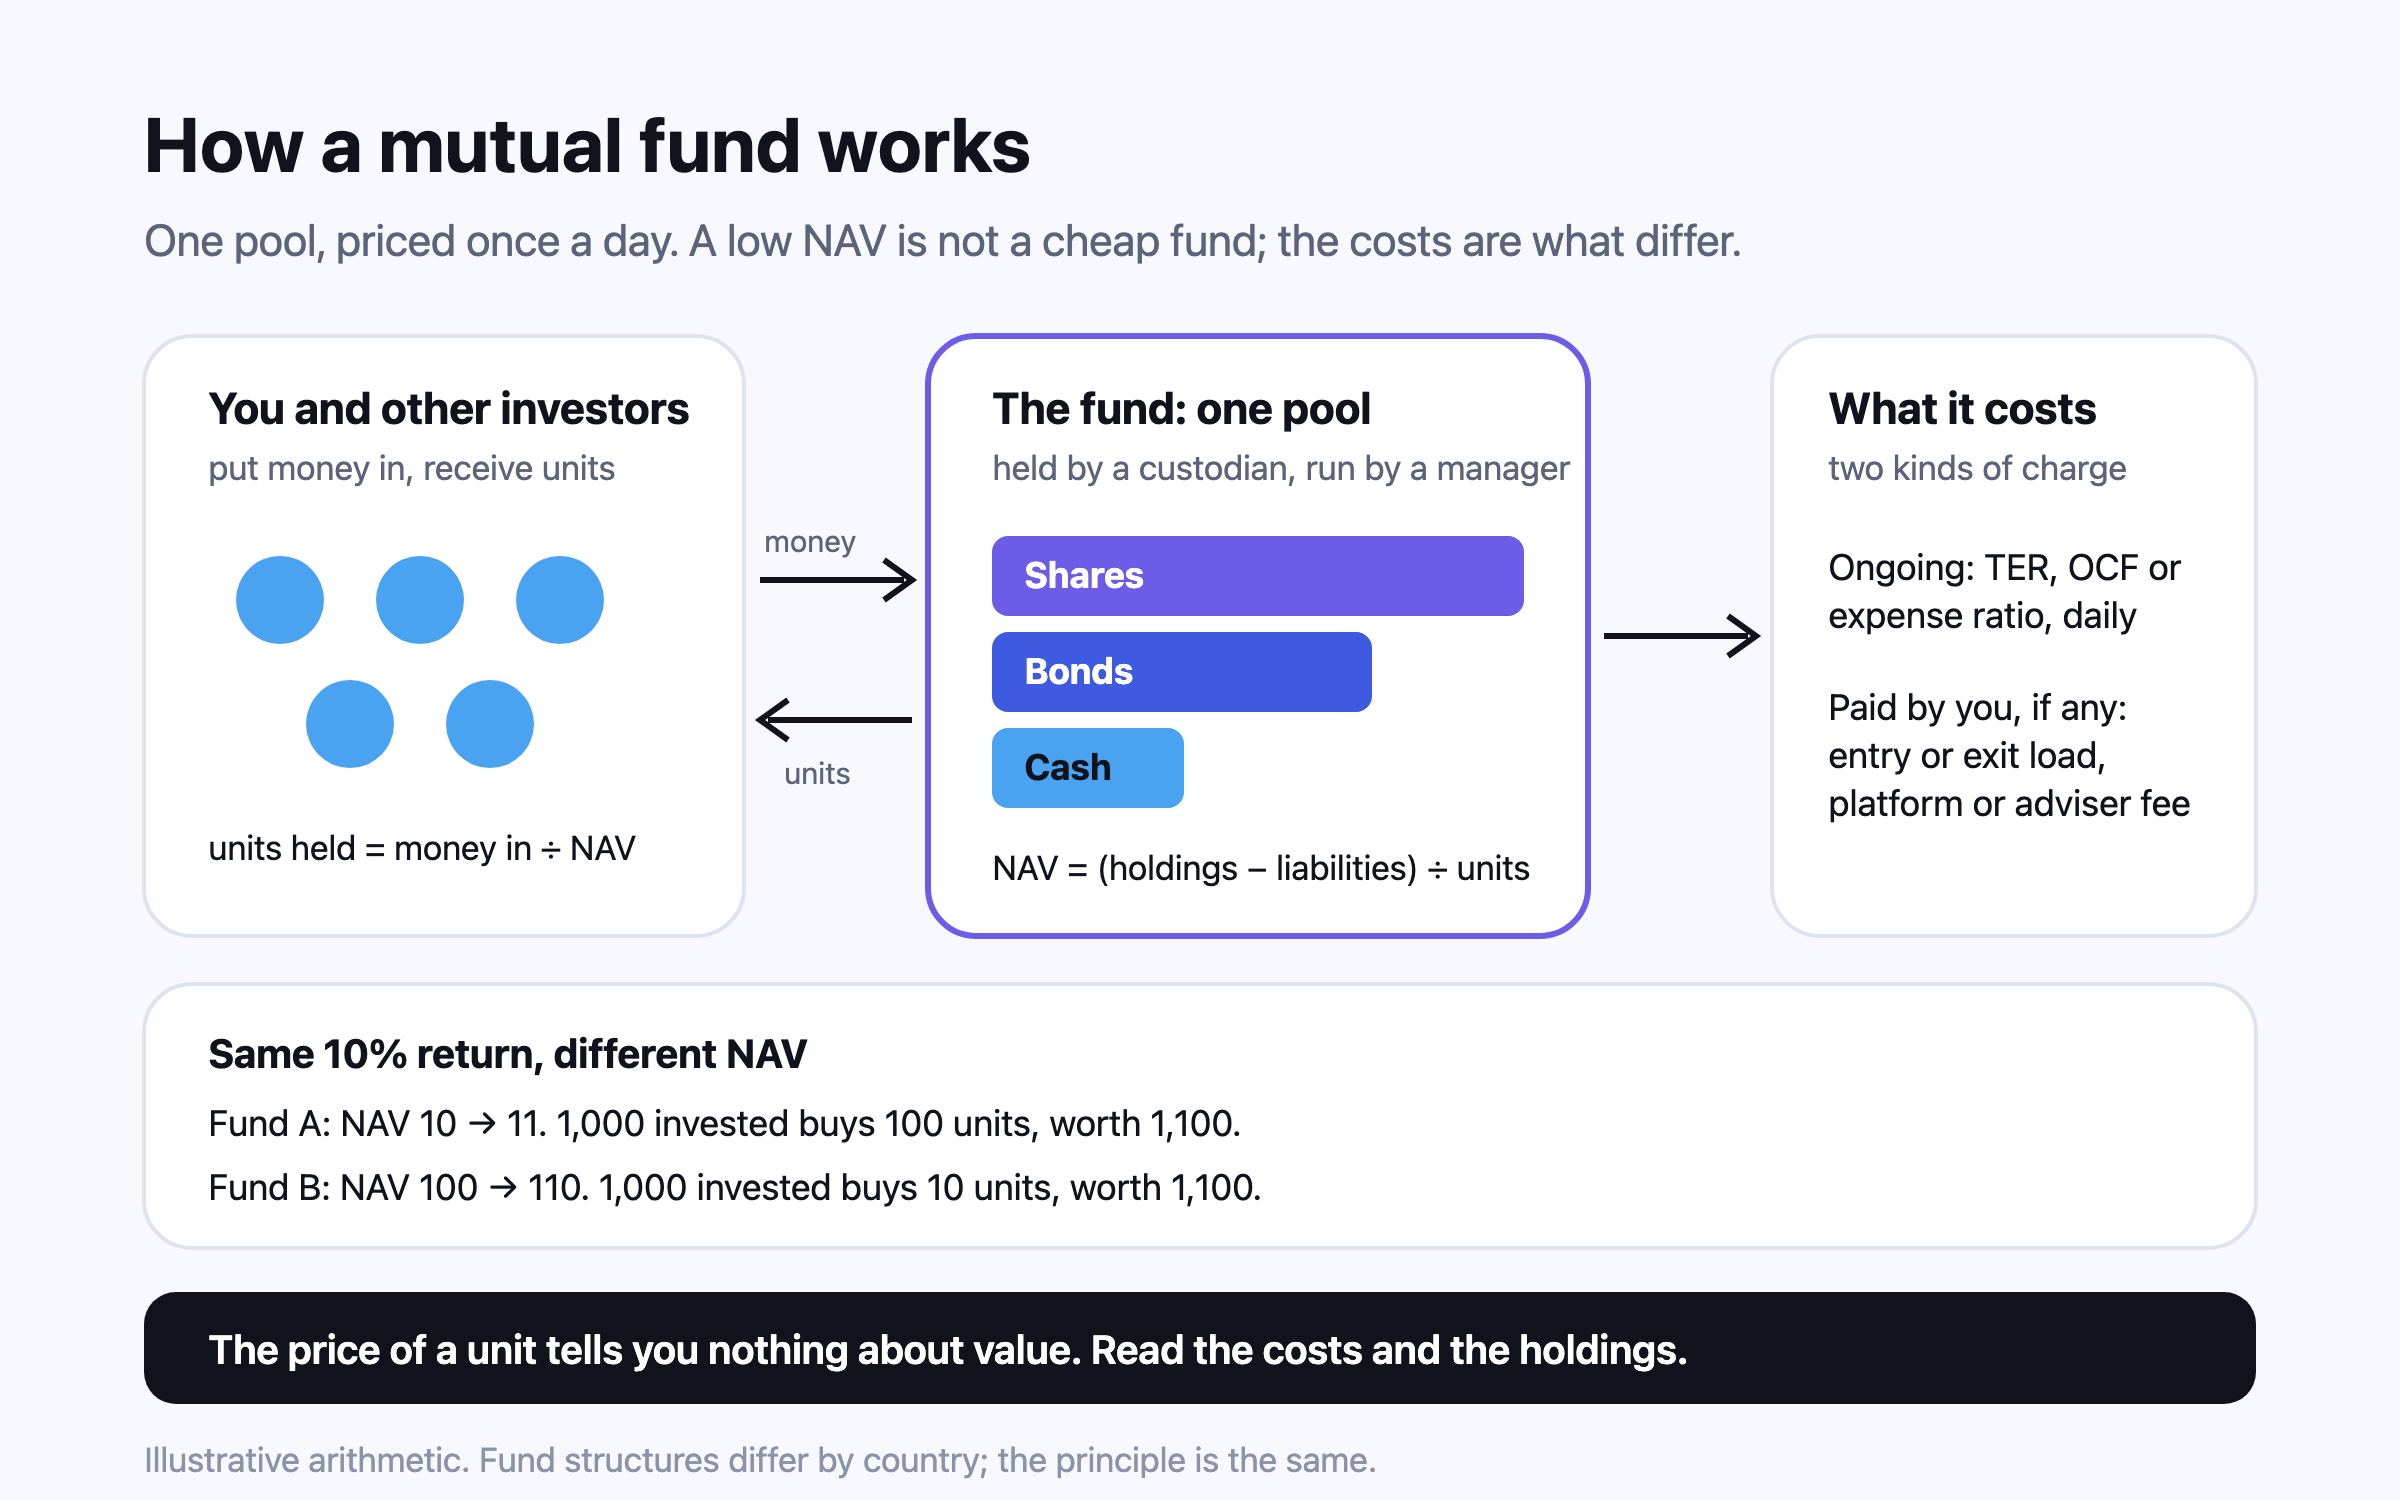
The NAV is arithmetic: the market value of everything the fund owns, minus what it owes, divided by the number of units. A fund holding ₹500 crore of shares, owing ₹2 crore in expenses and settlements, with 20 crore units in issue, has a NAV of ₹24.908. When you invest ₹10,000 at that NAV you receive about 401.6 units; the fund buys more shares with your money and the NAV is unchanged. The fund is open-ended: it creates units when people invest and cancels them when people redeem, so its size moves with demand.
Timing is set by rule. In India, for every scheme except liquid and overnight funds, the closing NAV of the day on which your money is available to the scheme applies, with a 3:00 pm cut-off for the funds reaching its bank account9. In the US the price is the next NAV calculated, typically after the major exchanges close8. Either way you cannot know the exact price when you place the order, which is deliberate: it stops anybody trading on stale prices at other investors’ expense.
Is the money safe if the fund company fails? The structure is designed so that it is. An Indian mutual fund must be constituted as a trust, its trustees hold the property in trust for unit holders, and they must appoint a custodian to keep the assets separately from the fund manager10. In the UK, the Financial Services Compensation Scheme covers up to £85,000 per person per firm if a firm fails, but never losses from poor investment performance11. In the US, mutual funds are not guaranteed or insured by the FDIC1. Separation protects you from the manager’s failure; nothing protects you from the market.
A low NAV is not a cheap fund
The most common beginner mistake is to treat NAV like a share price and conclude that a fund at ₹10 is “cheaper” than one at ₹100, or that a new fund offer at ₹10 is a bargain. It is not: the per-unit NAV is only the fund’s net assets divided by the number of units in issue8. Put ₹1,000 into a fund with a NAV of 10 and you get 100 units; put it into one at 100 and you get 10. If both portfolios rise 10%, the first NAV goes to 11 and the second to 110, and both holdings are worth ₹1,100. The number of units is bookkeeping. What determines your result is what the fund owns and what it charges.
A related trap is the payout option. Indian funds offer a growth option, where gains stay in the fund, and an IDCW option, short for income distribution cum capital withdrawal. The clumsy name says what SEBI requires funds to disclose: payouts can come out of investors’ own capital, and any advertisement of a payout must say that the NAV falls by the amount paid out9. A payout is your own money handed back, often taxed as it is paid, not extra income.
What a fund costs: expense ratios, loads and the layers on top
The main cost goes by different names in each country and means the same thing everywhere: the yearly percentage taken from the fund’s assets to pay the manager, administrator, custodian and, in some plans, the person who sold it to you. India calls it the total expense ratio (TER), the UK the ongoing charges figure (OCF), Canada the management expense ratio (MER) and the US the expense ratio. It is deducted daily, so it is already inside the NAV; you never see a bill. In 2025 US equity mutual funds charged an asset-weighted average of 0.40%, index equity funds 0.05% and actively managed equity funds 0.64%7.
Illustrative arithmetic, not a forecast: £50,000 × (1 + 6% − charge) to the 25th power. The charges are round figures close to the FCA’s finding of 0.15% for passive and 0.90% for active UK equity funds; platform and adviser fees would come on top. 12
£50,000 invested once, 6% a year before costs
Yearly charge
After 25 years
A low-cost index fund
0.1%
about £209,589
A typical active fund
0.9%
about £173,396
Difference
0.8 points
about £36,194, or 17.3% less
Tom Hughes, 41, a teacher in Leeds, has £50,000 in a stocks and shares ISA in an active UK equity fund. The FCA’s 2016 market study found active UK equity funds charging an average 0.90% against 0.15% for passive ones12. At the charges in the table, the choice is worth about £36,000 over 25 years before any difference in performance, which is the subject of the next section. The OCF is the number on the factsheet; the platform fee is usually charged separately and should be added to it. Our longer piece on what fees cost over 30 years works through the layers.
Loads are charges for buying or selling. India abolished entry loads, and any exit load a fund charges is paid back into the scheme for the remaining investors, not to the fund company9. One large Indian flexi-cap fund, for example, charges 1% on units redeemed within a year of purchase13, so redeeming ₹2 lakh after eight months would cost ₹2,000. In the US, FINRA puts front-end loads at between 2% and 5% of the purchase and caps 12b-1 marketing and service fees at 1% of assets a year14; its rulebook limits front-end and deferred sales charges together to 8.5% of the offering price for funds without an ongoing asset-based sales charge15. Most US money now avoids them: 92% of gross sales of long-term mutual funds went to no-load funds without 12b-1 fees in 20257.
Darnell and Keisha Okafor, 38 and 37, in Atlanta, were offered Class A shares of an active fund through a broker at their bank with a 5% front-end load. On $20,000, that is $1,000 taken before a dollar is invested, leaving $19,000 working14. US share classes of the same fund all hold identical investments and differ in their fees and expenses16, so the right question to ask the broker is which class, and what each costs in dollars over the years they expect to hold it.
India’s direct and regular plans
Every Indian scheme must offer a direct plan for money invested without a distributor. It holds the same portfolio, has its own NAV, and has a lower expense ratio because no distribution commission is paid9. The gap varies by scheme. In one large flexi-cap fund, the direct plan’s TER is 0.77% and the regular plan’s 1.37%, a difference of 0.60 points a year13.
Illustrative arithmetic, not a forecast and not a projection for any scheme: monthly contributions compounded at the yearly rate ÷ 12, as SEBI’s investor-education SIP calculator computes it. The 0.60-point gap is one real scheme’s; others differ. 1713
₹15,000 a month for 20 years (₹36 lakh paid in)
Return after costs
Value after 20 years
Direct plan
12.0% a year
about ₹1.48 crore
Regular plan: 0.60 points more in costs
11.4% a year
about ₹1.37 crore
Difference
about ₹11.5 lakh
Priya and Arjun Kulkarni, 34 and 36, in Pune, take home ₹2.4 lakh a month and run a ₹15,000 monthly SIP that a relationship manager set up in the regular plan. On the table’s figures, the commission costs them about ₹11.5 lakh over 20 years17. The honest other side is that a distributor can be worth paying if they keep a household investing through a crash; Monika Halan’s *Let’s Talk Money* sets out a simple, India-specific system for a family’s money that works without constant attention18. Paying for help can fit inside such a system; the point is to choose it knowingly, at a price you can name, not by default.
Active funds, index funds and the evidence
An active fund’s manager picks what to own and tries to beat a benchmark index; an index fund buys everything in the index and accepts its return minus a small fee. S&P Dow Jones Indices’ SPIVA scorecards count how often active funds actually beat their benchmark, adjusting for funds that close. The answer is consistent across countries: over long periods, most do not.
SPIVA scorecards: US Mid-Year 2026; India, Europe and Canada Year-End 2025; Australia Mid-Year 2025, the latest Australian edition we could check. 1920212223
Market and fund category
Benchmark
Period
Share of active funds that underperformed
US large-cap
S&P 500
15 years to June 2026
90.49%
India large-cap
S&P India LargeMidCap
10 years to 2025
76.29%
UK equity (GBP funds)
S&P United Kingdom BMI
10 years to 2025
92.98%
Canadian equity
S&P/TSX Composite
10 years to 2025
98.82%
Australian equity general
S&P/ASX 200
15 years to June 2025
85.3%
Morningstar reaches the same place by a different route: just 21% of US active strategies both survived and beat their passive counterparts over the ten years to 2025, and the cheapest active funds did far better than the dearest, 31% against 17%24. John Bogle, who launched the first index fund for ordinary investors, built the case in *Common Sense on Mutual Funds* around exactly this arithmetic: before costs, investors as a group earn the market’s return, so after costs the average active investor must trail a cheap index fund25. India’s figure is the least one-sided of these, though about three in four large-cap funds still lagged over ten years20. For the detail, see index vs active funds: the SPIVA data and how to choose a fund.
The fund families in each country
India sorts every open-ended scheme into SEBI categories, revised in February 2026: 13 equity categories, from large cap to ELSS, 17 debt, 7 hybrid, life-cycle funds, and index funds and funds of funds9. Large cap means the 100 biggest companies by full market value, mid cap the 101st to 250th, small cap the rest9. Each scheme also carries a riskometer with six levels from Low to Very High9. The categories make like-for-like comparison possible; they do not make a fund suitable.
The UK has two open-ended forms, OEICs and unit trusts, which work alike for an investor, and one closed-ended form that does not. An investment trust is a listed company with a fixed number of shares, so its share price is set by the stock market and can sit below the value of what it owns; with a NAV of 100p and a price of 90p it trades at a 10% discount26. Investment trusts can also borrow to invest, which the AIC calls gearing; it magnifies gains and losses alike26. Funds held through UK platforms are moving from the old key information documents to a new consumer composite investments regime, with the full rules in force from 8 June 202727.
Canada had C$2.797 trillion in mutual funds at the end of August 2026, against C$924.2 billion in ETFs28. It banned deferred sales charges, the redemption fees that locked investors in, and trailing commissions on funds held in self-directed accounts, both from 1 June 202229. MERs range from under 1% to over 3%29. Jessica and Mark Tremblay, 45 and 47, in Calgary, hold C$100,000 in a balanced fund with a 2.0% MER. At 6% a year before costs, that projects to about C$219,000 in 20 years; at a 0.3% MER, about C$303,00029. The gap is the price of the fund’s management and the adviser paid from it, and whether the advice is worth roughly C$84,000 is a question worth asking out loud.
Australia calls them managed funds, and the same thing may be labelled a unit trust, managed investment scheme or corporate collective investment vehicle; ASIC lists all of those names30, tells investors to read each fund’s product disclosure statement, and notes that every fund must publish a target market determination saying who it is designed for31. Singapore calls them unit trusts. MAS’s MoneySense guide puts initial sales charges at 1.5% to 5%, total expense ratios usually between 1.0% and 2.5%, and trailer fees at 20% to 60% of the management fee, and gives buyers seven calendar days to cancel32. Wei Ling and Darren Koh, 40 and 42, in Singapore, putting S$20,000 into a unit trust with a 3% sales charge, pay S$600 before anything is invested32. Singaporeans can invest Ordinary Account CPF savings in approved funds after setting aside the first S$20,00033.
How to read a factsheet in five minutes
Objective and benchmark. What the fund is trying to do and which index it measures itself against. An index fund’s benchmark is its target; an active fund’s is the bar it must clear after costs.
Costs. The TER, OCF, MER or expense ratio, and for Indian funds whether you are looking at the direct or regular plan. Add any platform or adviser fee you pay on top.
Holdings. The top ten holdings and the sector or country split, to see whether the fund duplicates what you already own.
Risk. India’s riskometer, or the fund’s own risk indicator elsewhere, plus, for a bond fund, its duration and average credit rating; see bonds, explained.
Performance against the benchmark, over five and ten years where available, not one. Ignore the one-year figure; it is mostly noise.
Loads and lock-ins. Any exit load, its period, and any statutory lock-in, such as the three years an ELSS fund’s units must be held34.
Mutual funds are not the only wrapper for the same portfolios. An exchange-traded fund can hold the same index and trade on a stock exchange all day; whether it is cheaper or more convenient depends on the country. ETFs, explained covers the differences, and how the stock market works the shares inside both.
Keeping track of your funds
Questions people ask
What is NAV in a mutual fund?
NAV is the value of everything the fund owns, minus what it owes, divided by the number of units. It is calculated once each business day, typically after markets close, and you buy or sell at the next NAV after your order8.
Is a mutual fund with a low NAV better to buy?
No. A low NAV only means each unit is smaller: ₹1,000 buys 100 units at 10 or 10 units at 100, and a 10% rise makes both worth ₹1,100. What matters is the holdings and the costs.
What is the difference between direct and regular mutual funds?
They hold the same portfolio, but the regular plan pays a distributor’s commission through a higher expense ratio and has its own NAV9. In one large flexi-cap fund the gap is 0.60 points a year13.
What is an exit load?
A charge for redeeming within a set period. One large Indian flexi-cap fund, for example, charges 1% on units redeemed within a year13. In India it is credited back to the scheme rather than kept by the fund company9.
Should I choose IDCW or growth?
IDCW payouts can come from your own capital and the NAV falls by the amount paid9, so a payout is not extra income. For long-term saving the growth option keeps the money compounding; IDCW suits someone who specifically wants regular payments.
Is my money safe if the mutual fund company goes bust?
The assets are held separately: in India the fund is a trust whose assets a custodian keeps apart from the manager10. That protects against the company failing, not against the market falling; funds are not deposits and are not insured like them1.
What is the difference between an OEIC, a unit trust and an investment trust?
OEICs and unit trusts are open-ended and priced at NAV. An investment trust is a listed company with fixed shares, so its price can sit at a discount to NAV, and it may borrow to invest26.
Do most active mutual funds beat the index?
Not over long periods. Over 15 years to June 2026, 90.49% of US large-cap active funds trailed the S&P 50019; in India 76.29% of large-cap funds trailed their benchmark over the 10 years to 202520.
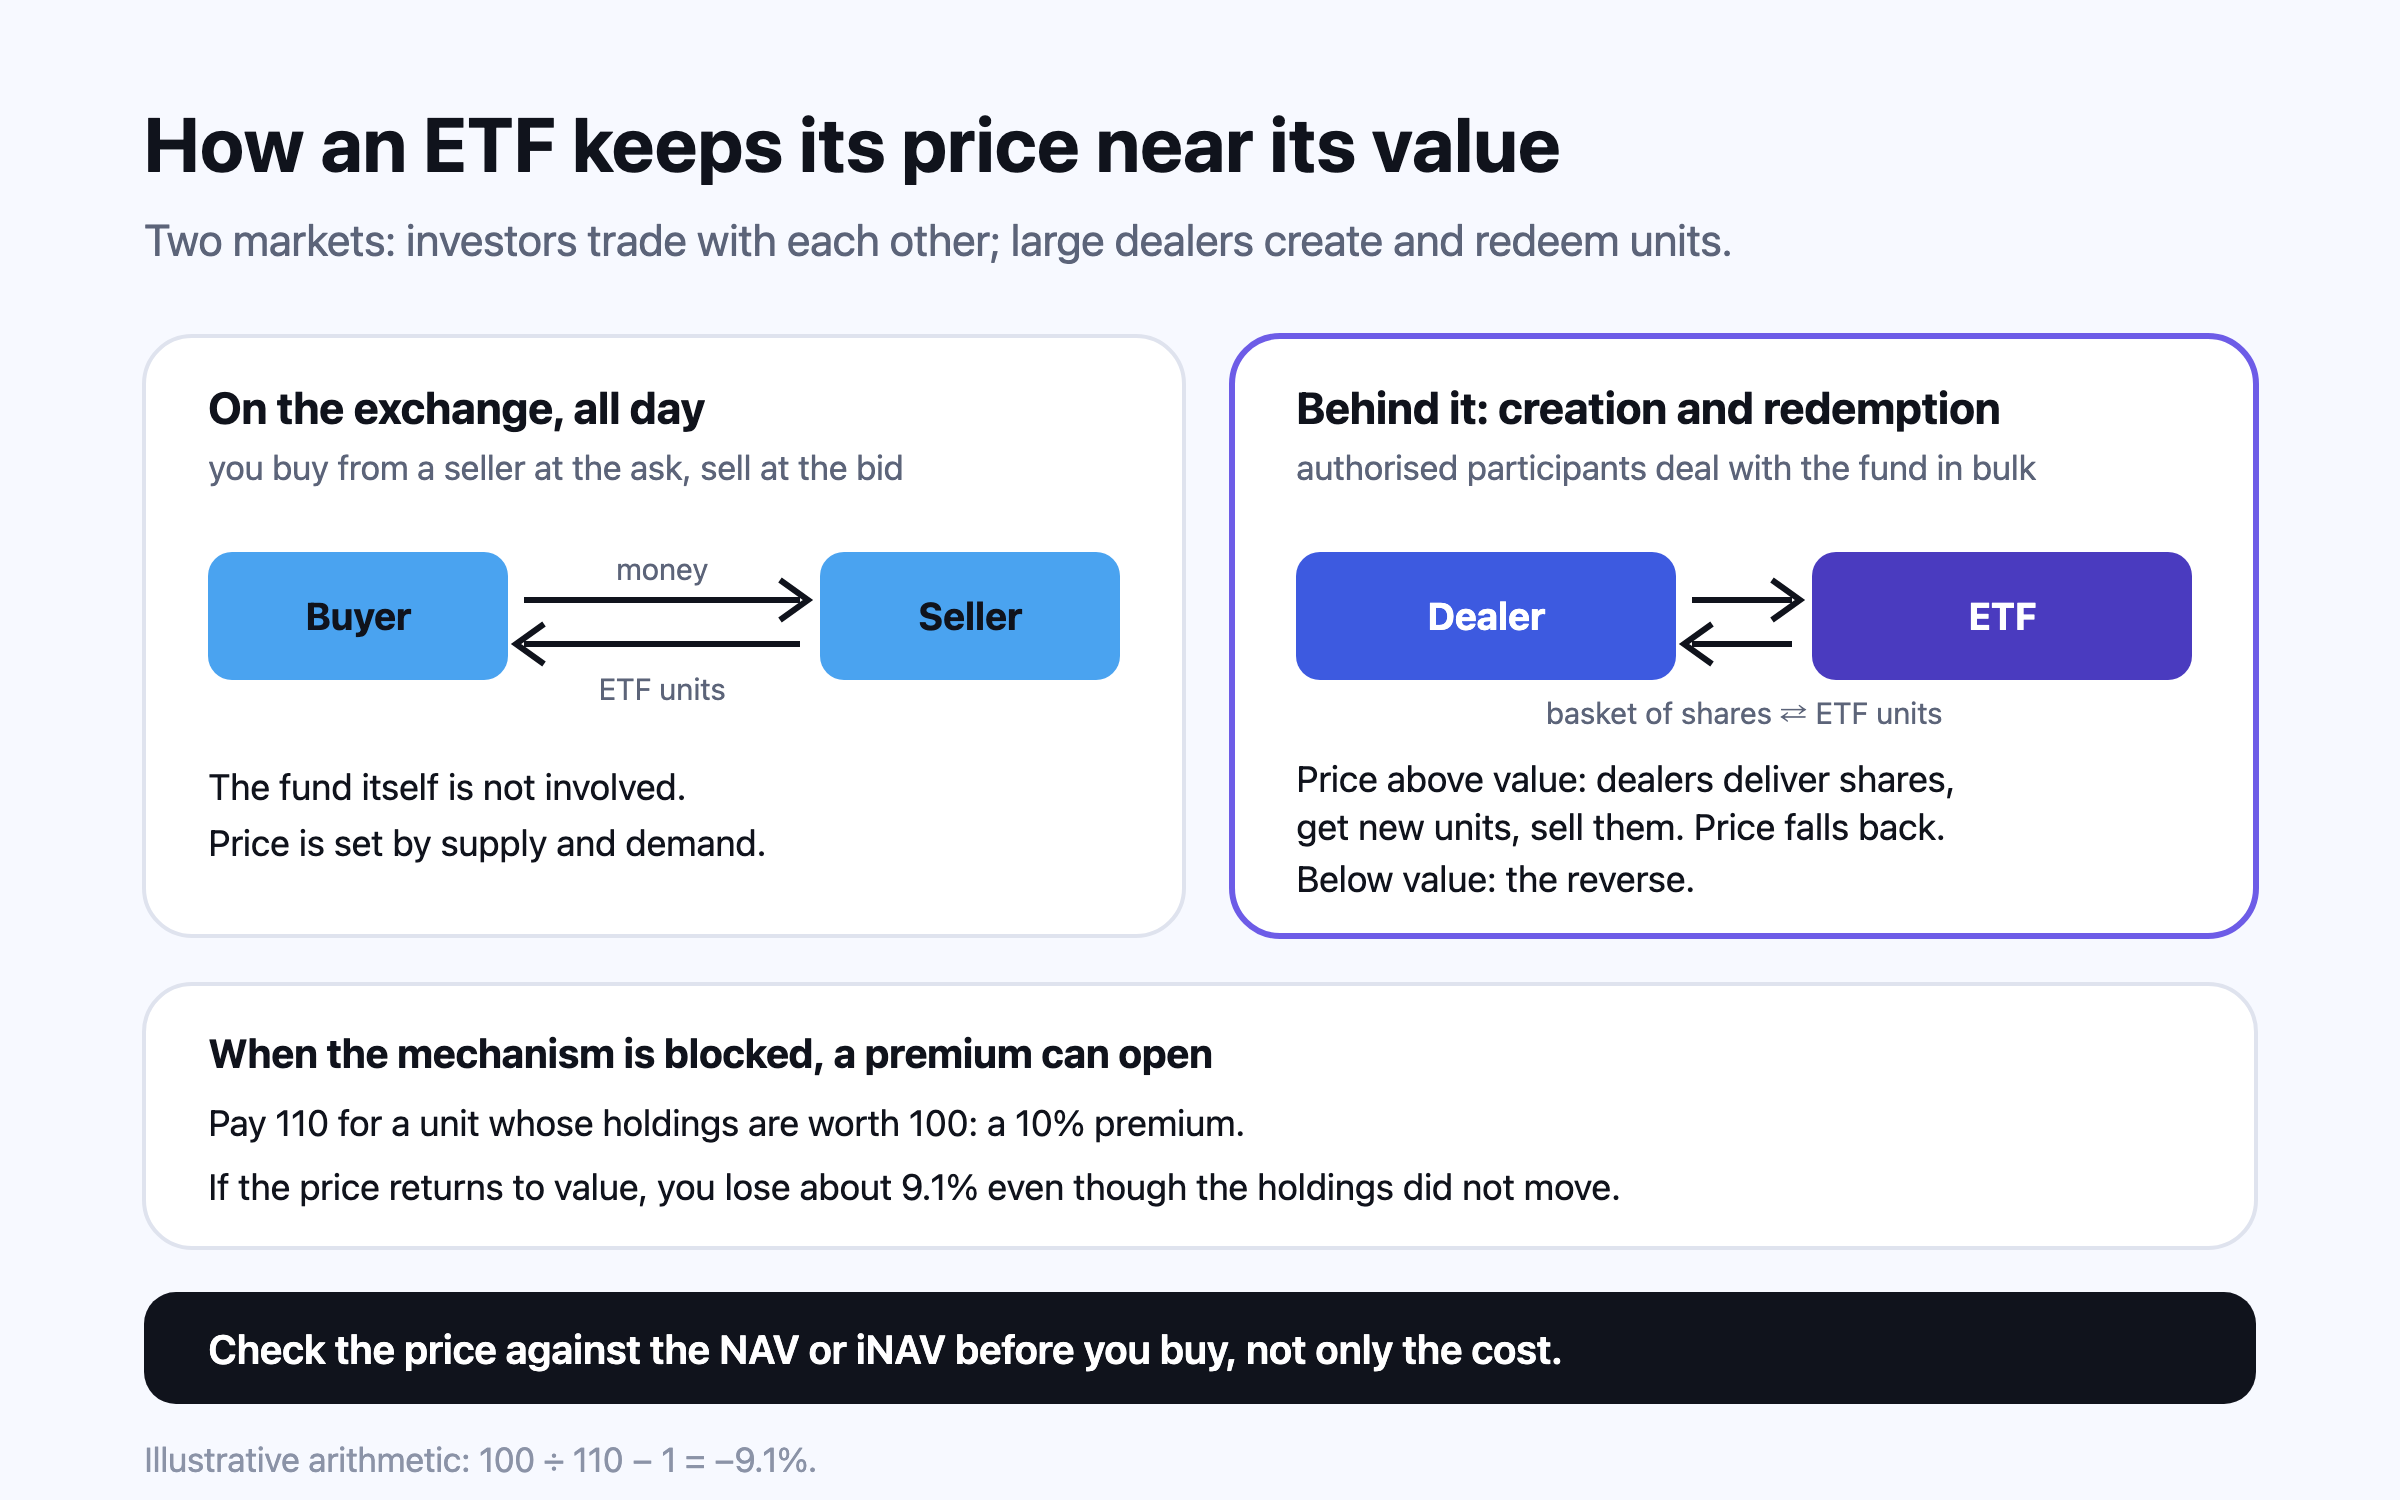
An exchange-traded fund holds a portfolio like a mutual fund but trades on a stock exchange all day. Large dealers create and redeem units to keep its price close to the value of its holdings; when that mechanism is blocked, as for India’s international ETFs in September 2026, prices can run far above value. For investors outside the US, the fund’s domicile decides how much dividend tax is withheld and whether US estate tax applies above US$60,000.
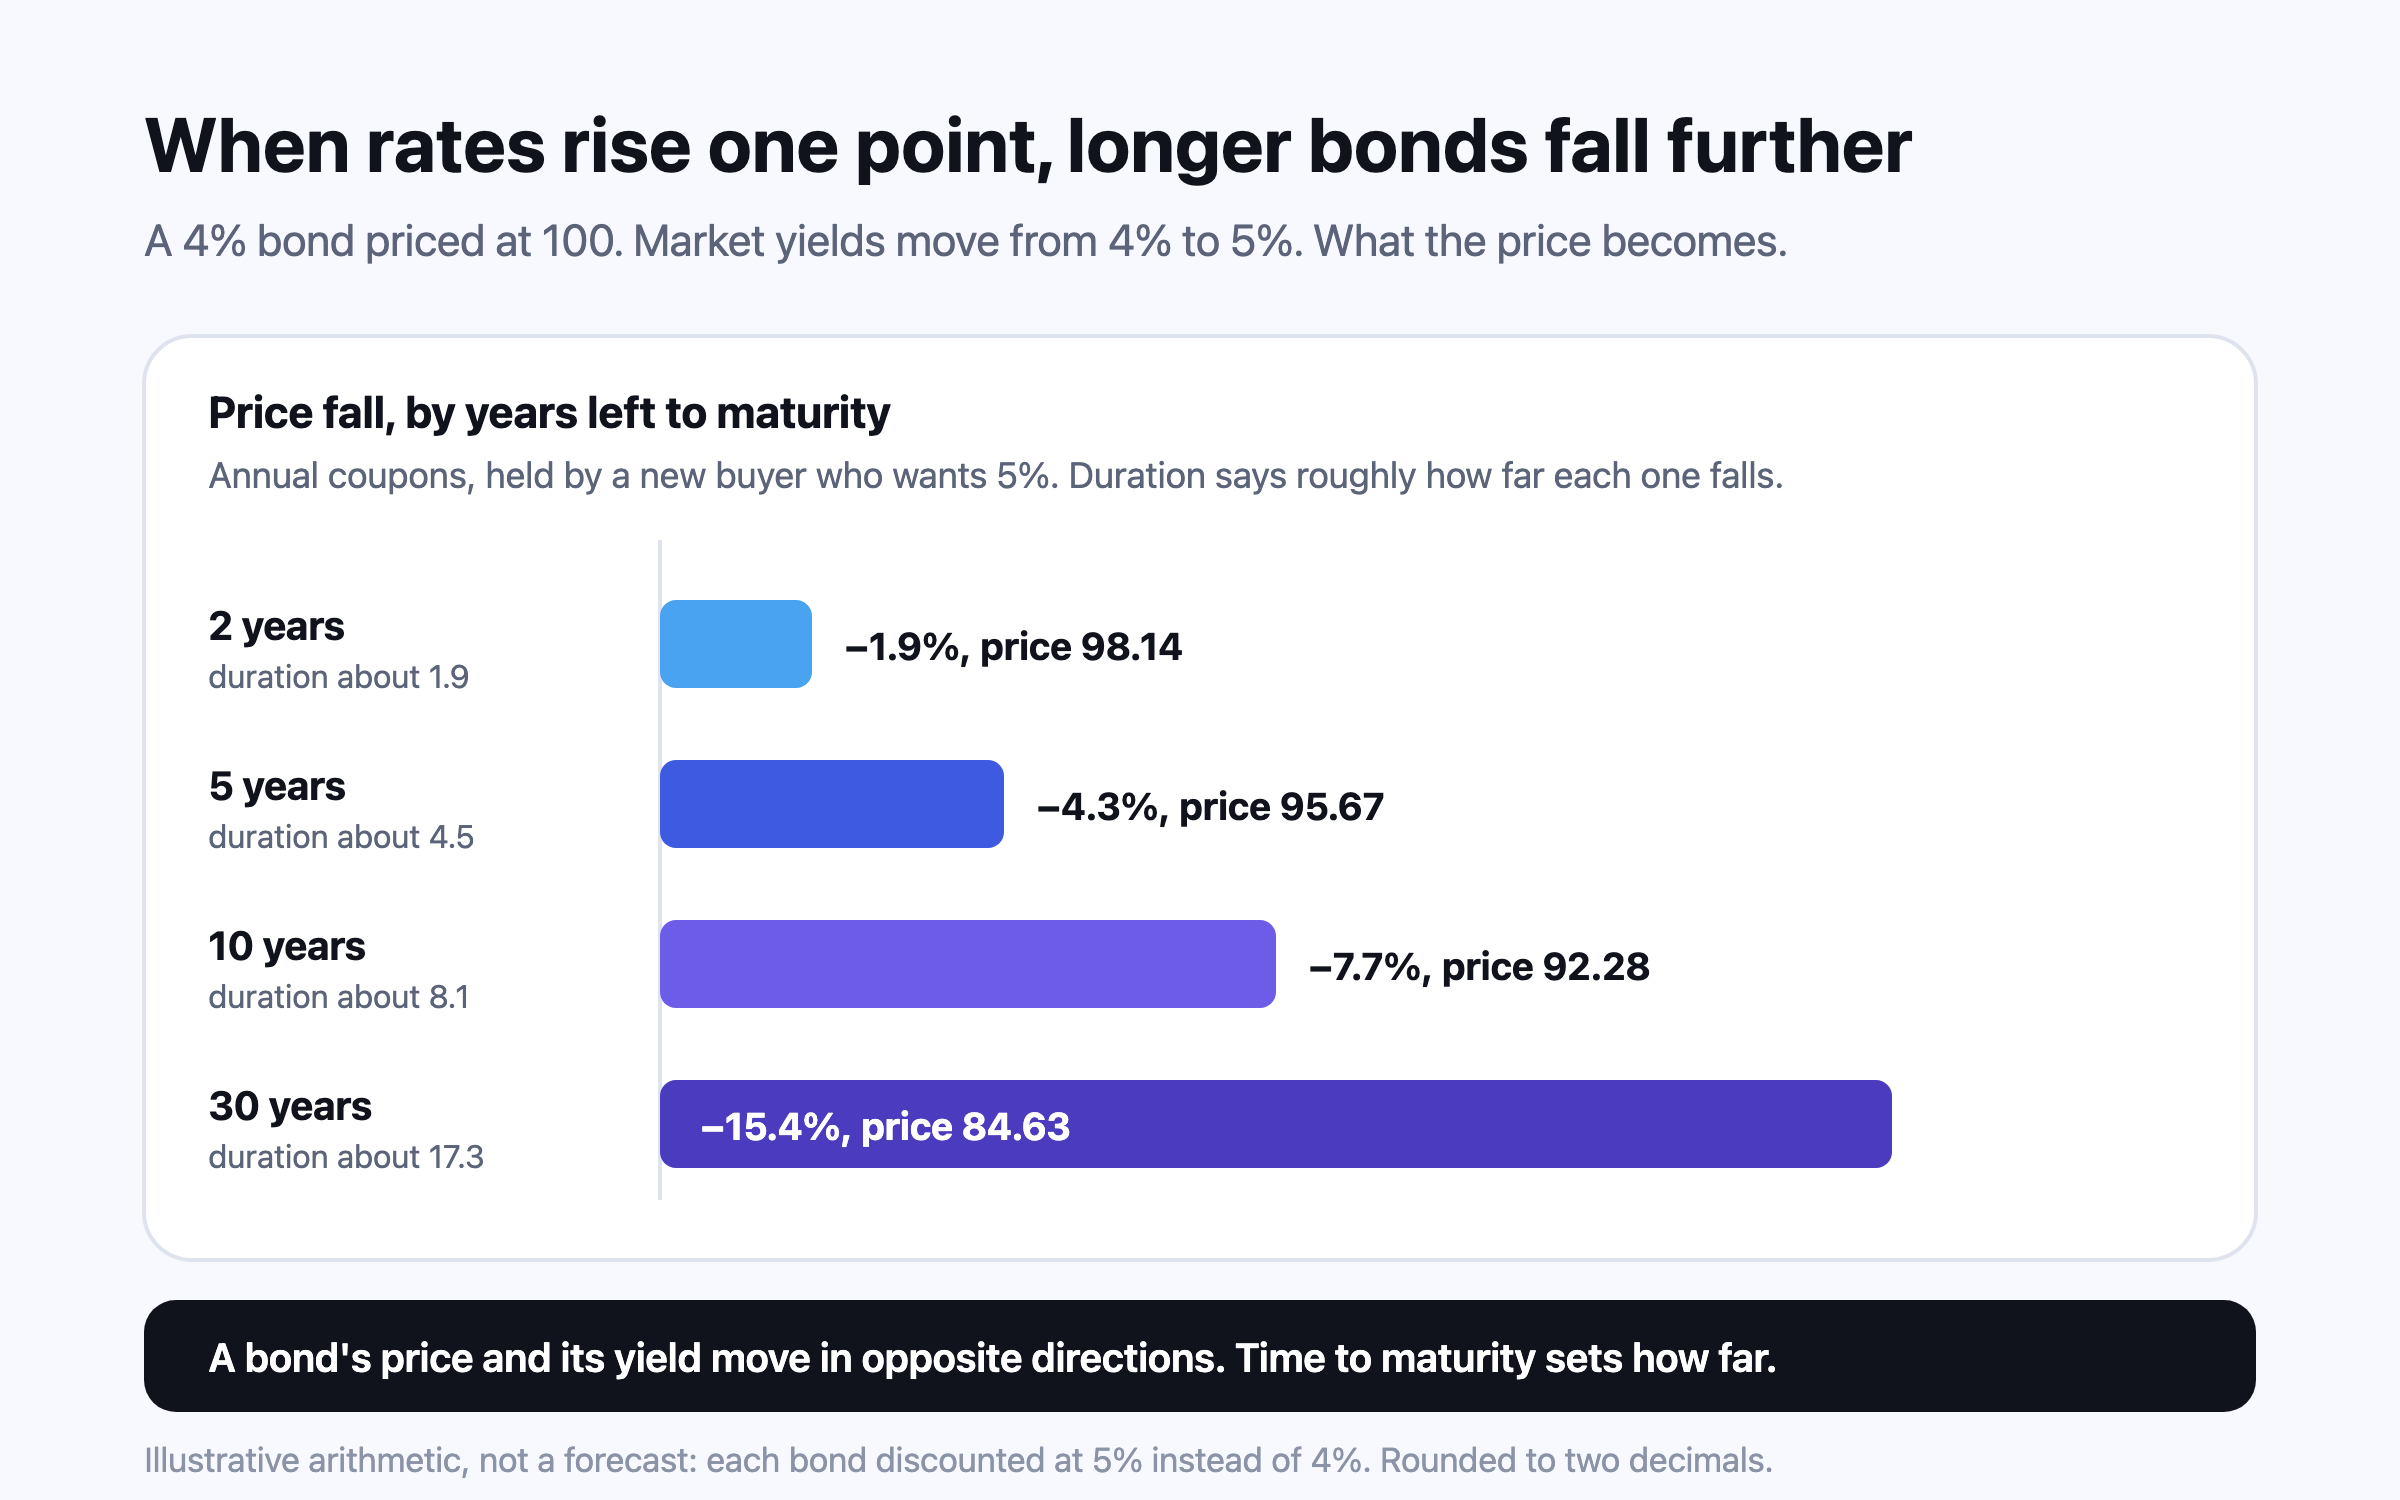
A bond is a loan you can sell. Its coupon is fixed, so when market rates rise its price falls until its yield matches the new rate, by roughly its duration for each percentage point. That is why the US bond market index lost 13.01% in 2022 and UK gilts 23.8%. The same arithmetic now works in savers’ favour: in early October 2026 ten-year government bonds yielded 5.31% in the US, 5.33% in the UK and 7.22% in India.
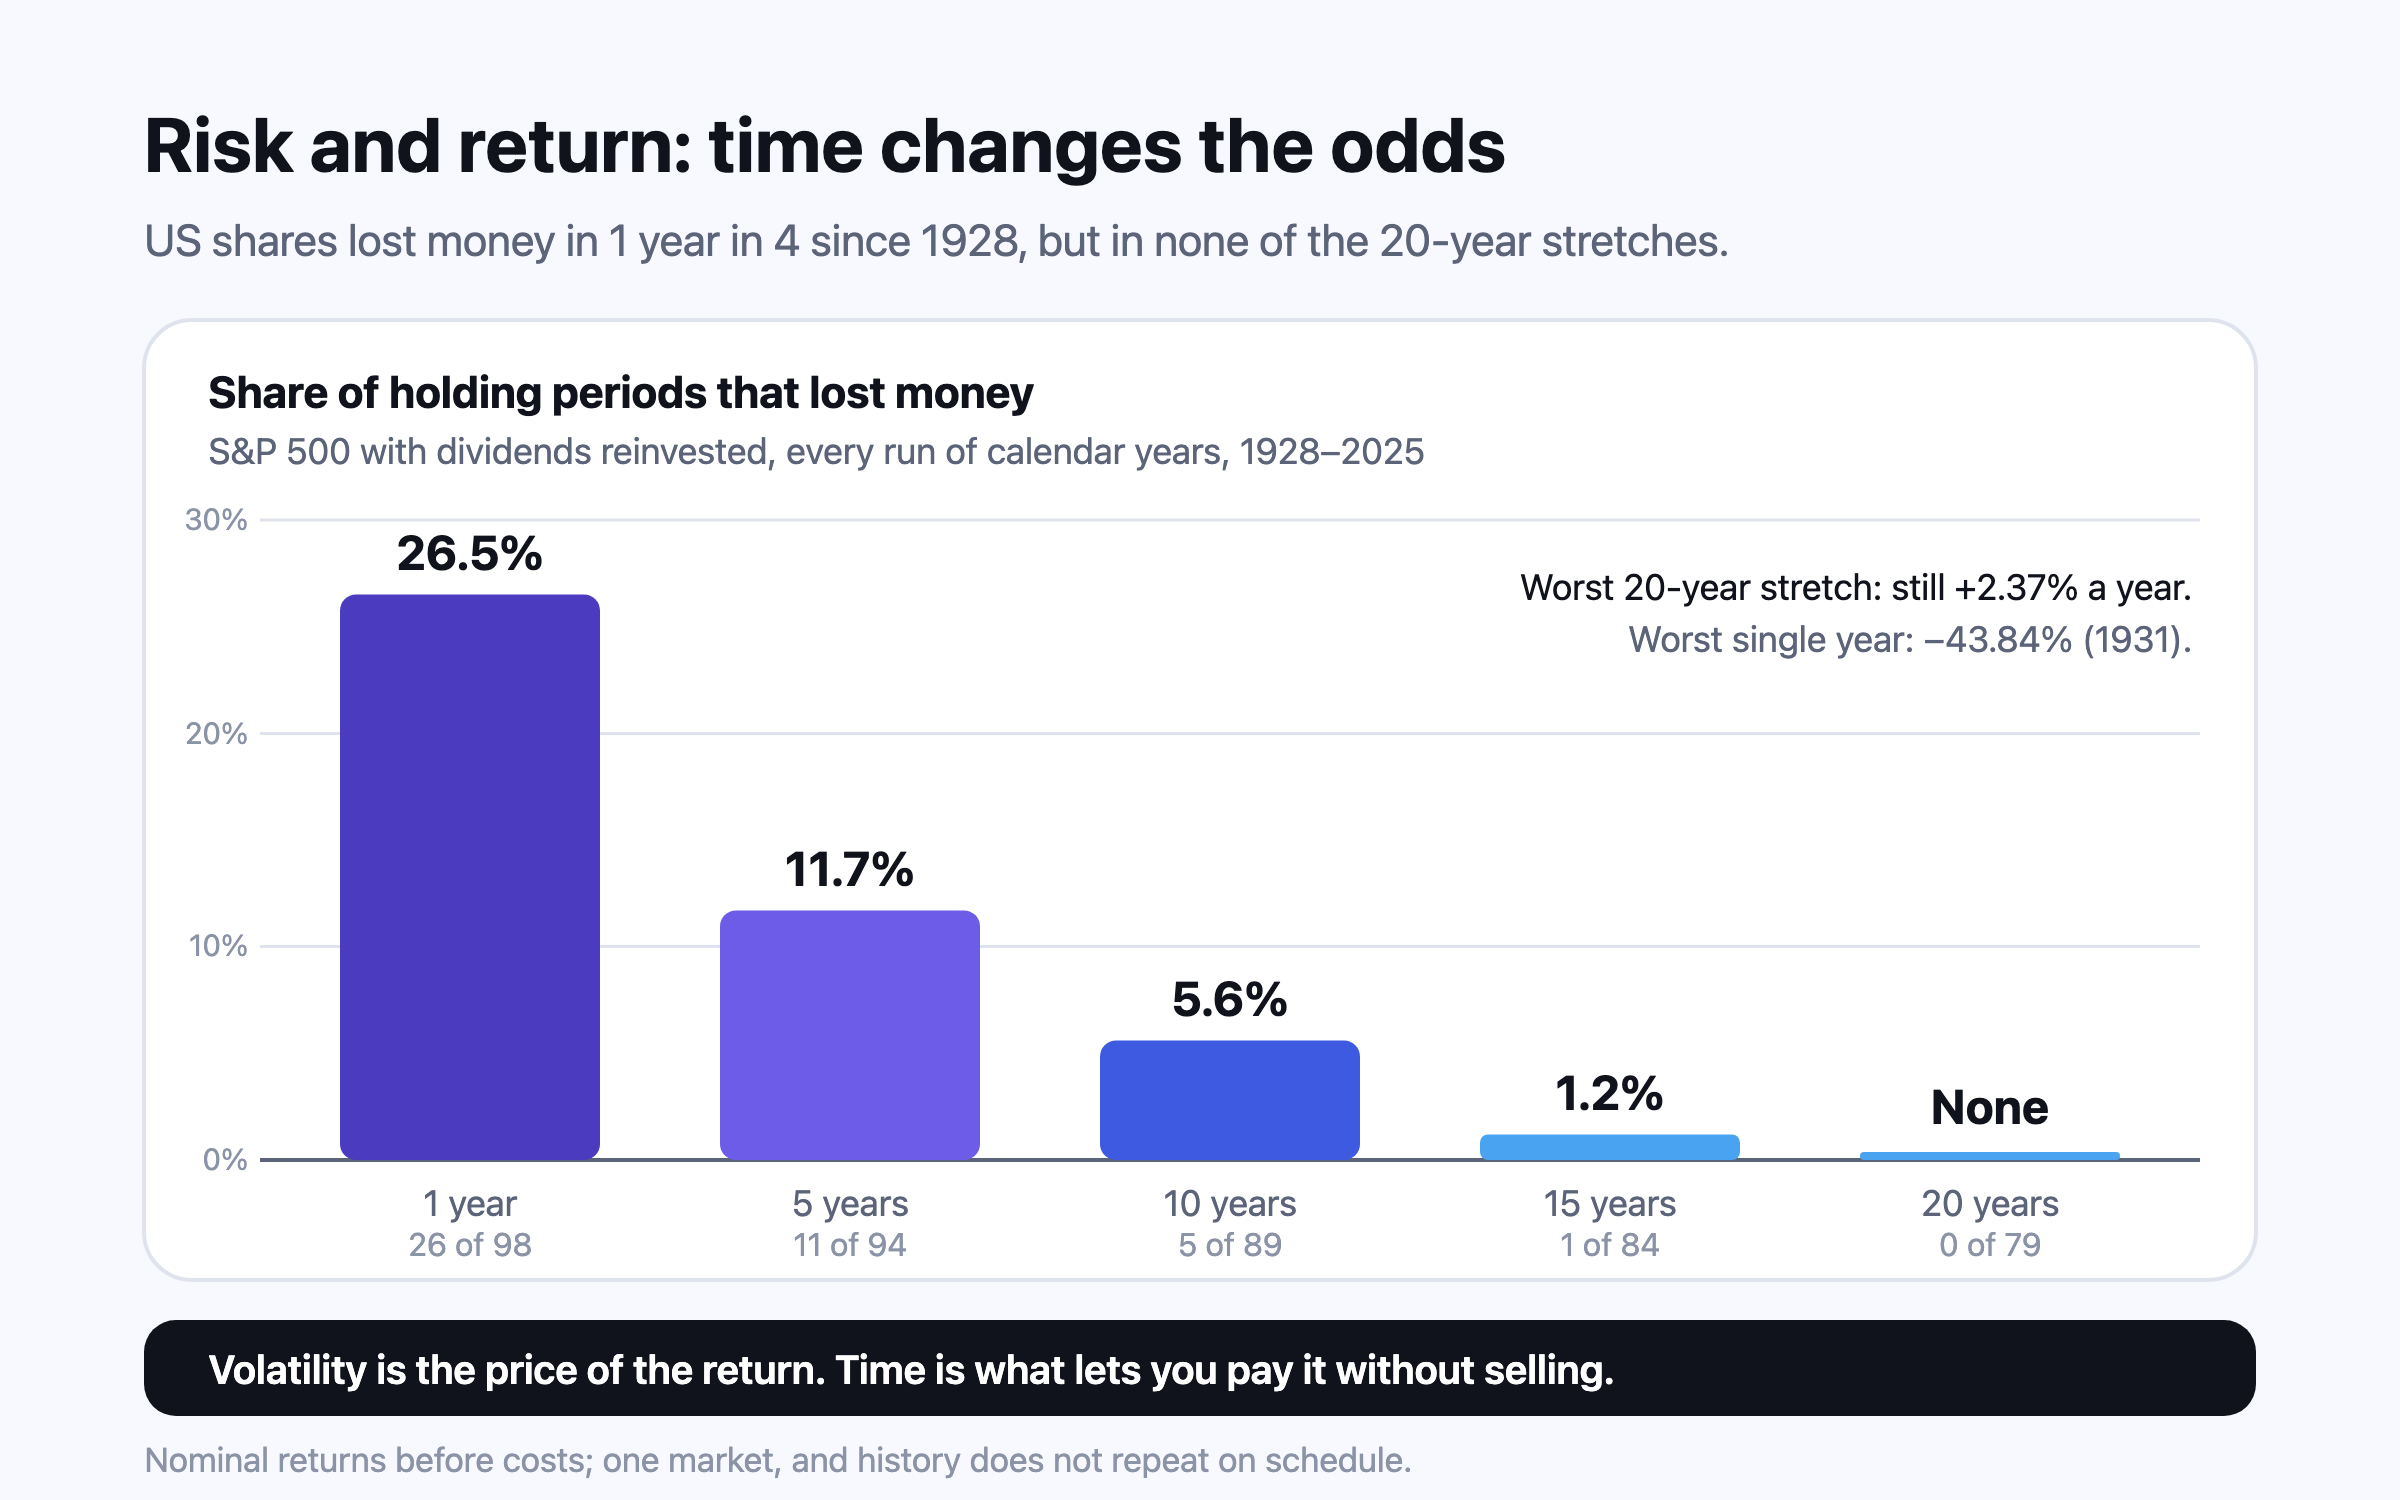
US shares returned about 10% a year from 1928 to 2025 against about 3.4% for Treasury bills, but lost money in 26 of those 98 years and fell 57% from peak to trough in 2007–09. Over every 20-year stretch in that record they still made money. Risk is the price of the extra return: what matters is whether you can afford to wait out a fall and whether you will.
This is general information, not financial, tax or legal advice for your circumstances. Rules and figures change; check the official source for your country, and consult a licensed professional before making financial decisions. Projections are estimates, not predictions.