Shares have been the best-paying asset over 126 years of records, yet most individual shares have done worse than cash, which is why most people own the market rather than a few companies.
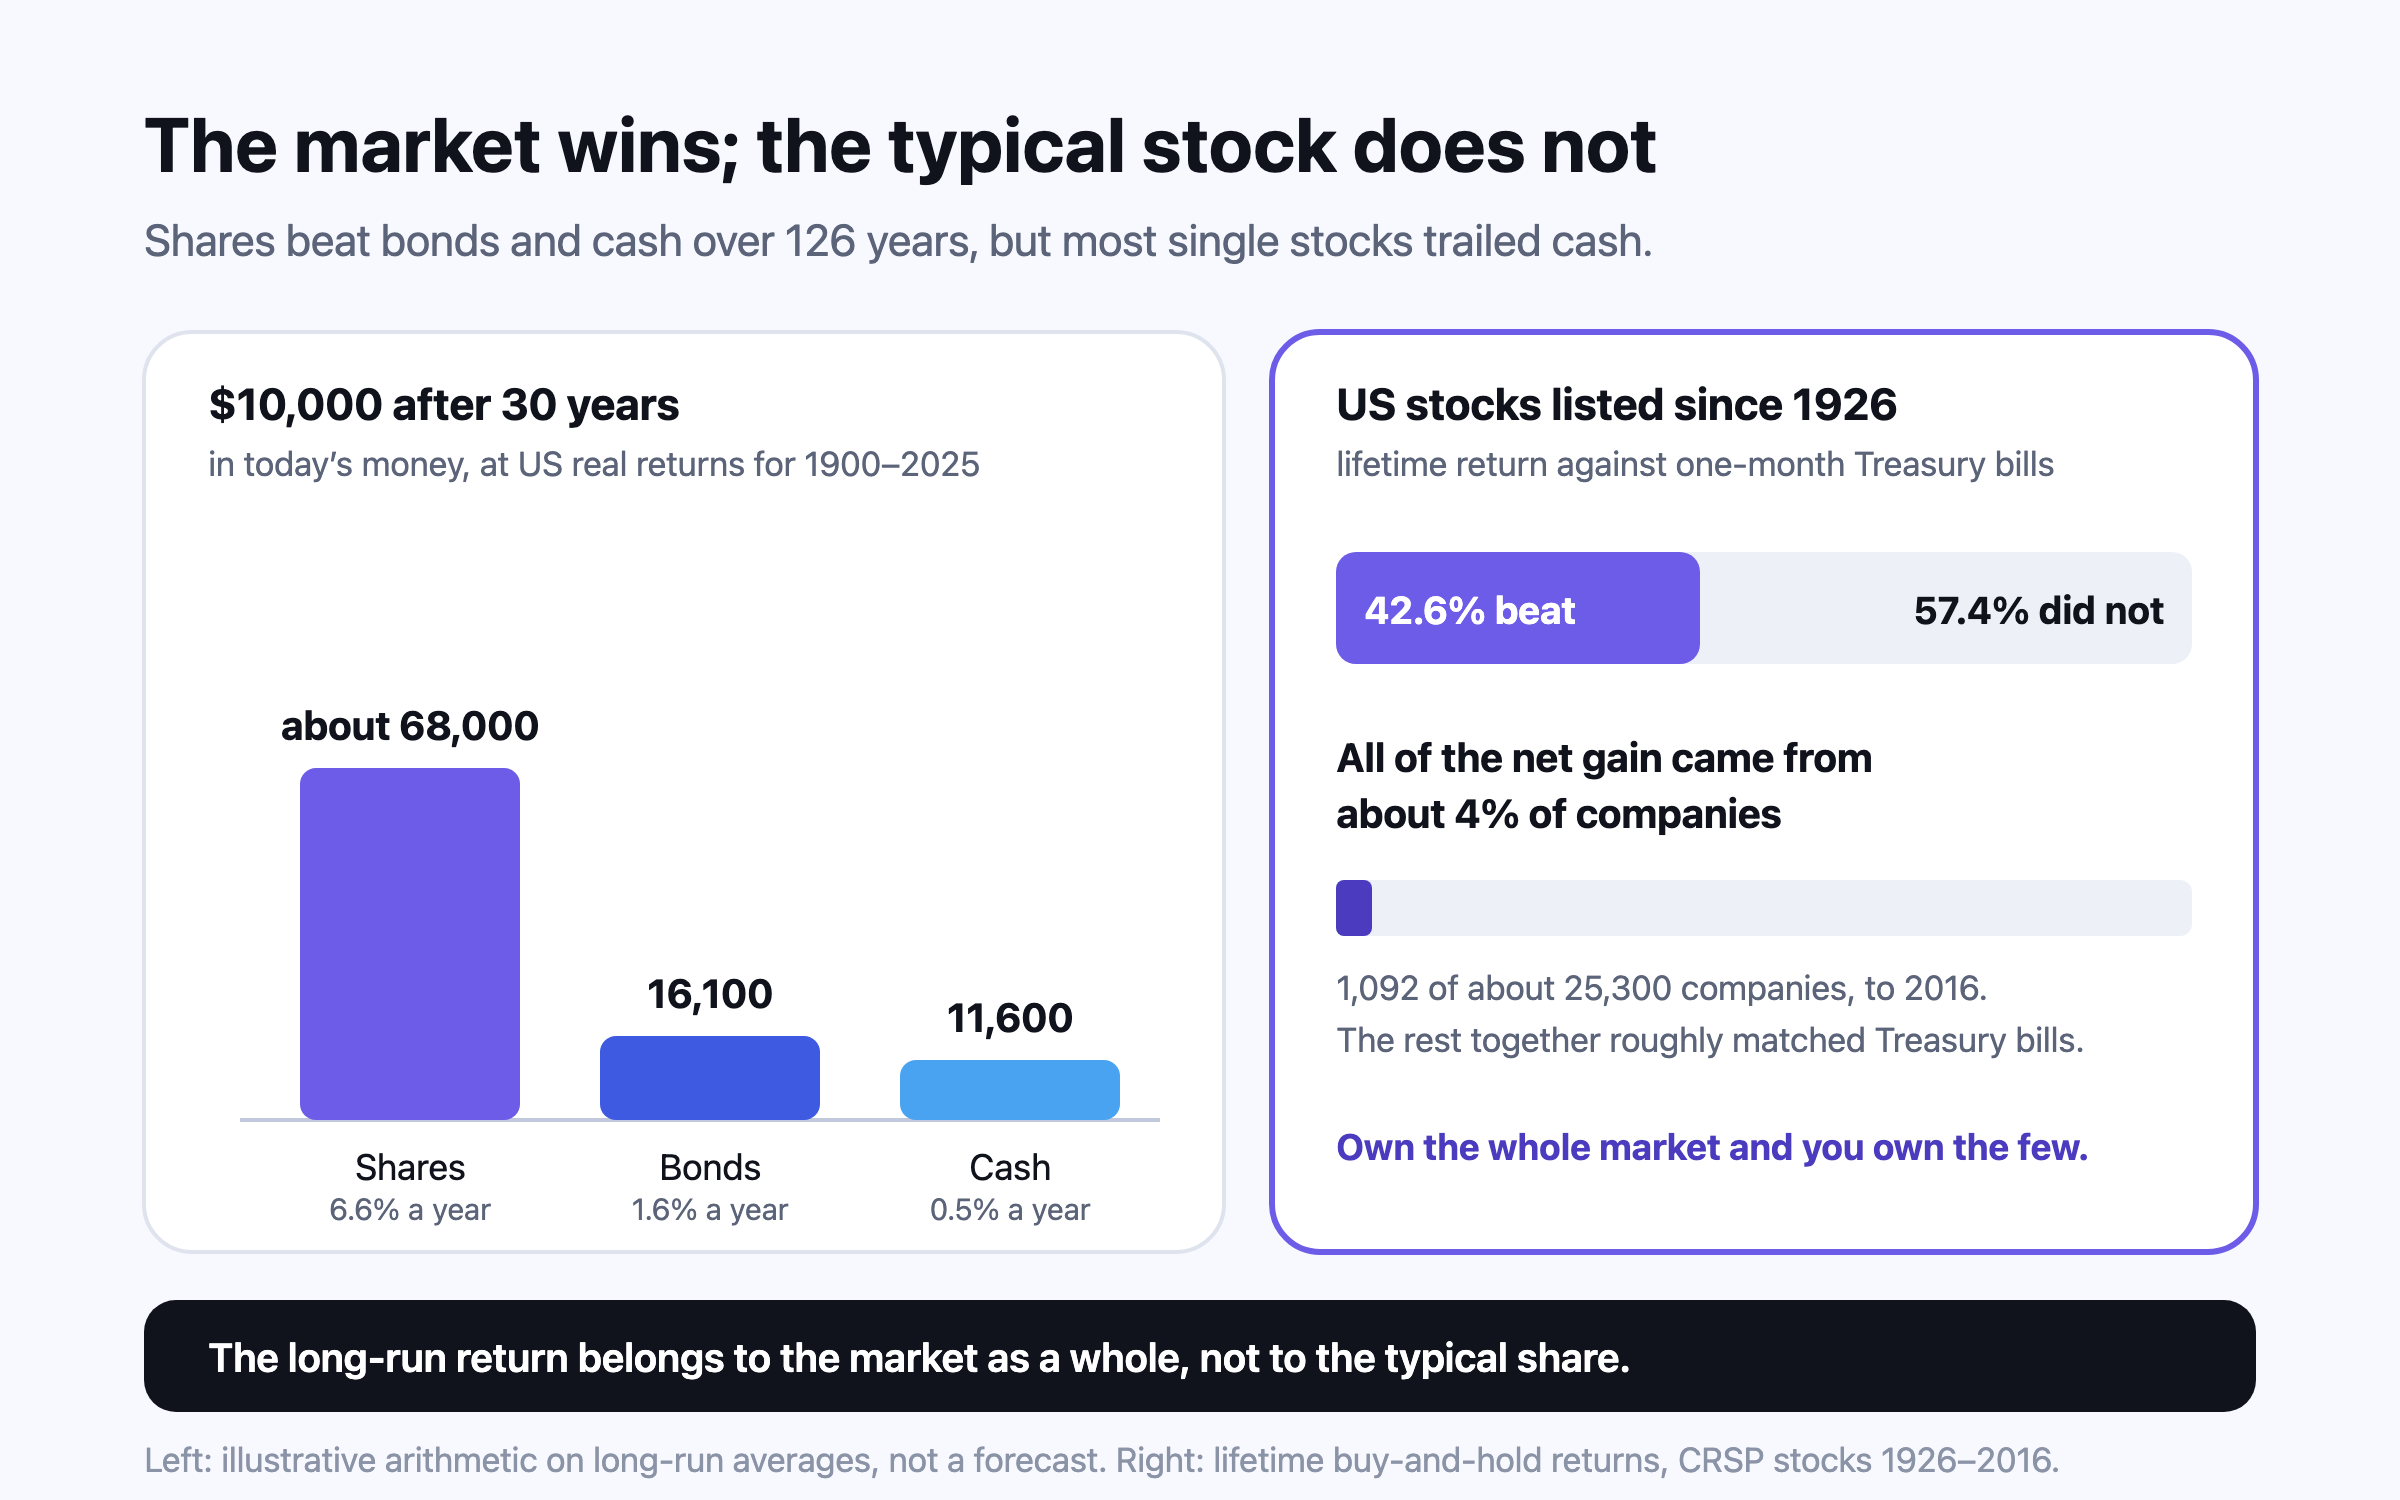
A share is a small part-ownership of a company, bought and sold on an exchange between investors. Over 1900–2025, US shares returned about 6.6% a year after inflation against 1.6% for bonds and 0.5% for cash, and shares were the best asset in every market with a continuous record. But most individual US stocks since 1926 did worse than Treasury bills over their listed lives, and about 4% of companies produced all of the market’s net gain, so the long-run return belongs to the whole market, not to the typical stock.
Nivritee Research · 6 October 2026 · 11 min read
The stock market is two facts that look as if they contradict each other. Over the 126 years from 1900 to 2025, shares were the best-performing asset in all 21 countries with a continuous investment record; in the US they returned about 6.6% a year after inflation, against 1.6% for government bonds and 0.5% for Treasury bills1. Yet a majority of the individual US stocks listed since 1926 delivered less over their lives than those same Treasury bills, and the best-performing 4% of companies account for the whole of the market’s net gain2. Both are true. The rest of this article explains how, starting from what a share actually is.
of the S&P 500 sits in its ten largest holdings, 5 October 2026
What a share is, and what it is not
A company that wants to raise money can borrow it or sell pieces of itself. Each piece is a share: a claim on a slice of the company’s future profits and a vote on how it is run. If a company has issued a billion shares and you own 1,000 of them, you own one millionth of it, and every rupee of profit it makes, whether paid out or kept, is partly yours in that proportion. The price of one share times the number of shares in issue is the company’s market capitalisation, the figure the financial press means when it says a company is “worth” something.
Three things a share is not. It is not a loan: nobody promises to pay it back, and in a bankruptcy shareholders are paid last, after lenders and bondholders. It is not a deposit: there is no insurance scheme behind it. And it is not money the company receives when you buy. The company is paid once, when it first sells shares to the public in an initial public offering or a later share issue. Almost every trade after that is between investors, which is why it is called the secondary market: when you buy shares in a bank through your broker, the money goes to another investor who was selling, not to the bank.
One reassurance that beginners often look for is real. Shares in a listed company carry limited liability: if you buy shares outright with your own cash, the most you can lose is what you paid. You cannot be asked to cover the company’s debts. Losses beyond what you put in come from borrowing to invest, short selling or derivatives, not from owning shares.
Where shares trade: the exchanges
An exchange is a regulated marketplace that matches buyers and sellers and publishes the prices at which they trade. A company “listed” on it has met the exchange’s rules on size, disclosure and governance. The largest are in the US: by the end of June 2026 the companies on Nasdaq were worth about $43.6 trillion and those on the NYSE about $33.3 trillion5. The table puts the markets this article covers side by side.
Domestic market capitalisation in US dollars and listed companies (domestic plus foreign), from the World Federation of Exchanges. Most large Indian companies are listed on both BSE and NSE, so the two Indian figures overlap rather than add up. The London Stock Exchange is not in this series. 5
When you buy, the trade is agreed instantly but the money and the shares change hands a little later, on the settlement date. India moved all shares to next-day settlement (T+1) in January 2023 and has offered optional same-day settlement for a limited set of stocks since March 20246. Canada moved to T+1 on 27 May 2024 and the US on 28 May 202478. The UK plans to follow on 11 October 20279, while Australia still settles in two business days10. For an investor the practical consequence is small: the cash from a sale is usable a day or two after you sell, not the same minute.
Who sets the price, and what moves it
Nobody sets a share price. At every moment the exchange holds an order book: the highest prices buyers are bidding and the lowest prices sellers are asking. A trade happens when a bid meets an ask, and the last traded price is the price you see. If more people want to buy at today’s price than to sell, buyers must bid higher to get filled and the price rises; if sellers are keener, it falls. The gap between the best bid and the best ask, the spread, is a cost every buyer pays and is usually tiny in large companies.
What makes people want to buy or sell is a view of the company’s future profits, and how much those profits are worth today. That second part is why interest rates matter so much: when safe government bonds pay more, a stream of uncertain future profits is worth less in comparison, so share prices tend to fall when rates rise sharply. The Yearbook authors find that real returns on both shares and bonds have tended to be higher when economic growth was higher and inflation lower1. Everything else, from an earnings report to a war, matters through the same channel: what it does to expected profits and to the return investors demand for bearing the risk.
Expectations move faster than businesses. In the nine months to 30 September 2026, India’s Nifty 50 fell 13.43% in price terms11, while Singapore’s Straits Times Index returned 26.5% including dividends12. Neither country’s companies changed that much as businesses in nine months; a gap that size mostly reflects investors changing what they will pay for the same profits. Falls can be steep: the S&P 500 lost 57% between 9 October 2007 and 9 March 2009, and 34% in the 33 days from 19 February to 23 March 202013. The market crash guide covers what the evidence says about holding on through one.
How shareholders get paid: dividends and buybacks
A company can do three things with its profit: reinvest it in the business, pay it out as dividends, or use it to buy back its own shares. A buyback reduces the number of shares in issue, so each remaining share owns a larger slice of the company; for an investor who does not sell, it works like a dividend that is reinvested automatically. US companies now return more through buybacks than dividends. In the twelve months to September 2025, S&P 500 companies spent $1.020 trillion on buybacks and $664.9 billion on dividends, a combined $1.685 trillion14.
The dividend yield is a year’s dividends as a share of the price. The S&P 500 yielded 1.10% on 2 October 20264 and the Nifty 50 1.22% at the end of September11. Low yields do not mean shareholders are short-changed; they mean more of the return arrives as rising prices, partly because of buybacks and reinvestment. What matters over decades is total return: price change plus dividends, with dividends reinvested. Every long-run figure in this article is a total return.
Hannah and Marcus Weber, 44 and 46, in Austin, hold $60,000 in an S&P 500 index fund in a taxable account and want to know what it pays them. At a 1.10% yield, that is about $660 a year in dividends4, small next to what the holding might rise or fall in a single month. Choosing shares for their income alone would mean choosing a narrower set of companies, mostly older ones; the money from a fund’s rising price is just as spendable when they sell a slice.
What 126 years of returns say
The longest consistent record of returns across countries is the database built by Elroy Dimson, Paul Marsh and Mike Staunton, published each year as the UBS Global Investment Returns Yearbook. It covers shares, bonds, cash, currencies and inflation in 35 countries since 19001. In the US, one dollar put into shares at the start of 1900 had grown to $124,854 by the end of 2025, against $284 in long-term government bonds and $69 in Treasury bills, while the price level rose about 38-fold1. In nominal terms that is 9.8% a year for shares against 2.9% inflation1.
Real (after-inflation) annualised returns from the 2026 Yearbook; the last column is illustrative arithmetic, $10,000 × (1 + rate) to the 30th power, not a forecast. Thirty-year periods vary widely around these averages. 1
Asset (US, 1900–2025)
Real return a year
$10,000 after 30 years at that rate, in today’s money
Shares
6.6%
about $68,000
Long-term government bonds
1.6%
about $16,100
Treasury bills (cash)
0.5%
about $11,600
Jeremy Siegel of Wharton, whose book *Stocks for the Long Run* made this argument famous, puts the real return on US shares since 1802 at 6.7% a year, a figure he says barely moved through the financial crisis and the pandemic15. The case does not rest on America alone: shares beat bonds and cash in all 21 Yearbook countries with continuous histories, and bonds beat cash everywhere except Portugal1. For how markets outside the US fared, and why spreading across them matters, see 125 years of global diversification.
The price of that return is the ride. Since 1900, shares and bonds have each lost more than 70% in real terms on several occasions, while a 60:40 mix of the two never fell more than 50%1. A long-run average is made of good and terrible decades, and an investor who needs the money in the middle of a terrible one does not get the average. That is the reason money needed within a few years usually sits somewhere other than shares; see asset allocation by age and risk and return, explained.
One caution on the headline numbers: the US is the best-documented market and also one of the most successful, and it now makes up around 62% of world equity value1. Concentration was at its highest for at least 100 years by the end of 20251, and railways, 63% of the US market in 1900, are under 1% today1. The market rewarded owners of shares; it did not reward owners of whichever industry looked safest at the time.
The catch: most single stocks lose to cash
Hendrik Bessembinder of Arizona State University followed every US common stock in the CRSP database from 1926, about 25,300 companies, over its whole listed life. Only 42.6% delivered a lifetime buy-and-hold return above one-month Treasury bills; slightly more than four in seven did not2. 11.83% of them, 3,071 stocks, lost essentially everything2. The roughly $35 trillion of wealth the US market created for shareholders by the end of 2016 came from very few firms: the top 90 companies accounted for over half of it, and the top 1,092, slightly more than 4%, for all of it, the rest collectively matching Treasury bills2.
His later study of over 64,000 stocks around the world from 1991 to 2020 found the same shape: 55.2% of US stocks and 57.4% of non-US stocks underperformed one-month US Treasury bills, and the top 2.4% of firms accounted for all of the $75.7 trillion in net wealth created3. Returns are skewed: a few enormous winners pull the average far above the typical stock. The average return of the market is real, but a portfolio of five or ten stocks has a good chance of missing the few that produce it.
This is the strongest argument for owning a whole market through an index fund, and it does not depend on fund managers being incompetent. A fund that holds every company is certain to hold the rare winners. For what active funds achieve against their indices after costs, see index vs active funds: the SPIVA data.
Rajesh and Anita Menon, 45 and 43, in Hyderabad, hold 40% of their investments in the shares of Rajesh’s employer, built up over twelve years of stock grants. If that one company fell 60%, which ordinary companies do, their whole portfolio would fall 24% before anything else moved, and the same event could put Rajesh’s salary at risk. Nothing in Bessembinder’s research says Rajesh’s employer is a poor company. What it shows is that the odds on any single company are worse than they look2, which is a reason to decide deliberately how much of it to keep rather than letting twelve years of grants decide.
Indices: how the market is measured
An index is a list of companies and a rule for weighting them, recalculated through the day. Most major indices weight each company by its market value counting only shares freely available to trade (free float), so the largest companies move the index most. An index fund or ETF simply buys the companies on the list in the same proportions.
Weights summed from each factsheet’s published list of largest holdings; they move daily. 4161112
Index
What it holds
Concentration at the latest factsheet
S&P 500 (US)
Large US companies, float-adjusted market-cap weighted; 504 holdings in the tracking fund
Top 10 holdings: 39.25% (5 Oct 2026)
FTSE 100 (UK)
The 100 largest companies on the London Stock Exchange that pass size and liquidity screens
Top 5: 33.37%, HSBC alone 10.19% (28 Aug 2026)
Nifty 50 (India)
50 large NSE companies, free-float weighted, rebalanced twice a year
Top 10: 52.27%; financial services 37.45% (30 Sep 2026)
Straits Times Index (Singapore)
The 30 largest and most liquid SGX companies, free-float weighted
DBS, OCBC and UOB together: 59.13% (30 Sep 2026)
The table holds a lesson that surprises people who think an index is automatically diversified. In Singapore, three banks are 59.13% of the Straits Times Index12; in India, financial companies are 37.45% of the Nifty 5011; in the US, nine companies (Alphabet has two share classes) make up 39.25% of the S&P 5004. Wei Jie and Hui Min Tan, 36 and 34, in Singapore, who hold an STI fund and DBS shares through Wei Jie’s employee scheme, own a large bet on Singapore’s banks twice over. A home index is one country’s mix of industries, which is why home bias is worth checking.
How to actually buy a share
In every country the route is the same: open an account with a regulated broker, prove who you are, move money in, and place an order. Where countries differ is in the plumbing and the taxes on a purchase. In India, shares are held electronically in a demat account with a depository participant, linked to a trading account at a broker; the NSDL depository alone had 4.72 crore active client accounts at 30 September 202617. In the UK, buying shares in a UK company usually costs 0.5% in stamp duty reserve tax18. In Australia, the ASX says you can start with as little as A$500 plus brokerage, and that buying or selling through a broker can cost less than A$2019.
Choose a broker regulated in your country (SEBI, the FCA, FINRA and the SEC, CIRO, ASIC or MAS) and check what it charges per trade and per year.
Open the account: identity and address checks, a tax number (PAN in India, National Insurance in the UK), and in India a demat account alongside the trading account.
Decide the account wrapper before the investment: an ISA in the UK, a TFSA or RRSP in Canada, an IRA in the US, super in Australia, CPF or SRS in Singapore all change the tax you pay.
Place a limit order (the highest price you will pay) rather than a market order, especially in smaller companies where the spread is wide.
Record what you paid, including charges, so your real return can be worked out later.
Illustrative trades using each country’s published rates: India’s securities transaction tax and stamp duty as NSE publishes them for delivery purchases from 1 April 2026, UK stamp duty reserve tax, and the SEC’s Section 31 rate from 4 April 2026, which brokers usually pass on to the seller. Brokerage is extra everywhere and varies by provider; the A$20 fee is an assumption to show the effect of a flat fee on a small trade. 2021181922
Trade
Charge on the trade
Amount
Rohan, Bengaluru: 20 shares at ₹2,500 (₹50,000)
STT 0.1% and stamp duty 0.015%, plus brokerage
₹50 STT and ₹7.50 stamp duty
Emma, Leeds: £5,000 of a UK-listed company
Stamp duty reserve tax 0.5%
£25
Liam and Chloe, Brisbane: a first A$500 parcel
A broker fee of, say, A$20
4% of the purchase
The Webers, Austin: selling $10,000 of shares
SEC Section 31 fee, $20.60 per million sold
about 21 cents
The Brisbane row is the one to notice. A flat fee is trivial on a large purchase and heavy on a small one, so beginners with little to invest are often better served by fewer, larger purchases or by a fund bought without a per-trade fee. Costs compound; see what fees cost over 30 years and, when you are ready to start, how to start investing.
Who owns shares, and how
Most households own shares indirectly. In the US, 58% of families held stocks directly or through funds and retirement accounts in 2022, but only 21% held any company’s shares directly23. In the UK, individuals held just 11.6% of the value of UK-listed shares at the end of 2024, while overseas investors held a record 58.8%24. In Australia, ASX’s 2023 investor study found 51% of adults holding investments beyond their home and super, and 7.7 million holding investments on an exchange25. The pattern is consistent: ordinary savers mostly reach the stock market through pension schemes and funds, which is where the next articles in this series go: mutual funds, ETFs and bonds.
Putting it to work in your own plan
Questions people ask
What is a share in simple terms?
A share is a small piece of ownership in a company: a claim on part of its future profits and a vote at its meetings. The company’s market value is the share price multiplied by the number of shares in issue.
Does the company get my money when I buy its shares?
Usually not. A company receives money only when it issues shares, for example at an IPO. Almost every later trade is between two investors on an exchange, so your money goes to the seller.
Can I lose more than I invest in shares?
Not if you buy shares outright with your own money: limited liability caps the loss at what you paid. Losses beyond that come from borrowing to invest, short selling or derivatives.
What return have stocks given over the long run?
In the US, shares returned about 6.6% a year after inflation from 1900 to 2025, against 1.6% for government bonds and 0.5% for Treasury bills1. Shares were the best asset in all 21 countries with a continuous record, but with falls of more than 70% in real terms along the way1.
Is it better to buy individual stocks or an index fund?
The evidence favours owning many companies for most people. Only 42.6% of US stocks since 1926 beat Treasury bills over their lives, and about 4% of companies produced all the market’s net gain2, so a small portfolio can easily miss the few winners an index fund is sure to hold.
What is the difference between the Sensex, Nifty 50 and S&P 500?
Each is an index, a weighted list of companies used to measure a market. The Nifty 50 holds 50 large NSE companies and the Sensex 30 on BSE; the S&P 500 holds about 500 large US companies, with its top ten holdings at 39.25% of the index in October 20264.
Do I need a demat account to buy shares in India?
Yes. Indian shares are held electronically, so you need a demat account with a depository participant and a trading account with a broker, usually opened together17.
What does T+1 settlement mean?
It means the shares and cash change hands one business day after the trade. India completed the move to T+1 in January 2023, the US and Canada in May 2024, and the UK plans to on 11 October 2027; Australia settles at T+268910.
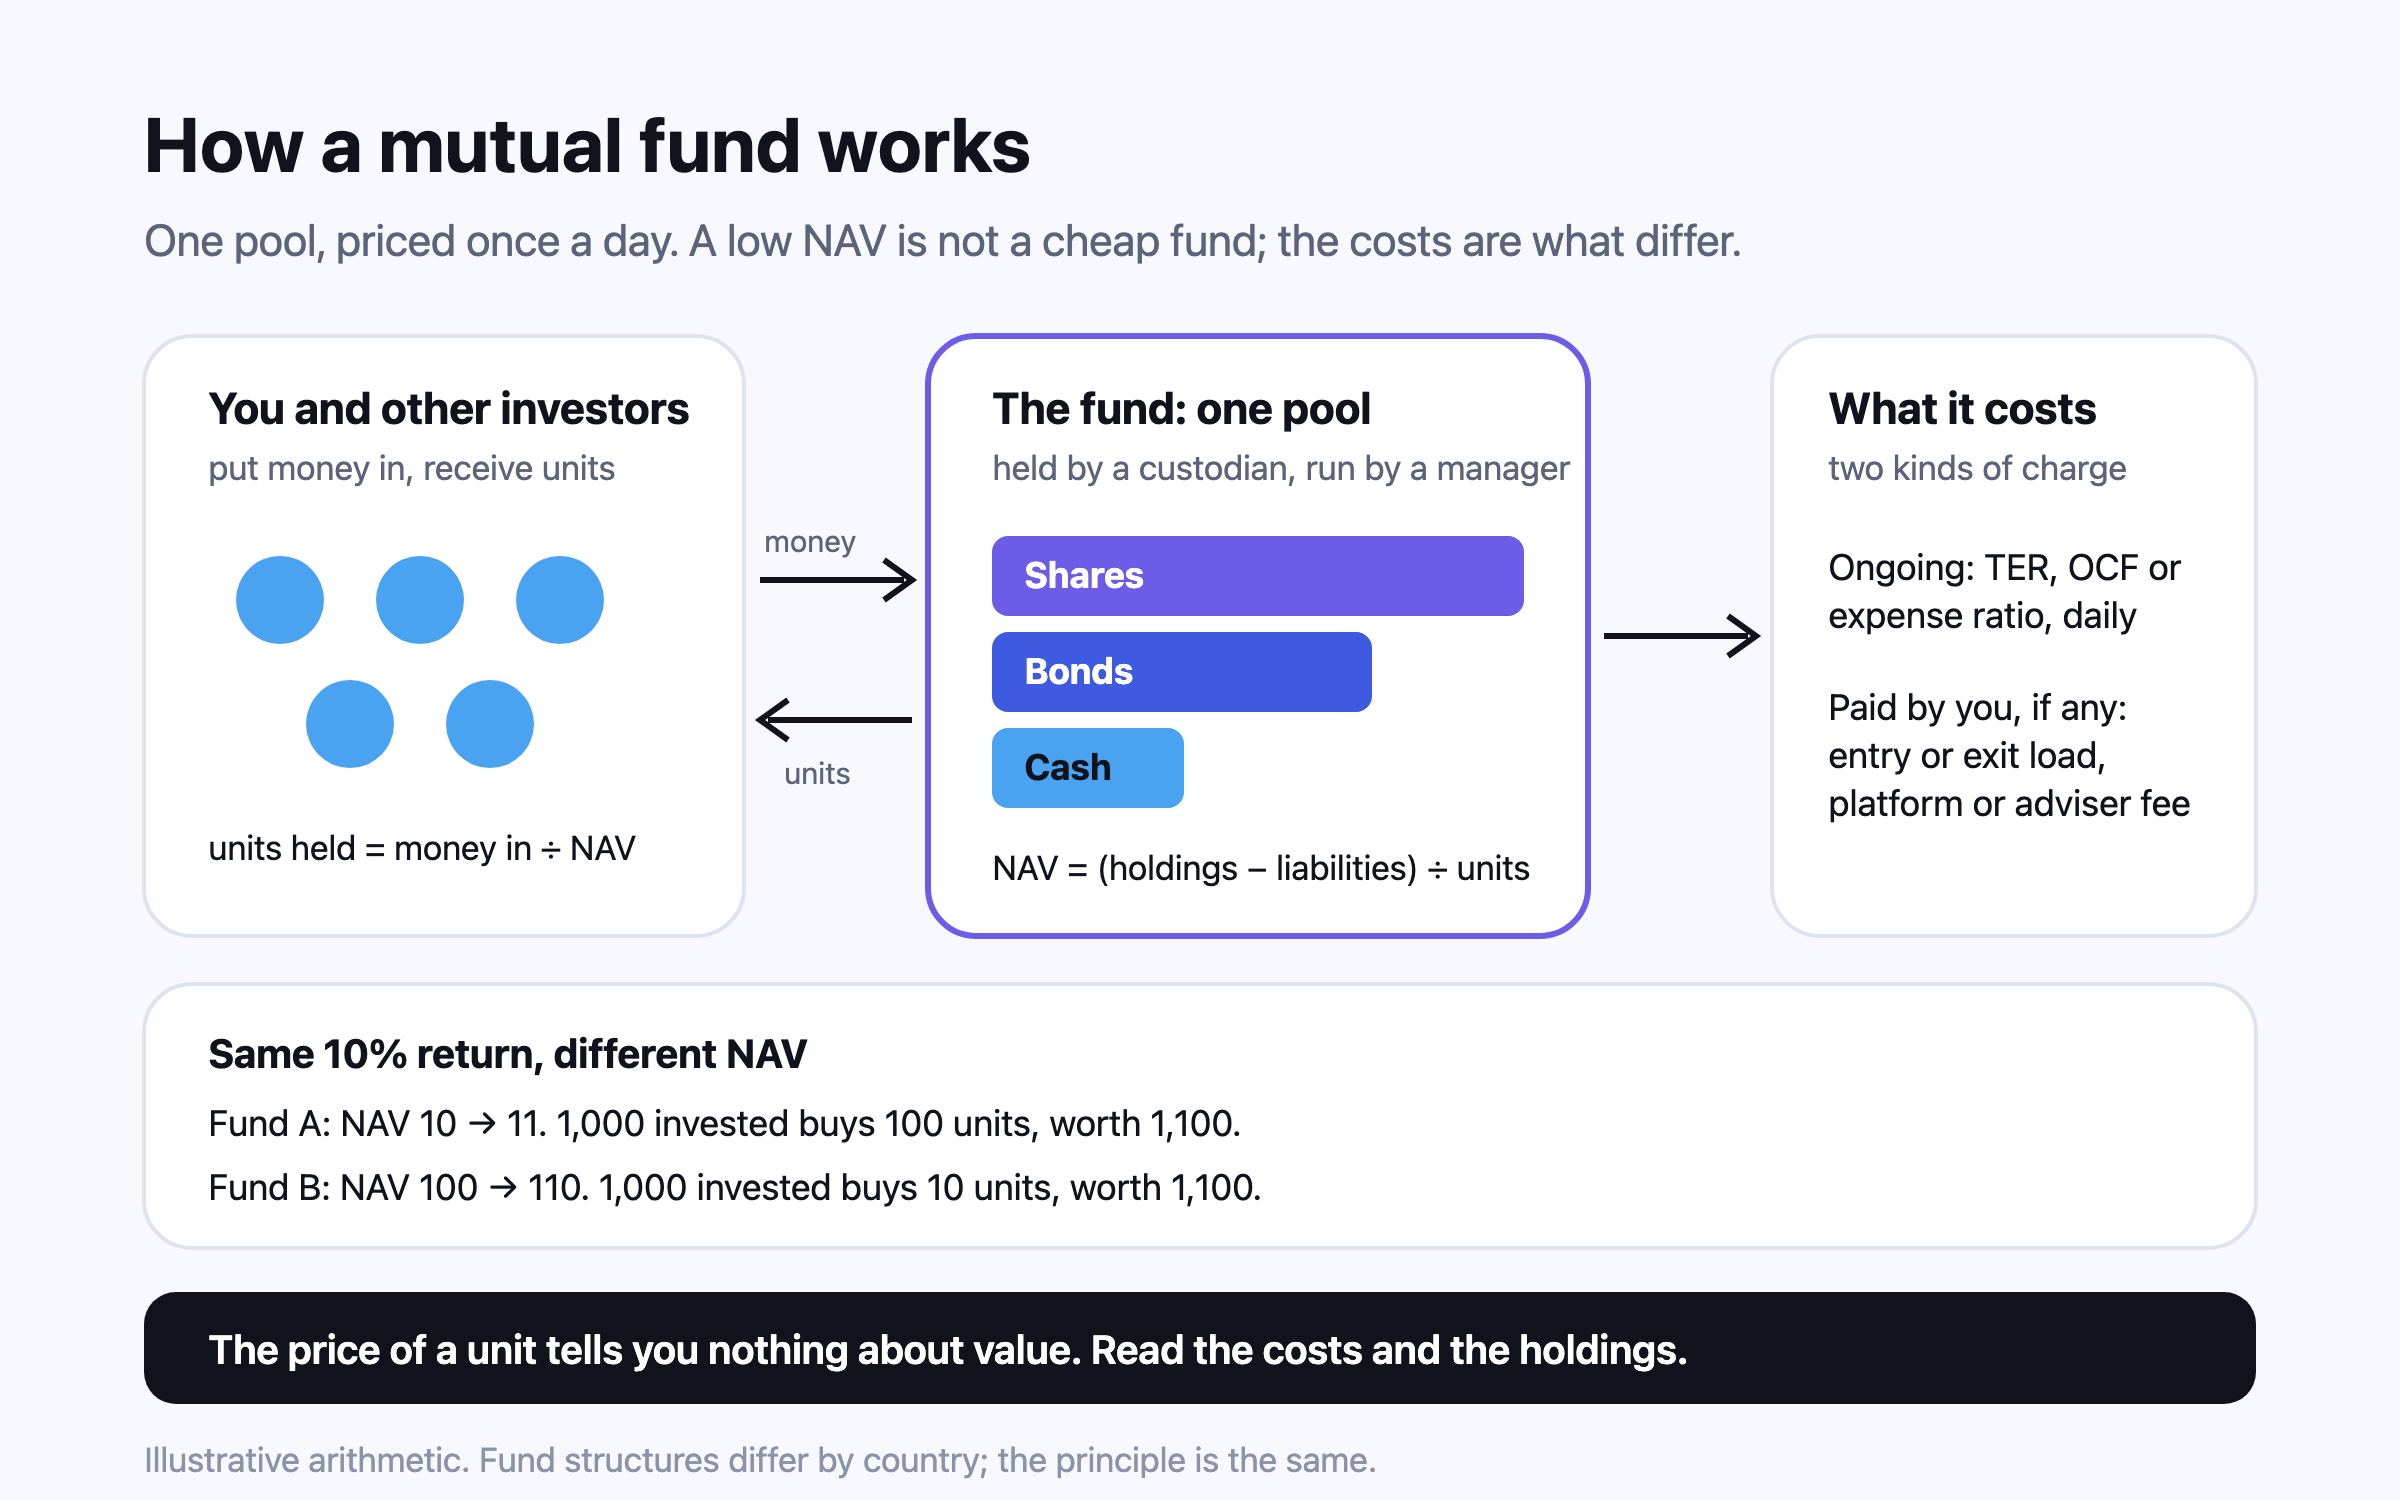
A mutual fund pools many investors’ money into one portfolio and issues units priced at the net asset value (NAV) once a day. The NAV itself says nothing about value; the costs and the holdings do. A yearly charge of 0.9% instead of 0.1% leaves about 17% less after 25 years, most active funds trail their index over long periods, and index mutual funds and index ETFs together held 52% of US long-term fund assets at the end of 2025.
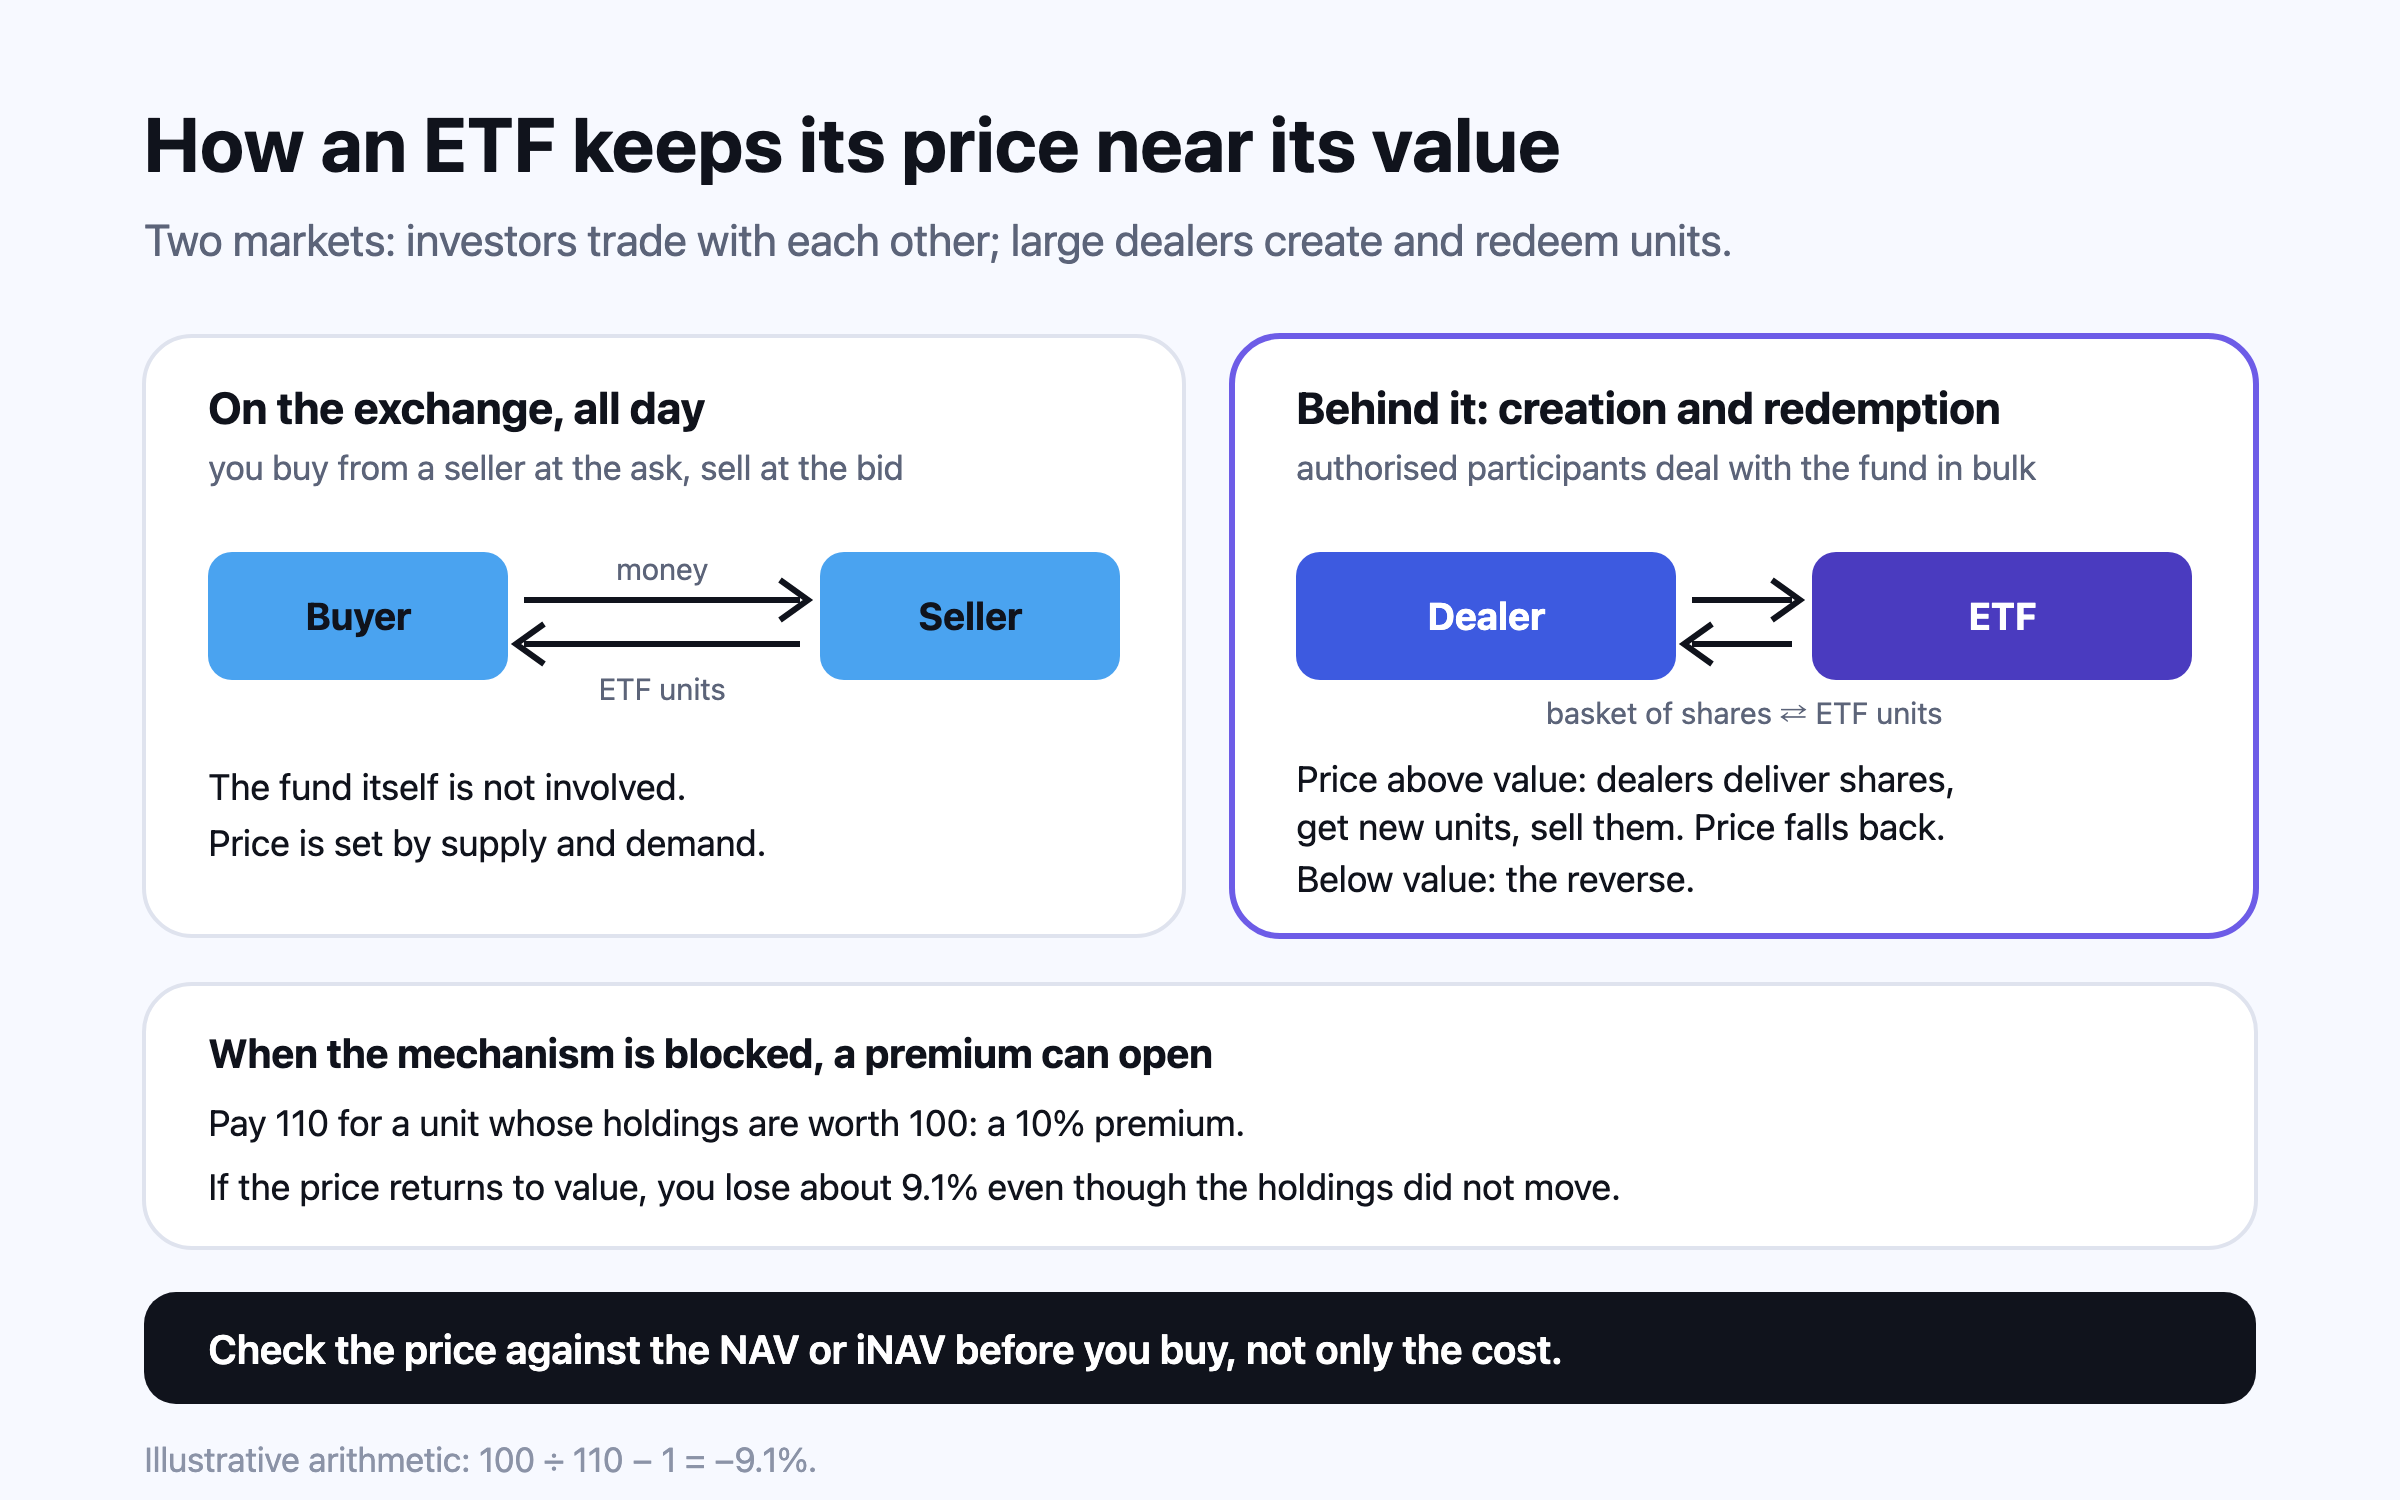
An exchange-traded fund holds a portfolio like a mutual fund but trades on a stock exchange all day. Large dealers create and redeem units to keep its price close to the value of its holdings; when that mechanism is blocked, as for India’s international ETFs in September 2026, prices can run far above value. For investors outside the US, the fund’s domicile decides how much dividend tax is withheld and whether US estate tax applies above US$60,000.
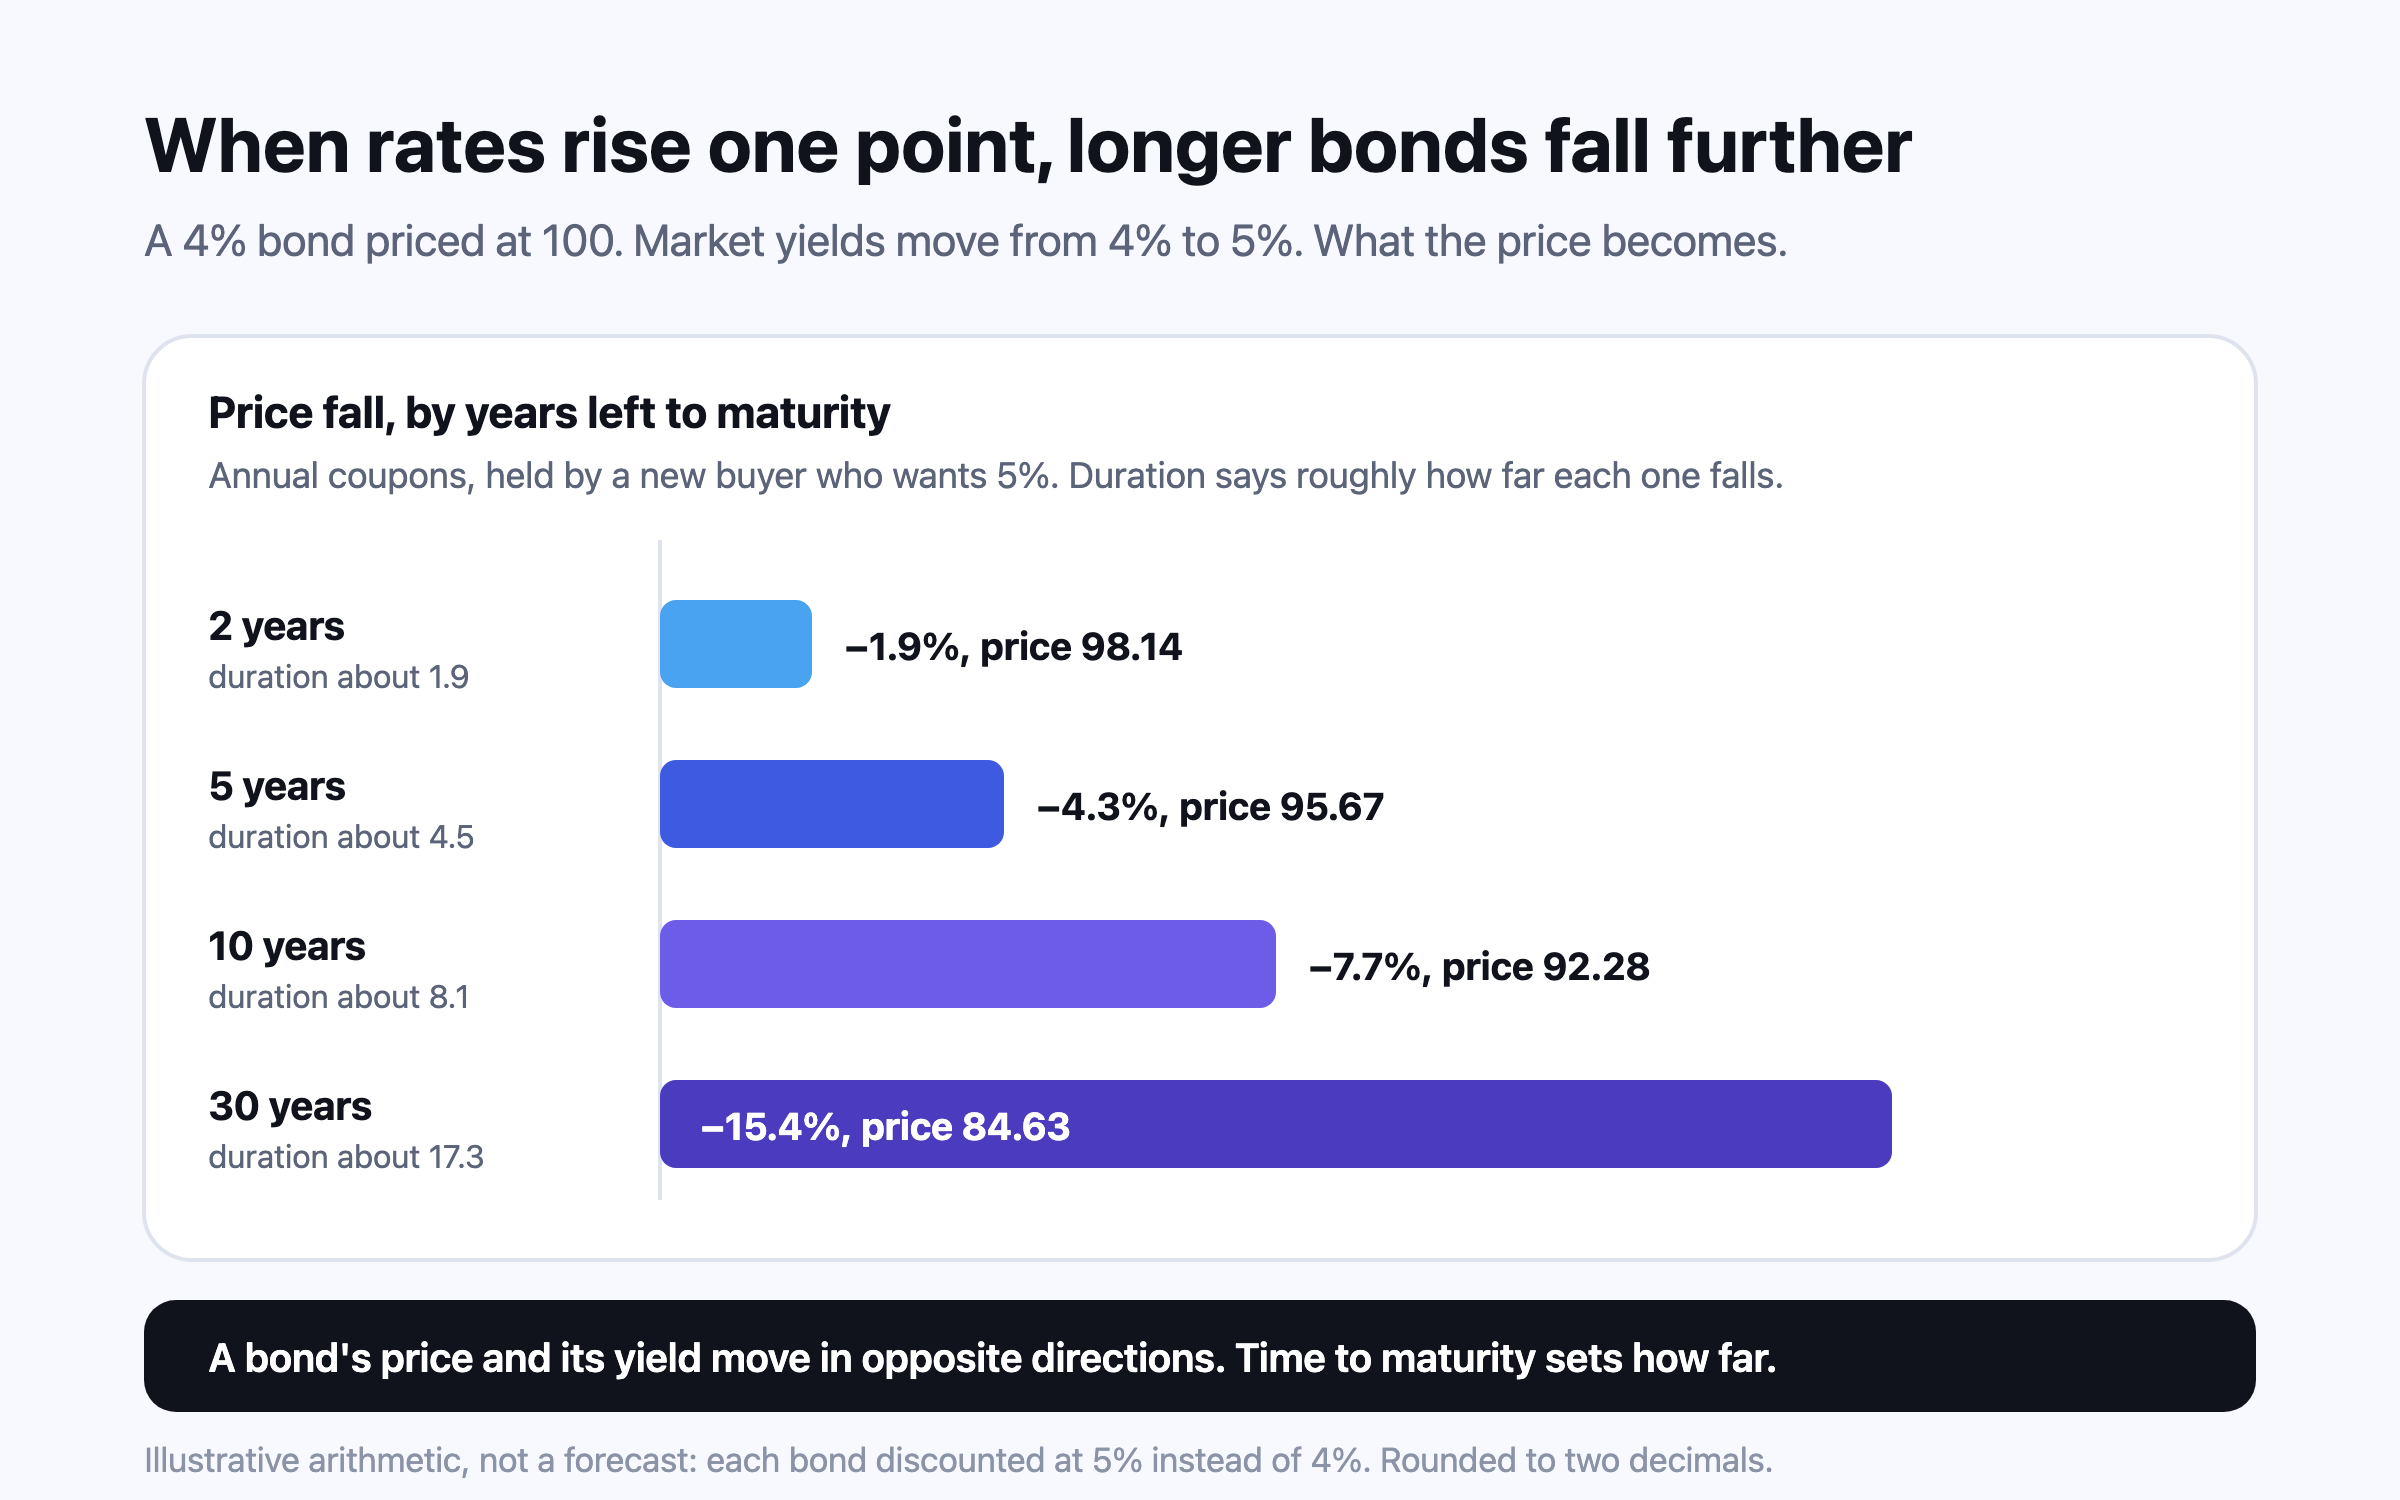
A bond is a loan you can sell. Its coupon is fixed, so when market rates rise its price falls until its yield matches the new rate, by roughly its duration for each percentage point. That is why the US bond market index lost 13.01% in 2022 and UK gilts 23.8%. The same arithmetic now works in savers’ favour: in early October 2026 ten-year government bonds yielded 5.31% in the US, 5.33% in the UK and 7.22% in India.
This is general information, not financial, tax or legal advice for your circumstances. Rules and figures change; check the official source for your country, and consult a licensed professional before making financial decisions. Projections are estimates, not predictions.