The costliest investing mistakes are ordinary ones: trading too often, buying what just rose, selling in a fall and betting on one company.
Over the ten years to 2025, the average dollar in US funds earned about 1.2 points a year less than the funds themselves, because of when money went in and out — though a 2026 study argues timing explains far less of that. Better evidenced are the costs of heavy trading, leverage and concentration: 87.7% of individual Indian F&O traders lost money in FY26, and the most active US households in one classic study trailed the market by over six points a year.
Nivritee Research · 6 October 2026 · 13 min read
Most investors do not lose money because they picked the wrong market. They lose it in small, repeatable ways: buying after a run-up, selling after a fall, trading more than they need to, borrowing to do it, and holding too much of one thing. The evidence on each is decades deep. Morningstar’s annual study found that over the ten years to the end of 2024 the average dollar invested in US mutual funds and ETFs earned 7.0% a year, against 8.2% for the funds themselves — a gap of about 1.2 points a year, roughly 15% of what the funds returned1. The 2026 edition, covering the ten years to 2025, found the same 1.2-point gap: investors earned 8.7% a year against 9.9%2.
That headline figure is the most quoted number in behavioural finance, and it is also argued over, which is where this article starts. Then come the mistakes with the hardest evidence behind them, each with a household it happened to, and what to do instead. For how costs compound on their own, see what fees cost over 30 years; for how to pick the fund in the first place, how to choose a fund.
Share of US listed companies that explain the market’s entire net gain since 1926
The behaviour gap, and why its size is disputed
Morningstar’s *Mind the Gap* compares two returns for the same funds. One is the fund’s own total return: what a single sum invested at the start and left alone would have earned. The other is a dollar-weighted return, which counts money by when it actually arrived and left. If investors pile into a fund after a good year and pull out after a bad one, the second number comes out lower. In the 2025 edition, the gap was widest in sector funds — investors earned 7.0% a year against the funds’ 8.5% — and narrowest in allocation funds, the all-in-one portfolios that mix shares and bonds, where investors captured nearly 97% of the funds’ return1.
The pattern that matters most is volatility. In the most volatile funds, investors earned 3.4% a year against a total return of 5.4%; in the least volatile, 9.6% against 10.0%1. Funds whose money came and went in the most erratic way had a gap of 1.8 points, against 0.8 for the steadiest, which is why Morningstar summed up its findings as “the more investors traded, the less they made”1. The 2026 edition found the gap wider in ETFs than in traditional open-ended funds — 1.6 points against 1.2 — which fits the same story: an instrument you can sell in a second is one you are more likely to sell2.
Now the other side. In May 2026, four researchers published a paper in the *Financial Analysts Journal* arguing that the gap is widely misread as a measure of bad timing. Using the same sample as Morningstar’s 2025 study, they estimated that poor timing cost fund investors only about 0.10% a year6. A similar objection has long been made about DALBAR’s *Quantitative Analysis of Investor Behavior*, which compares what fund investors earned with the S&P 500. Its figures swing from year to year: the average equity fund investor earned 16.54% in 2024 against the index’s 25.05%7, then 17.16% in 2025 against 17.88%8. Writing on Kitces.com in 2012, Harry Sit showed that DALBAR’s own figures implied that somebody investing a fixed sum every year, with no timing decisions at all, would have done slightly worse than the actual investors it was criticising: money that arrives steadily, as salaries do, can trail a lump sum simply because of when markets happened to rise9.
Trading too often
The cleanest evidence comes from brokerage records rather than fund flows. Brad Barber and Terrance Odean studied 66,465 US households at a discount broker between 1991 and 1996. The average household turned over 75% of its portfolio a year and earned 16.4% a year; the fifth that traded most earned 11.4%, while the market returned 17.9%10. Before costs, the households that traded most did about as well as those that rarely traded; commissions and bid-ask spreads took the difference. Sustained for ten years, a gap of 6.5 points a year is the difference between multiplying your money about 5.2 times and about 2.9 times.
A follow-up paper asked who trades most. Across more than 35,000 households, men traded 45% more than women, and trading cut men’s net returns by 2.65 points a year against 1.72 points for women11. The authors’ explanation was overconfidence, not gender as such: people who believe they know more than the price act more often, and acting is what costs money. Daniel Kahneman’s *Thinking, Fast and Slow* explains the machinery — a fast, intuitive way of thinking that is confident whether or not it has grounds to be12.
A practical test: count how many times in the last year you changed what you hold for a reason other than new money arriving or a planned rebalance. Each of those was a bet that you knew something the market did not. Some may have been right. The studies say the average one was not.
Buying what has just gone up
Money follows returns. Andrea Frazzini and Owen Lamont found that US fund flows went disproportionately into stocks that then did badly, and called the flows “dumb money”: by moving between funds, retail investors reduced their long-run wealth13. In the 2025 Morningstar study, the ETF gap was widest in international equity, at 3.2 points a year, and in sector equity, at 2.1 points — the two places where a recent story is easiest to buy1.
India supplies a recent example. Net inflows into sectoral and thematic equity funds rose from about ₹0.5 lakh crore in FY24 to about ₹1.5 lakh crore in FY25, a year in which, AMFI’s own factbook says, enthusiasm for thematic new fund offers helped drive a surge in new-fund collections; they then fell back to about ₹0.3 lakh crore in FY2614. A theme is easiest to sell after it has already run, which is the moment its next ten years are least likely to repeat its last three.
Emma and Josh, both 36, in Bristol, have £50,000 in stocks and shares ISAs and a habit of moving it into whatever sector topped last year’s tables. If their experience over the next ten years matched the average sector-fund investor in Morningstar’s 2025 study — 7.0% a year against the funds’ 8.5%1 — the same funds would leave them with about £98,000 instead of about £113,000. The difference, about £15,000, comes from nothing but when they bought and sold. It is an illustration of the average, not a prediction for them; but the habit that produces it is theirs to change.
Trying to time the market
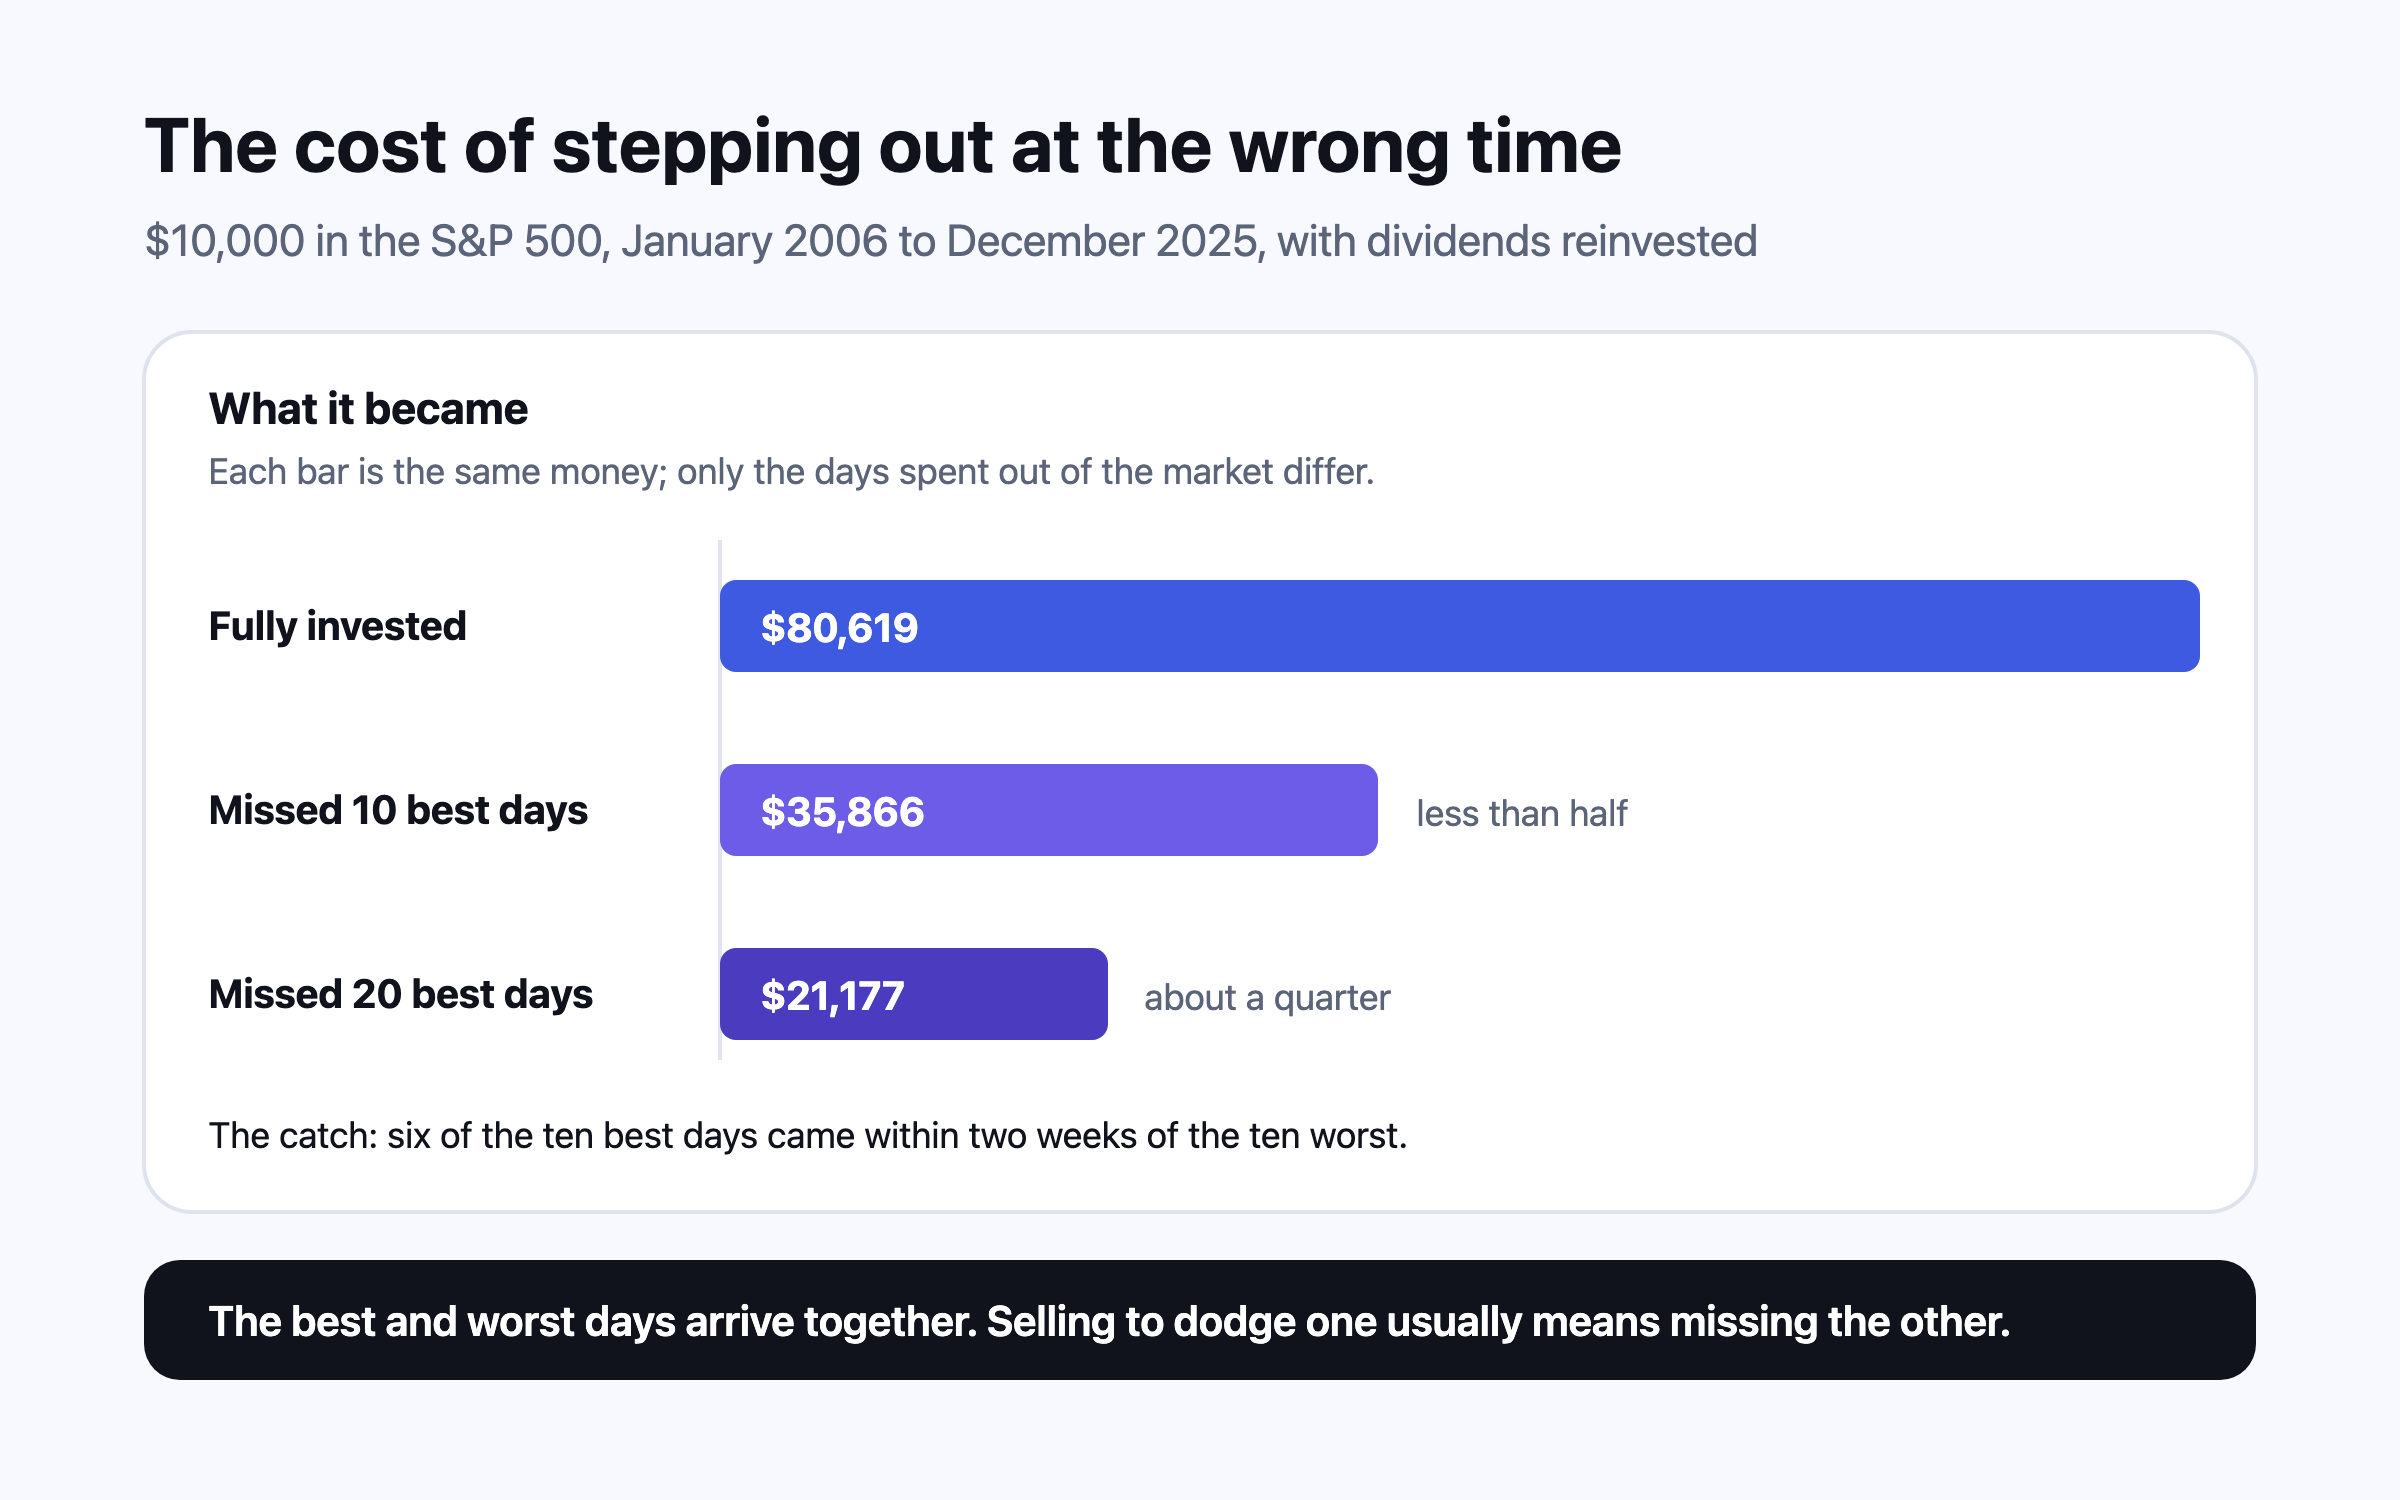
The usual argument against market timing is the cost of missing the best days. J.P. Morgan Asset Management’s 2026 *Guide to Retirement* puts $10,000 in the S&P 500 from the start of 2006 to the end of 2025: left alone it became $80,619, an 11.0% annual return; missing the ten best days left $35,866, and missing the best twenty left $21,1774. Hartford Funds reports that 76% of the US market’s best days came during a bear market or in the first two months of a bull market15.
The honest version of that chart includes its caveat. The best and worst days cluster together. J.P. Morgan’s own note says six of the ten best days came within two weeks of the ten worst, and that the second-worst day of 2020, 12 March, was immediately followed by the second-best4. Mebane Faber showed in 2011 that missing the worst days helps as much as missing the best ones hurts, and that most of both happen in falling markets16. So the chart does not prove that timing is impossible; it proves that the days which decide the outcome arrive together, in the panic, when nobody can tell which kind of day tomorrow will be. Somebody who sells to avoid the next bad day is very likely to be in cash for the good one that follows it.
The commonest form of timing is not selling everything. It is waiting: keeping a bonus or an inheritance in cash for a dip that may not come. The research on that choice, and why spreading money in can still be the right answer for some people, is in SIP or lump sum.
Selling in a crash
March 2020 is the clearest recent test. The S&P 500 closed at 3,386.15 on 19 February 2020 and at 2,237.40 on 23 March, a fall of 33.9% in five weeks; it closed above its February high again on 18 August 202017. Somebody who sold at the bottom crystallised a third of their portfolio as a loss. Somebody who did nothing was back where they started within six months, on prices alone, before dividends.
The Nguyens, in their forties near Seattle, had $200,000 in an S&P 500 index fund in February 2020. Selling at the 23 March close would have turned it into about $132,000, a loss of about $68,000 measured on the index17. The question they faced was not whether markets would recover — nobody knew — but whether anything about their need for the money had changed. Neither had lost a job. The money was for a goal twenty years away. Selling would have answered a question about the next week with money meant for the next two decades.
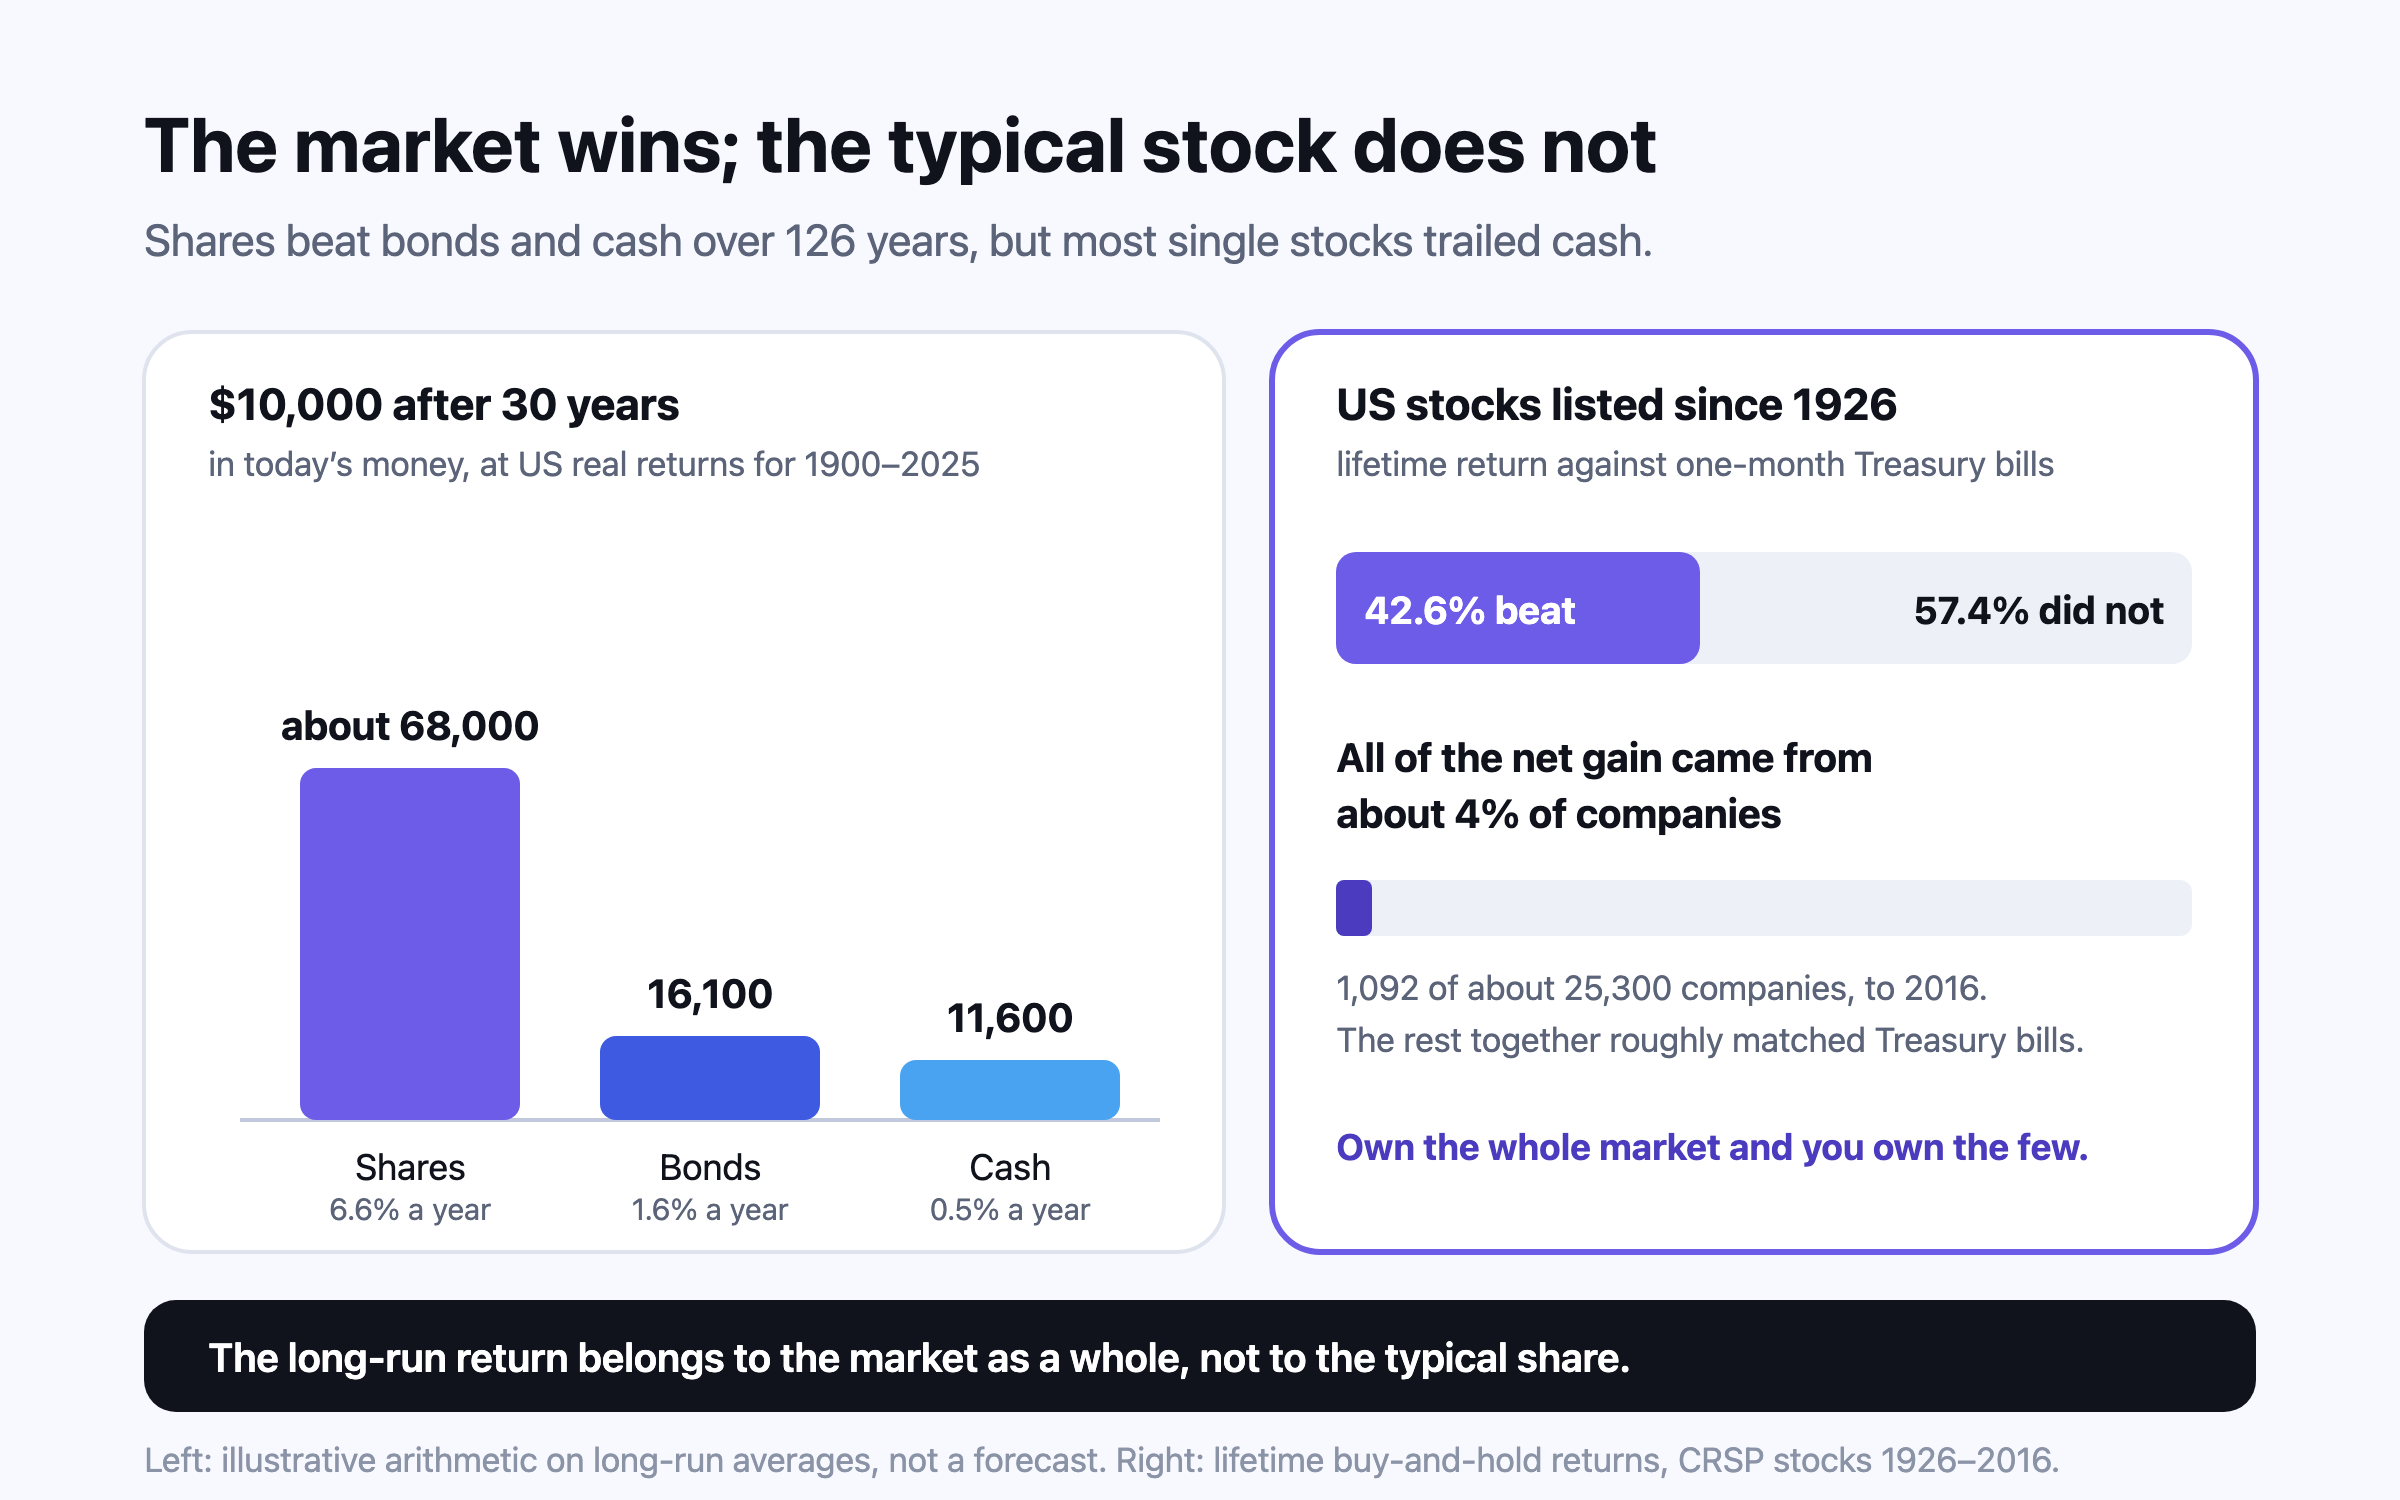
Single shares are far riskier than the market they belong to. Hendrik Bessembinder found that most US shares listed since 1926 delivered lifetime returns below one-month Treasury bills — only 42.6% did better — and that the best-performing 4% of companies explain the entire net gain of the US market over that period5. A broad index owns those few winners by construction. A handful of shares very probably does not. William Goetzmann and Alok Kumar found under-diversification most common among younger, lower-income and less sophisticated investors, and linked it to overconfidence and to favouring familiar, local companies18.
The most dangerous single share is your employer’s, because it is tied to your salary. At the end of 2000, 62% of the assets in Enron’s 401(k) plan were Enron shares; shares that traded above $80 in January 2001 were worth under 70 cents a year later19. Thousands of employees lost their jobs and much of their retirement savings in the same collapse.
Jason, 44, a software manager in Toronto, has C$600,000 invested, of which C$240,000 is vested shares in his employer from years of stock grants — 40% of the total. If that one share halves, his portfolio falls by a fifth, C$120,000, and it would most likely halve for reasons that also put his job at risk. The usual guidance is to sell vested shares on a schedule rather than waiting for a better price, which is itself a timing bet; in Canada, taxable gains on sale are a reason to plan the schedule, not a reason to never start. Canada also made up only 2.9% of the MSCI All Country World Index at the end of September 2026, against 64.21% for the United States20, so a portfolio that is mostly Canadian shares and an employer’s stock is a very concentrated bet on one economy.
The same holds for households who keep everything at home, in India, the UK or Australia. Home bias is not always a mistake — the currency you will spend matters — and home bias and currency risk works through when it is and when it is not. A century of country returns, in global diversification over 125 years, shows why no single market has been a safe bet.
Borrowing to bet: leverage and F&O
No mistake has better data than retail derivatives trading in India, because SEBI has studied it every year since 2023. In its July 2025 study, SEBI reported that about 91% of individual traders in equity derivatives made net losses in FY25, and that their combined net losses, after costs, widened 41% to ₹1,05,603 crore from ₹74,812 crore in FY2421. The August 2026 study found aggregate losses falling 18% to ₹91,685 crore in FY26, as the number of individual traders fell 18% after SEBI tightened the rules from November 2024 — but the share losing money was still 87.7%, and the average loss per person rose slightly, to ₹1.17 lakh3.
Individual traders in India’s equity derivatives segment, net of transaction costs. FY23–FY25 from SEBI’s July 2025 study; FY26 from its August 2026 study, which revised FY25’s loss to about ₹1.12 lakh crore on a larger broker sample, so the two are not strictly comparable. 213
Year
Share of individual traders with a net loss
Aggregate net loss of individuals
Average per person
FY23
91.7%
₹65,747 crore
₹1,12,677 loss
FY24
91.1%
₹74,812 crore
₹86,728 loss
FY25
91.0%
₹1,05,603 crore
₹1,10,069 loss
FY26 (new study)
87.7%
₹91,685 crore
₹1.17 lakh loss
The details are worse than the averages. Traders under 30 made up 43% of individual traders in FY26, and 89% of them lost money; about three-quarters declared incomes below ₹5 lakh a year; 35% held no shares at all; and options accounted for 92% of individual losses3. Individuals paid about ₹25,000 crore in transaction costs in each of FY25 and FY26, and roughly ₹1 lakh crore over FY22 to FY263. Whatever the trading strategy, those costs are a certain loss charged before it has to work.
Rohan, 31, a software engineer in Pune taking home ₹1.8 lakh a month, opened an options account in 2023 after watching a colleague’s screenshots. If his experience matched SEBI’s FY26 average loss of ₹1.17 lakh a year3, three years would cost him ₹3.51 lakh — almost two months of take-home pay, and money that in a monthly index-fund SIP would have stayed his and kept compounding. The colleague’s screenshots were real. SEBI’s data says they were also unusual.
This is not only an Indian problem. In a study of US retail options trading, Svetlana Bryzgalova, Anna Pavlova and Taisiya Sikorskaya found retail investors favoured cheap, short-dated options with average bid-ask spreads of 12.6%, and estimated that their aggregate portfolio lost $2.1 billion between November 2019 and June 2021, assuming ten-day holds; most of that loss was the indirect cost of trading, which came to $6.4 billion22. A second study found retail traders lost 5–9% on average on options bought around company announcements23.
Manias: meme stocks and crypto
Every few years, an asset rises so fast that not owning it feels like the mistake. GameStop closed at $19.95 on 12 January 2021, reached $347.51 at the close on 27 January and $483 during the next day’s trading, then fell more than 86% by the end of the first week of February, according to the SEC’s staff report24. Anybody who bought once it was on the front pages, in the last days of January, paid close to the top.
Crypto ran the same pattern at larger scale. Using app-download data from 95 countries between 2015 and 2022, researchers at the Bank for International Settlements estimated that 73–81% of retail investors had lost money on their bitcoin investments, largely because most of them bought after prices had already risen25. In December 2022 the SEC charged the founder of FTX, then one of the largest exchanges, with defrauding investors, alleging customer money had been diverted to a related trading firm26. Robert Shiller’s *Irrational Exuberance* describes how such episodes feed on their own price rises and on stories told to explain them27.
Shu Fen, 29, a Singapore civil servant, put S$15,000 into crypto in late 2021 because friends had made money. Regulators were blunt then and are now: Singapore’s MoneySense, run by MAS, tells investors to compare any product with its alternatives on risk, return, fees and flexibility before buying28, and the UK’s FCA keeps a list of the warning signs of high-risk and fraudulent offers29. A small, deliberate speculative slice that you can afford to lose entirely is a choice; most of the money in a mania is not in that slice.
Ignoring what it costs
Costs are the one mistake you can correct in advance. Morningstar found that over the ten years to 2025, 31% of active funds in the cheapest fifth of their category survived and beat their average index-fund rival, against 17% of the dearest fifth30. A one-point yearly charge leaves about a quarter less after 30 years; the arithmetic is in what fees cost over 30 years. In India the commonest form is a regular plan held where a direct plan of the same fund exists; in the UK and Australia, platform and adviser charges on top of a fund’s own.
What helps: rules made before you need them
The research converges on one idea: the decisions that cost most are made under stress, so the best defence is to make them earlier, when calm. Richard Thaler, in *Misbehaving*, and with Cass Sunstein in *Nudge*, shows how defaults and automatic choices beat good intentions — a standing monthly investment is a default working for you3132. Morgan Housel’s *The Psychology of Money* argues that doing well with money depends more on behaviour than on knowledge, and that the ability to sit still through a fall is worth more than any forecast33.
Write down why you hold each investment and what would make you sell it — a change in your goal or your circumstances, not a change in the price.
Automate contributions on payday, so investing does not depend on how the market feels this month.
Keep money needed in the next few years, and an emergency fund, out of shares, so a fall never forces a sale.
Choose a mix you could hold through a fall like 2020’s 33.9%17, and rebalance on a date, not on a headline.
Cap anything speculative — single shares, options, crypto, a theme — at a share of your portfolio you could lose entirely, and do not top it up after a loss.
Check your portfolio less often. The returns do not improve with attention; the urge to act does.
How Nivritee helps you see your own patterns
Questions people ask
What is the behaviour gap in investing?
It is the difference between what funds return and what their investors earn, because of when money goes in and out. Morningstar measured it at about 1.2 points a year over the ten years to 2025: 8.7% for investors against 9.9% for the funds2. A 2026 *Financial Analysts Journal* paper argues poor timing explains only about 0.10% a year of it6.
Is the DALBAR study accurate?
Its method is contested. DALBAR compares a dollar-weighted investor return with the index’s lump-sum return, and critics have shown that steady monthly investing can trail the index in that comparison without any bad timing9. Its figures for 2024 were 16.54% for the average equity fund investor against 25.05% for the S&P 500; for 2025, 17.16% against 17.88%78.
Should I sell my investments before a crash?
Nobody reliably knows when one is coming, and the best days tend to arrive right after the worst: six of the ten best days in 2006–2025 came within two weeks of the ten worst4. A change in your goal or your need for the money is a reason to sell; a forecast is usually not.
I sold at the bottom. What should I do now?
Decide on the mix you would hold through another fall and get back to it on a schedule, for example in equal monthly amounts over a few months, rather than waiting for a better price, which is the same timing bet again. In 2020 the S&P 500 was back above its February high by 18 August, less than five months after the low17.
What percentage of F&O traders lose money in India?
SEBI found 87.7% of individual equity derivatives traders made net losses in FY26, with an average loss of ₹1.17 lakh per person, and about 91% in each of FY23 to FY25321.
How much of my portfolio should be in my employer’s stock?
No rule fits everyone, but the risk is doubled because your salary depends on the same company. At Enron, 62% of the 401(k) plan was in company shares at the end of 2000, the year before it collapsed19. Many households cap any single share at a small part of their investments and sell vested shares on a schedule.
Is checking my portfolio every day bad?
Checking itself costs nothing; acting on it does. Barber and Odean found the households that traded most earned 11.4% a year against 16.4% for the average household and 17.9% for the market10.
Is it too late to invest after markets have risen a lot?
A high market is not on its own a reason to wait. Missing the ten best days of 2006–2025 cut $10,000’s growth from $80,619 to $35,8664, and those days cannot be picked in advance. If a lump sum worries you, spreading it over a few months is a reasonable compromise.
A share is a small part-ownership of a company, bought and sold on an exchange between investors. Over 1900–2025, US shares returned about 6.6% a year after inflation against 1.6% for bonds and 0.5% for cash, and shares were the best asset in every market with a continuous record. But most individual US stocks since 1926 did worse than Treasury bills over their listed lives, and about 4% of companies produced all of the market’s net gain, so the long-run return belongs to the whole market, not to the typical stock.
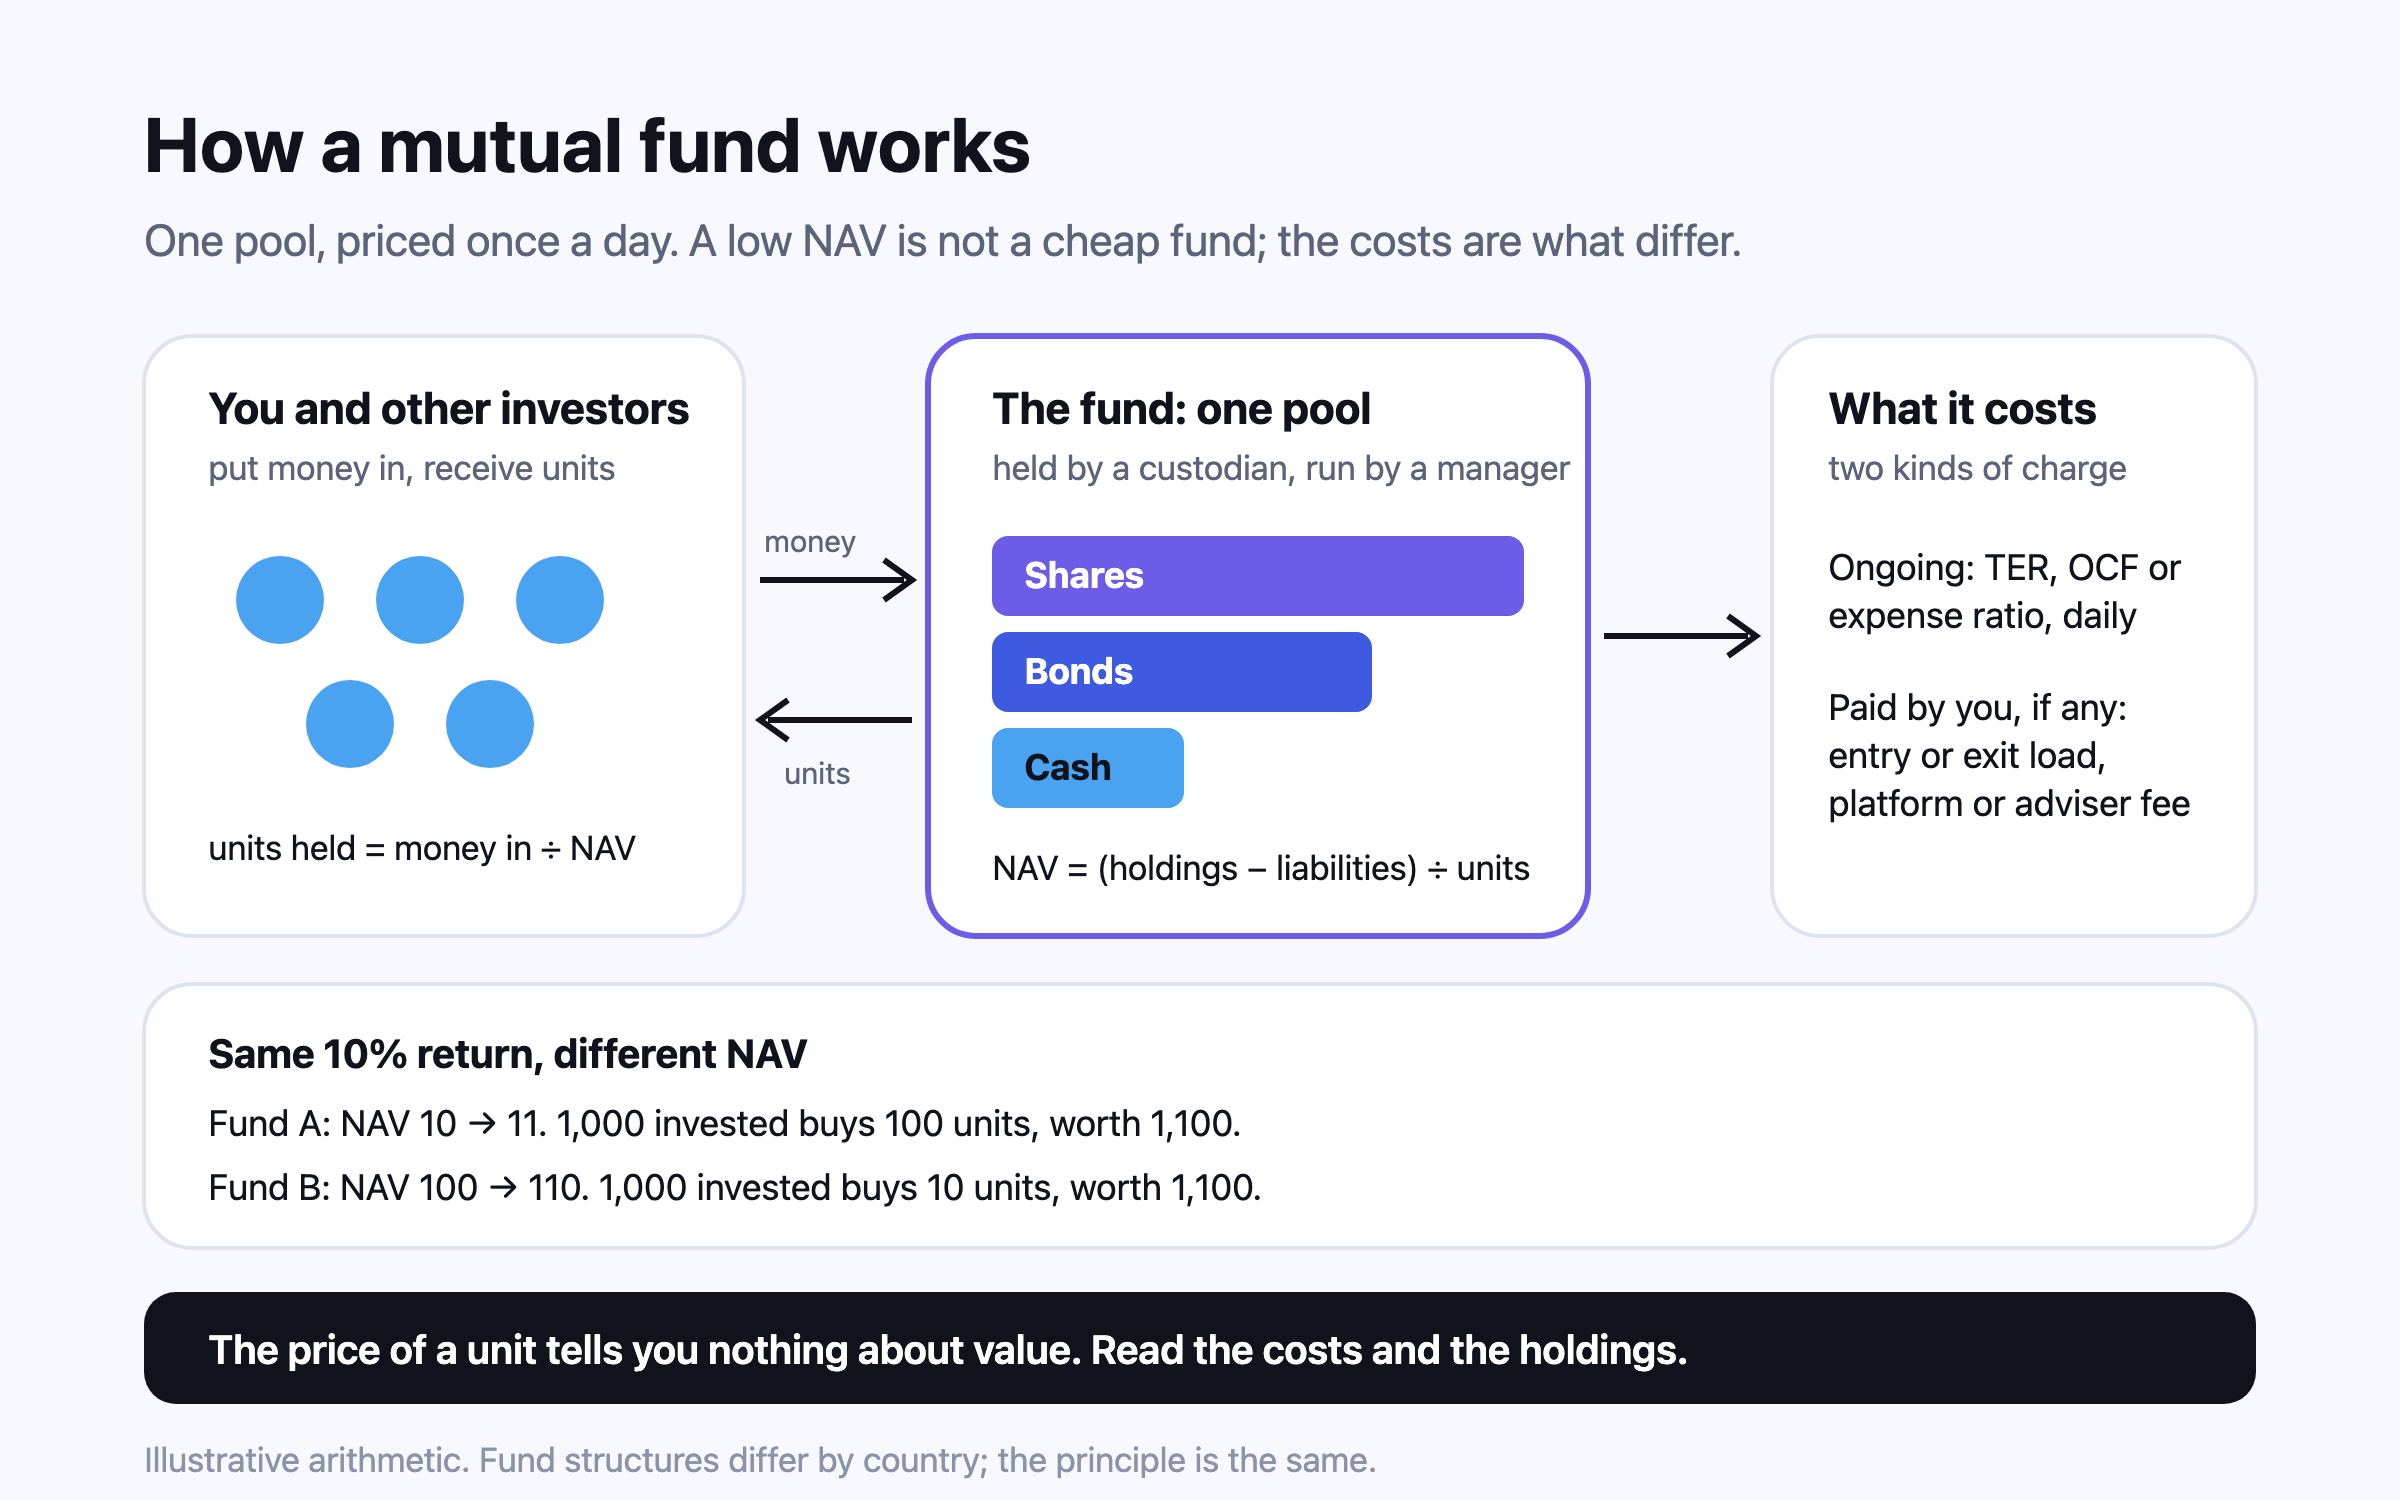
A mutual fund pools many investors’ money into one portfolio and issues units priced at the net asset value (NAV) once a day. The NAV itself says nothing about value; the costs and the holdings do. A yearly charge of 0.9% instead of 0.1% leaves about 17% less after 25 years, most active funds trail their index over long periods, and index mutual funds and index ETFs together held 52% of US long-term fund assets at the end of 2025.
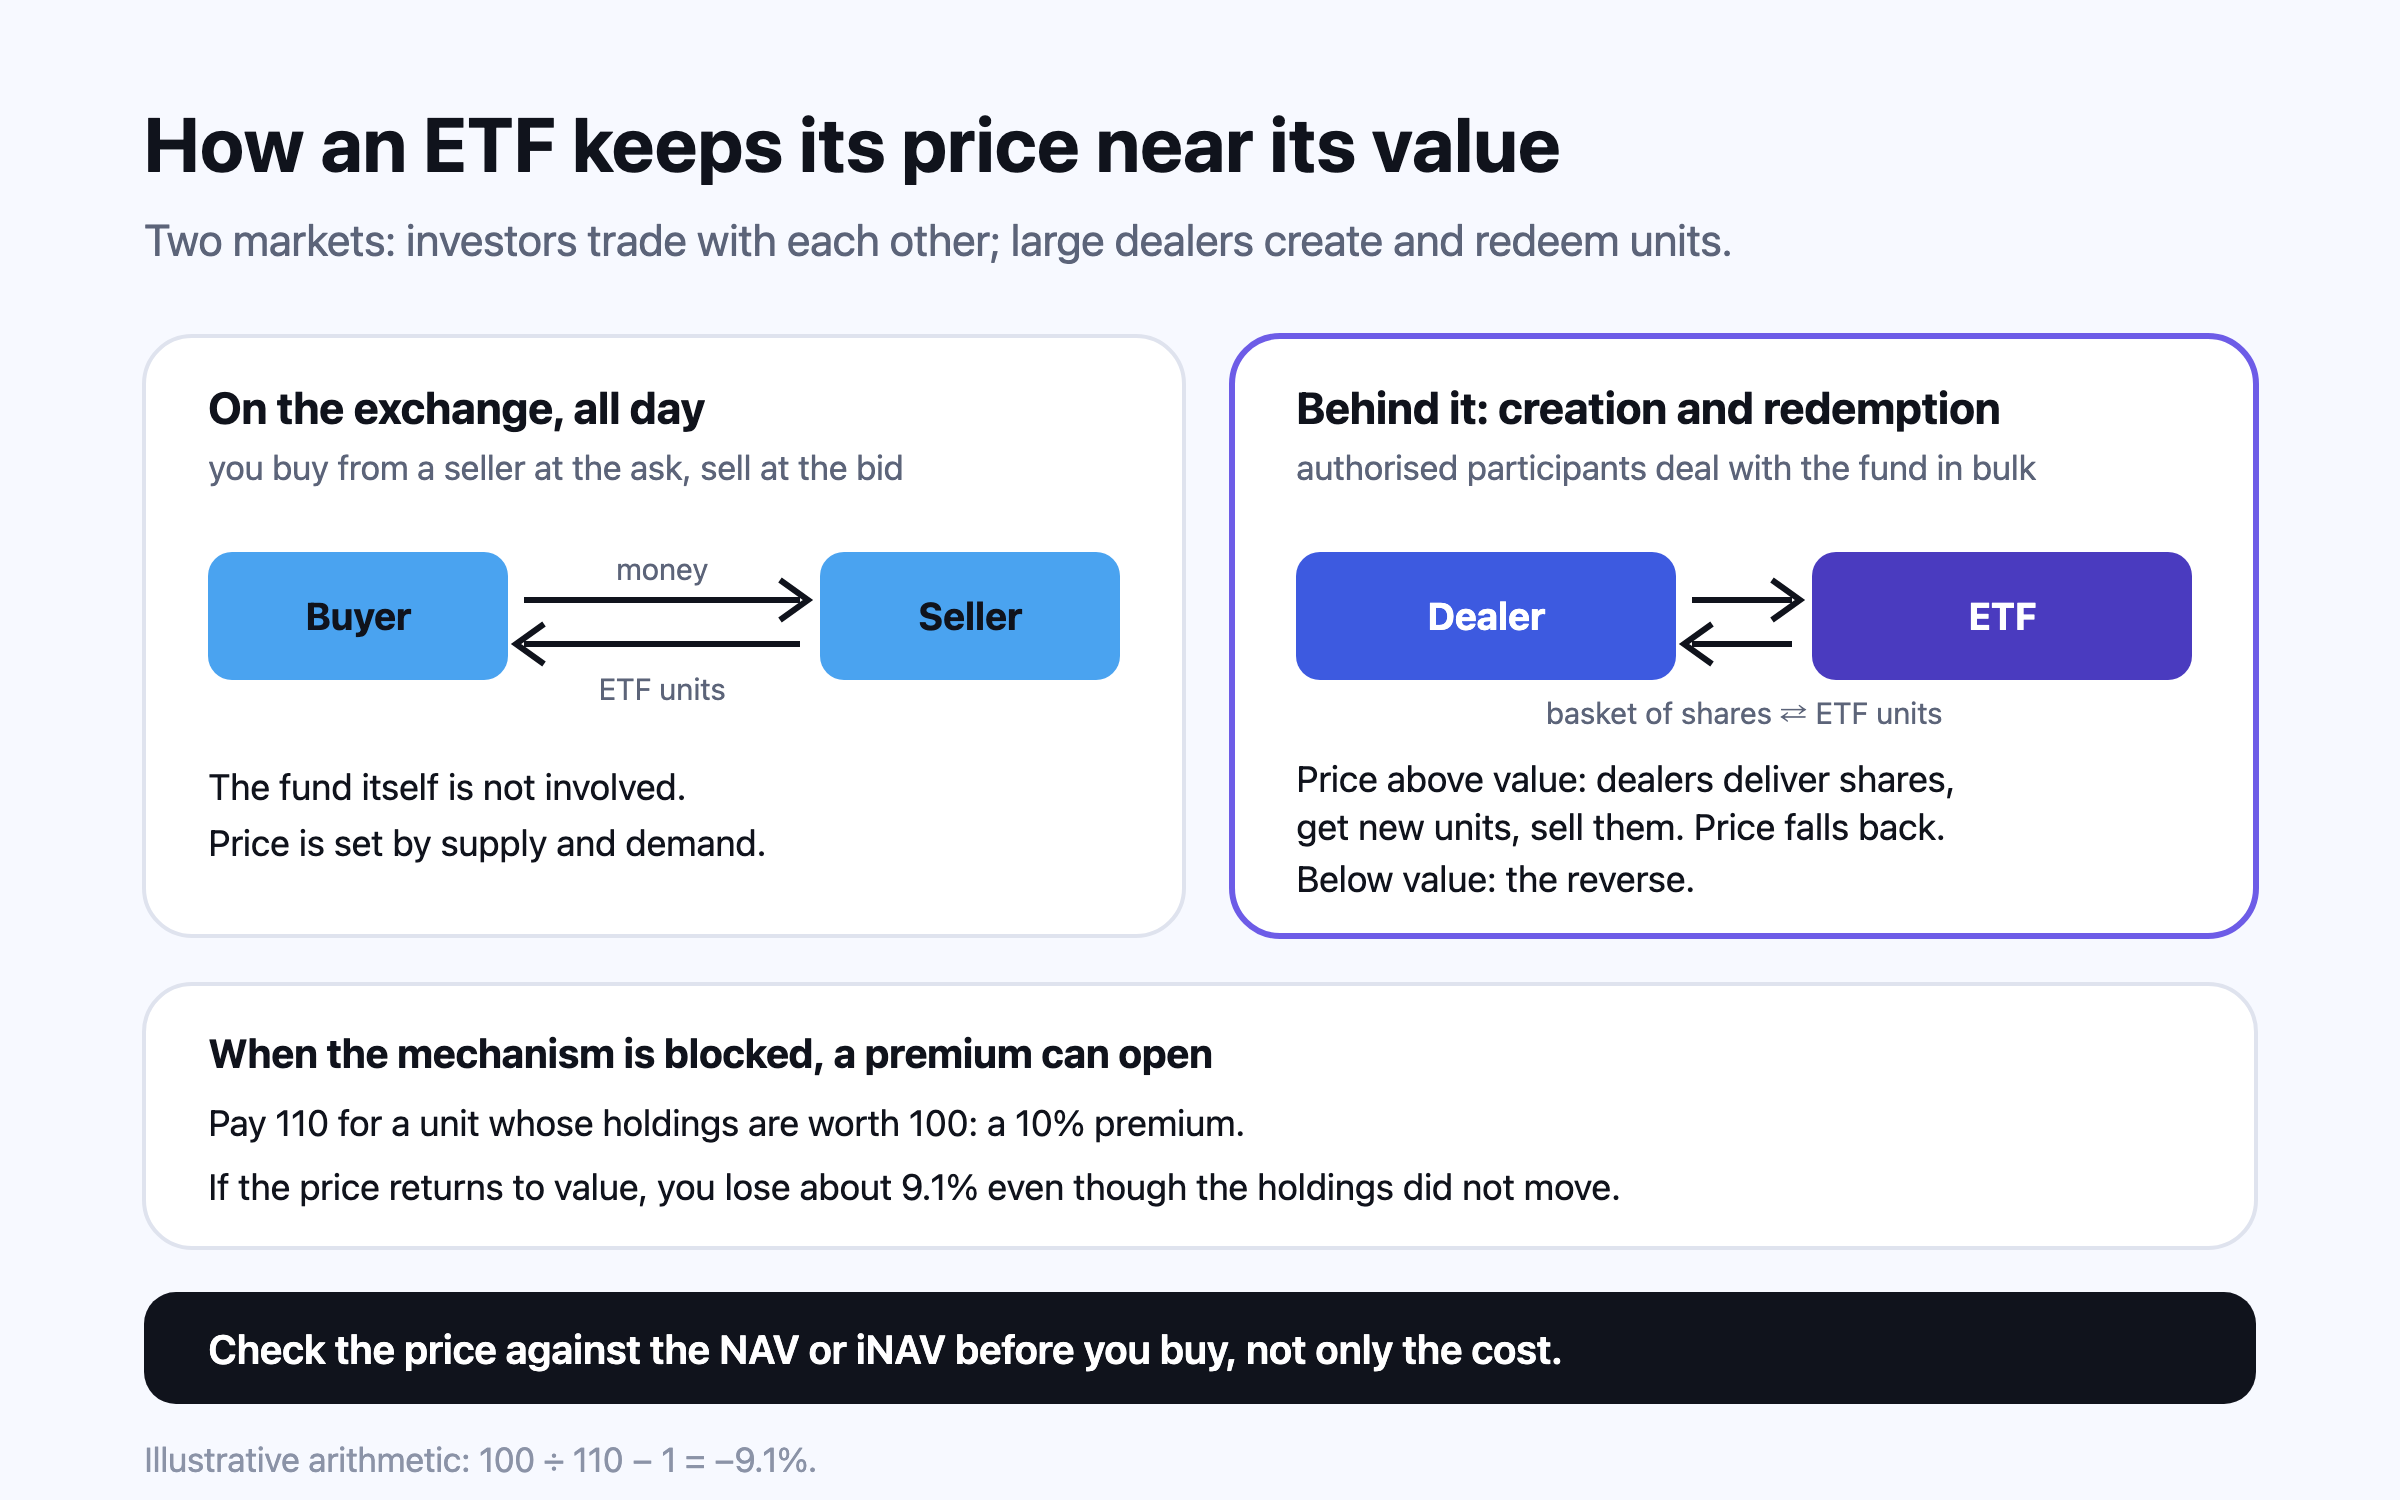
An exchange-traded fund holds a portfolio like a mutual fund but trades on a stock exchange all day. Large dealers create and redeem units to keep its price close to the value of its holdings; when that mechanism is blocked, as for India’s international ETFs in September 2026, prices can run far above value. For investors outside the US, the fund’s domicile decides how much dividend tax is withheld and whether US estate tax applies above US$60,000.
This is general information, not financial, tax or legal advice for your circumstances. Rules and figures change; check the official source for your country, and consult a licensed professional before making financial decisions. Projections are estimates, not predictions.