Buying beats renting only when a home costs less each year to own than to rent and you stay long enough to earn back the taxes on the purchase — and at 2026 mortgage rates that depends sharply on the city.
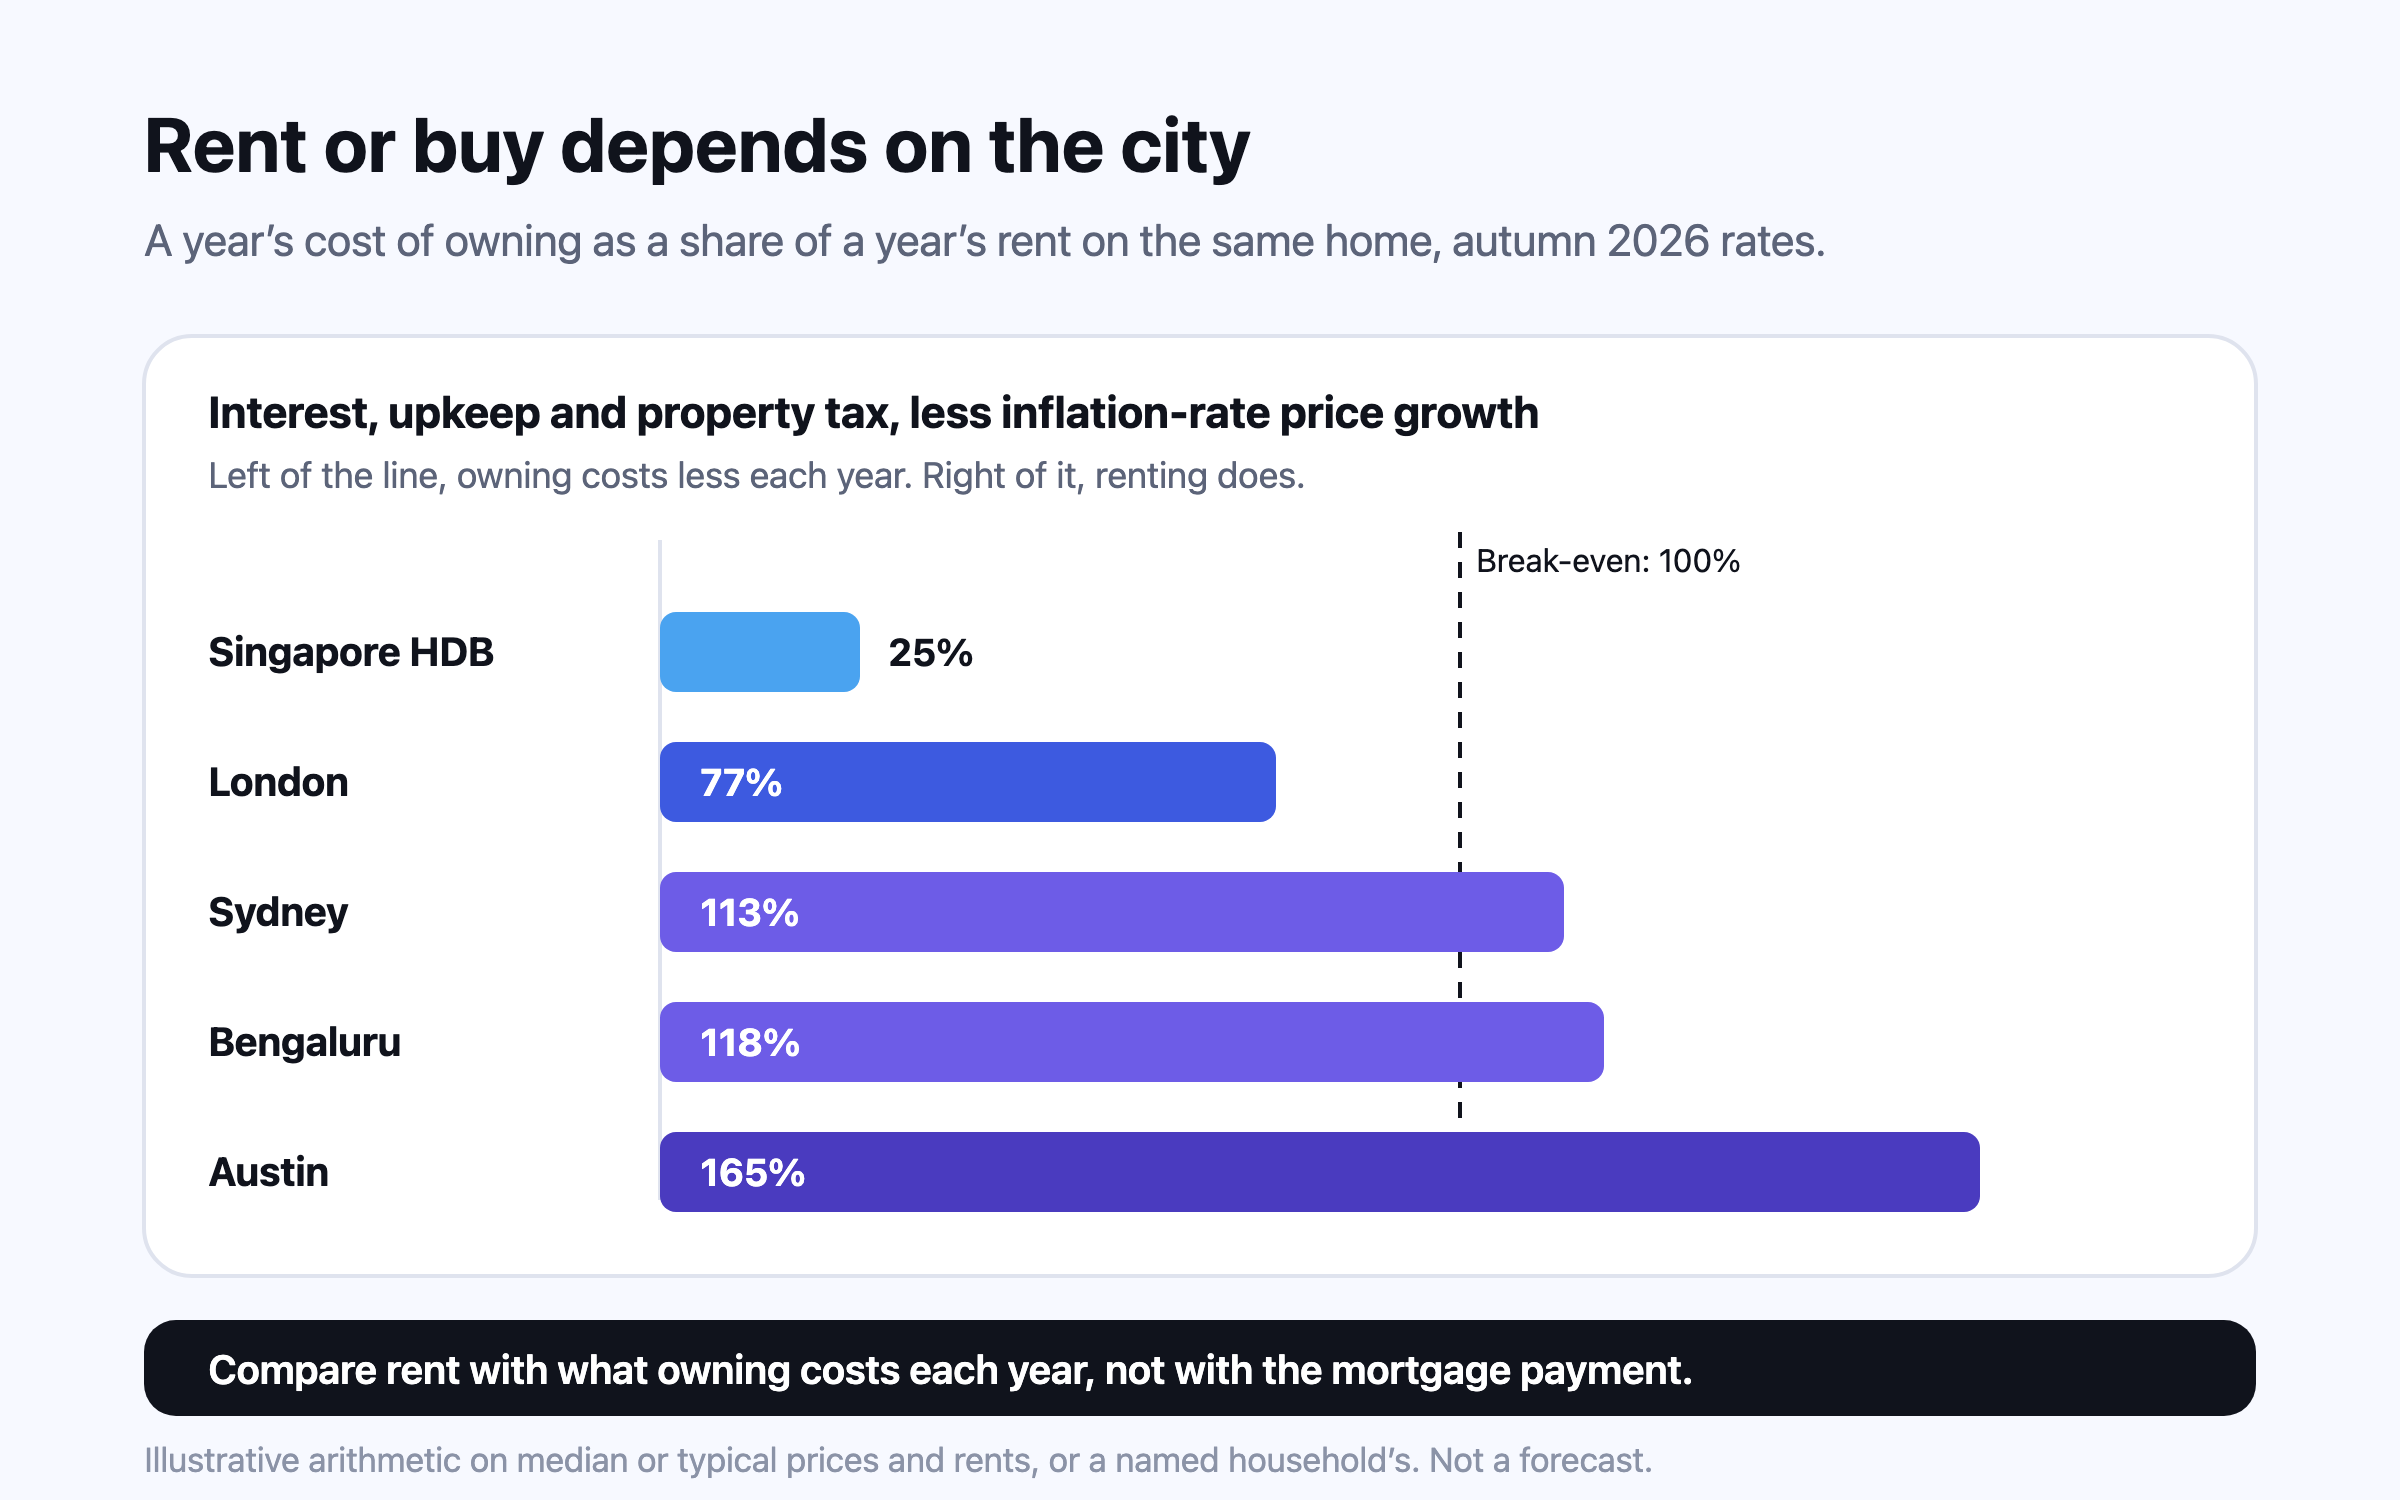
Compare rent with the unrecoverable cost of owning — interest, upkeep, property tax and the return your deposit gives up, less expected price growth — not with the mortgage payment. At autumn 2026 rates, owning the average London home costs somewhat less than renting it, an Austin home costs far more to own than to rent, and an HDB flat in Singapore costs far less. Transfer taxes then decide how long you must stay.
Nivritee Research · 6 October 2026 · 9 min read
Renting is not throwing money away, and neither is buying. Both buy a place to live, and both carry costs you never get back. For an owner those are mortgage interest, upkeep, property tax and the return the deposit would have earned elsewhere, offset by whatever the home gains in value. The Canadian portfolio manager Ben Felix compressed this into the 5% rule: an owner’s unrecoverable costs run to roughly 5% of the home’s value a year — about 1% property tax, 1% maintenance and 3% cost of capital — so if a similar home rents for less than 5% of its price divided by 12 each month, renting is the cheaper way to be housed1. He built that in 2019, when Canadian mortgages cost around 3%. In autumn 2026 a new mortgage costs between about 4.5% and 7.3% in five of the six markets below, and the answer has moved with them23.
Singapore HDB loan: 0.1 point above the CPF rate of 2.5%
Compare rent with the cost of owning, not the mortgage payment
The commonest mistake on the forums is to set rent against the monthly mortgage payment. Part of that payment repays the loan, which is savings moving into the house, not a cost. Economists compare rent with the user cost of owning, the yearly cost of housing yourself in a home you own; Himmelberg, Mayer and Sinai set out the method in the *Journal of Economic Perspectives* in 2005, as a way of telling a house-price bubble from prices that rents and interest rates can justify7. Built up line by line:
Interest and the deposit’s lost return. The bank charges interest on the loan; the deposit and every repayment stop earning whatever they would have earned invested. This is the largest item, and it is the one Felix’s 5% rule set at 3%1.
Maintenance. Roofs, boilers, kitchens and the slow wear of everything else. Felix uses 1% of the value a year as a planning figure1; older homes and strata or service charges can push it higher.
Property tax. In the US and Canada a real cost of owning, around 1% of value in Felix’s rule1. In the UK, council tax is paid by whoever lives in the home, so it does not separate an owner from a tenant.
Less expected price growth. The uncertain part, and the one people are most tempted to inflate.
Add those up as a percentage of the price, multiply by the price, and compare with a year’s rent on a similar home. Below the rent, owning is cheaper each year; above it, renting and investing the difference can leave you ahead, provided the difference really is invested. Ramit Sethi makes a similar point in *I Will Teach You to Be Rich*: for many people renting is the better financial decision, and a home is a purchase to be run through the numbers like any other, not an automatic investment8.
Mortgage rates and price-to-rent ratios in autumn 2026
Rates as published by each source in September and early October 2026. Canada’s posted rate is a bank list rate that few borrowers pay; the new-loan average is what chartered banks actually charged. Australia’s average predates the September rise in the cash rate. India’s figure is one large lender’s starting rate, for the strongest credit profiles; SBI’s rate was published before the RBI raised its repo rate to 5.50% on 7 October 2026, so new loans may now be priced higher. 3942105111213146
Market
Typical mortgage rate
Policy rate
United States
7.28%, 30-year fixed (1 Oct 2026); 6.60% 15-year
Fed funds target 3.75–4.00% (raised 16 Sep 2026)
United Kingdom
4.92%, 2-year fixed at 75% LTV; 4.78% 5-year (Aug 2026)
Bank Rate 3.75%
Canada
4.49%, new uninsured fixed loans of 5 years or more (Jul 2026); 6.09% posted 5-year rate (30 Sep 2026)
Policy rate 2.25%
Australia
6.24%, average new owner-occupier loan (Jun 2026)
Cash rate 4.60% (from 30 Sep 2026)
India
From 7.25% at SBI (Oct 2026)
Repo rate 5.50% (raised 7 Oct 2026)
Singapore
2.6% HDB concessionary loan
CPF Ordinary Account 2.5% (Oct–Dec 2026)
The OECD tracks how expensive houses are relative to rents and to incomes in each country, each measured against that country’s own long-run average (100 = average). The latest readings show the gap between owning and renting is widest where prices raced ahead of rents for two decades: Australia, New Zealand and Canada15.
OECD Analytical House Price Indicators: house prices divided by rents, and by disposable income per head, each relative to the country’s own long-run average. A reading of 160 means prices are 60% higher relative to rents than usual for that country. India and Singapore are not covered. 15
Country
Price-to-rent (long-run average = 100)
Price-to-income (long-run average = 100)
Australia
175.5 (Q3 2025)
154.1 (Q1 2026)
New Zealand
170.6 (Q1 2026)
124.2 (Q1 2026)
Canada
160.0 (Q2 2026)
139.2 (Q2 2026)
United Kingdom
130.9 (Q2 2026)
115.2 (Q2 2026)
United States
130.0 (Q4 2024)
109.8 (Q2 2026)
Euro area
124.1 (Q4 2025)
110.3 (Q1 2026)
Germany
110.7 (Q2 2026)
84.7 (Q2 2026)
Japan
109.4 (Q4 2025)
87.6 (Q4 2025)
OECD
133.1 (Q3 2025)
106.2 (Q2 2026)
Six cities, worked through
Each case below applies one method, a 2026 version of Felix’s rule. The cost of capital is the local mortgage rate, less expected price growth taken as the central bank’s inflation target, so a home is assumed to hold its real value: 2% in the US, UK and Canada, the 2.5% middle of Australia’s 2–3% band, and 4% in India1617181920. Singapore has no formal inflation target, so 2% is assumed there. Maintenance is 1% a year and property tax is the local rate where owners pay a material one; in Sydney, Bengaluru and Singapore the smaller owner charges (council rates, strata or conservancy fees, municipal tax) are assumed to fit inside the 1%1. Treating the deposit’s lost return as the mortgage rate is generous to buying: if the deposit could earn more invested, owning costs more than shown. Where a household is named, its figures are illustrative.
London: close to even, decided by how long you stay
The average London home cost £550,000 in July 2026, down 3.3% on a year earlier, and the average London rent was £2,332 a month in August2122. These are averages of different homes — renters tend to occupy smaller ones — so the true comparison for any one flat will differ. At a 4.92% two-year fix4, owning costs about £21,560 a year against £27,984 in rent, so owning is cheaper by about £6,424 a year. Stamp Duty Land Tax on £550,000 is £17,500, and a first-time buyer gets no relief above £500,00028. That tax alone takes about 2.7 years of the saving to earn back, before legal fees, the survey and an agent’s commission when you sell. Felix’s original 5% would put the break-even rent at about £2,292, a little under the average; at London’s prices the decision is close and the length of stay settles it.
Toronto: what a rent will justify
Maya, 31, a nurse, rents a two-bedroom condo at C$3,013 a month, the Greater Toronto average for the second quarter of 202629. Running the rule backwards gives the most she could pay for a similar condo and still not be worse off owning: C$36,156 a year divided by 5% is about C$723,000 under Felix’s original rule. The rate she would actually pay matters more than the one in the bank’s window. The posted five-year rate was 6.09% in September 202610, but new uninsured fixed loans of five years or more averaged 4.49% in July2. At 4.49%, with Toronto’s 0.767% residential tax rate30 and 1% upkeep, less 2% inflation, the cost rate is about 4.26% and the ceiling rises to about C$849,000; at the posted rate it would be about C$617,000. Toronto buyers also pay land transfer tax twice, to Ontario and to the city, on the same bands: C$10,475 each on a C$700,000 home, C$20,950 in all before any first-time buyer refund3132. The Greater Toronto average selling price was C$1,006,409 in September 2026, down 5.1% on a year earlier33, above even the higher ceiling, though that average covers every type of home.
Sydney: the duty threshold matters as much as the rate
Chloe and Sam, 33 and 34, are looking at a two-bedroom unit in Marrickville for A$1,050,000 and pay A$850 a week to rent one in the same street. At the average 6.24% rate on new owner-occupier loans in June 20265 — set before the Reserve Bank lifted its cash rate to 4.60% at the end of September11 — owning costs about A$49,770 a year against A$44,200 in rent. NSW transfer duty on A$1,050,000 is A$41,437, and because the price is over A$1 million they get no first-home concession; at A$800,000 or less they would pay none34. Across New South Wales the mean dwelling price was A$1,304,900 in the June quarter of 202635.
Bengaluru: the answer turns on price growth
Karthik and Divya, 35 and 33, both in technology, like a 3BHK in Whitefield listed at ₹1.6 crore; the identical flat upstairs rents for ₹48,000 a month, a gross yield of 3.6%. With home loans from 7.25%12 and prices assumed to rise with the Reserve Bank’s 4% inflation target20, owning costs about ₹6.8 lakh a year against ₹5.76 lakh in rent. The result flips if prices keep rising faster than inflation: India’s real house prices rose about 3.85% a year from 2009 to 2025 on the OECD’s series36, and at that pace the owning cost falls to under 1% of the price. That is the Indian argument in one line: the rent alone does not justify buying, so the case rests on prices beating inflation, as they have since 2009, which nobody can promise. Karnataka’s stamp duty and registration fees add several per cent of the price on top, paid once, and belong in the break-even sum before deciding.
Austin: the clearest case for renting
The Garcias, both 36, rent in Austin and keep being told they are wasting money. The typical Austin-area home was worth $417,977 in August 2026 and the typical rent was $1,6222324. At 7.28%3 and Texas’s 1.40% average effective property tax on owner-occupied homes25, owning costs about $32,101 a year against $19,464 in rent. The typical rent is for a smaller home than the typical house, so the true gap is narrower, though not by anything like $12,600. Bills vary by school district and county, so their own appraisal notice is the figure to use. Austin also shows why price growth is not a given: the typical home value is 26.8% below its June 2022 peak23. The Garcias’ honest plan is to rent, invest the difference every month, and look again if rates fall.
Singapore: an HDB flat is cheap to own and dear to rent
Jun Hao and Pei Shan, both 30, are choosing between renting a 4-room HDB flat and buying one. In July to September 2026 the median 4-room resale price was S$628,000 across 3,269 sales, and the median approved rent for a 4-room flat S$3,400 a month across 3,226 approvals2627. An HDB loan can cover up to 75% of the price and is pegged 0.1 point above the prevailing CPF interest rate6; the Ordinary Account rate is 2.5% for October to December 202614. On those figures owning costs about S$10,048 a year against S$40,800 in rent, and Buyer’s Stamp Duty of S$13,440 is earned back in about five months37. Two cautions: an HDB lease runs 99 years and an older flat’s value falls as the lease runs down, so add a depreciation allowance for any flat past its middle age; and CPF used for the purchase must be refunded to your account, with the interest it would have earned, when you sell38.
How long you need to stay
Transfer taxes and fees are paid once, so their yearly cost depends on how long you spread them. Divide what buying and later selling cost by the yearly saving from owning, if there is one. London’s stamp duty alone is about 2.7 years of saving; Singapore’s about five months; in Austin and Sydney there is no yearly saving to earn anything back at today’s rates. If owning costs more each year than renting, no length of stay fixes it — only price growth beyond inflation, or a fall in rates, can.
Rates in force in October 2026 for a resident buying a home to live in. Second homes, foreign buyers and permanent residents in Singapore pay surcharges on top. India’s stamp duty and registration are set by each state. 2831323437
Purchase tax on the example home
Amount
Basis
UK Stamp Duty Land Tax (England), £550,000
£17,500
0% to £125,000, 2% to £250,000, 5% to £925,000
Ontario + Toronto land transfer tax, C$700,000
C$20,950
Each: 0.5%, 1%, 1.5%, then 2% above C$400,000
NSW transfer duty, A$1,050,000
A$41,437
A$11,602 plus A$4.50 per A$100 above A$387,000
Singapore Buyer’s Stamp Duty, S$628,000
S$13,440
1%, 2%, then 3% to S$1 million
What history says about house prices
The case for buying usually rests on prices rising. Over 1970 to 2025, real house prices — after inflation — rose about 2.9% a year in the UK and Australia, 3.01% in New Zealand, 2.77% in Canada and 1.86% in the United States, but only 0.55% in Japan and 0.20% in Germany36. Those national averages hide long losses: Japan’s real prices fell 43.4% from 1991 to 2009 and in 2025 were still 28.8% below the 1991 peak, and US real prices fell 27.2% between 2006 and 201136. Robert Shiller’s *Irrational Exuberance* shows that over a century real home prices in the US rose far less than most owners assume, and argues that housing booms feed on psychology and expectations as much as on fundamentals39. A house is also leverage: with a 20% deposit, a 10% fall takes half your equity.
Compound annual change in the OECD real house price index (nominal prices deflated by consumer prices). India’s series begins in 2009. 36
Country
Real house price growth a year
Period
New Zealand
3.01%
1970–2025
United Kingdom
2.90%
1970–2025
Australia
2.90%
1970–2025
Canada
2.77%
1970–2025
United States
1.86%
1970–2025
Japan
0.55%
1970–2025
Germany
0.20%
1970–2025
India
3.85%
2009–2025
The part that is not arithmetic
The numbers rarely settle it on their own, and pretending otherwise is how people end up in the wrong house. Owning buys control: no landlord deciding to sell, the freedom to knock down a wall, a school catchment you will not be moved out of. It also works as forced saving for people who would not invest the difference, and a paid-off home cuts what you need to live on later. Renting buys flexibility: you can move for a better job in a downturn, you are not concentrated in one building in the same city as your income, and a repair is somebody else’s weekend. Neither is the responsible choice by default.
Find the rent on a home you would actually buy, not the average for the city.
Add up property tax, 1% maintenance (more for an old building or one with service charges), and your mortgage rate less a cautious price-growth assumption1.
Compare that yearly cost of owning with a year’s rent.
Add every one-off cost: transfer tax, legal and lender fees, moving, and selling costs later.
Divide the one-offs by the yearly saving, if there is one, to get the years you would need to stay.
Check the deposit leaves your emergency fund intact, and that you could pay the loan at a rate two points higher.
Putting the choice into your own plan
Questions people ask
Is renting throwing money away?
No. Rent buys housing, and so do mortgage interest, maintenance, property tax and the return a deposit gives up. Ben Felix put an owner’s unrecoverable costs at about 5% of the home’s value a year in 20191; at 2026 mortgage rates they are higher in many cities.
What is the 5% rule for renting versus buying?
Multiply the home’s price by 5% and divide by 12. If a similar home rents for less than that a month, renting is cheaper; if more, buying is. The 5% is roughly 1% property tax, 1% maintenance and 3% cost of capital, set when mortgages cost about 3%1.
Is it better to rent or buy in 2026?
It depends on the city. On the method here, owning the average London home costs somewhat less than renting it, owning a typical Austin home costs about $12,600 a year more than renting, and owning a median HDB 4-room flat costs far less than renting one212326.
How long do I need to live in a house for buying to be worth it?
Divide the one-off costs by the yearly saving from owning. UK stamp duty on a £550,000 home is £17,500, about 2.7 years of the saving in the London example28. If owning costs more each year than renting, no length of stay makes it cheaper unless prices rise faster than inflation.
What are mortgage rates in October 2026?
The US 30-year fixed averaged 7.28% on 1 October 20263; a UK two-year fix at 75% LTV averaged 4.92% in August4; new Australian owner-occupier loans averaged 6.24% in June5; SBI’s home loans start at 7.25%12.
How much does maintenance cost on a house?
A common planning figure is 1% of the home’s value a year, the figure in Felix’s 5% rule1. Older homes, flats with service or strata charges and homes in harsh climates cost more.
Is an HDB flat better to buy or rent?
For an eligible household, buying is usually far cheaper each year: the median 4-room flat sold for S$628,000 and rented for S$3,400 a month in July–September 20262627, and the HDB loan is pegged 0.1 point above the CPF rate, which is 2.5%614. Allow for lease decay on older flats.
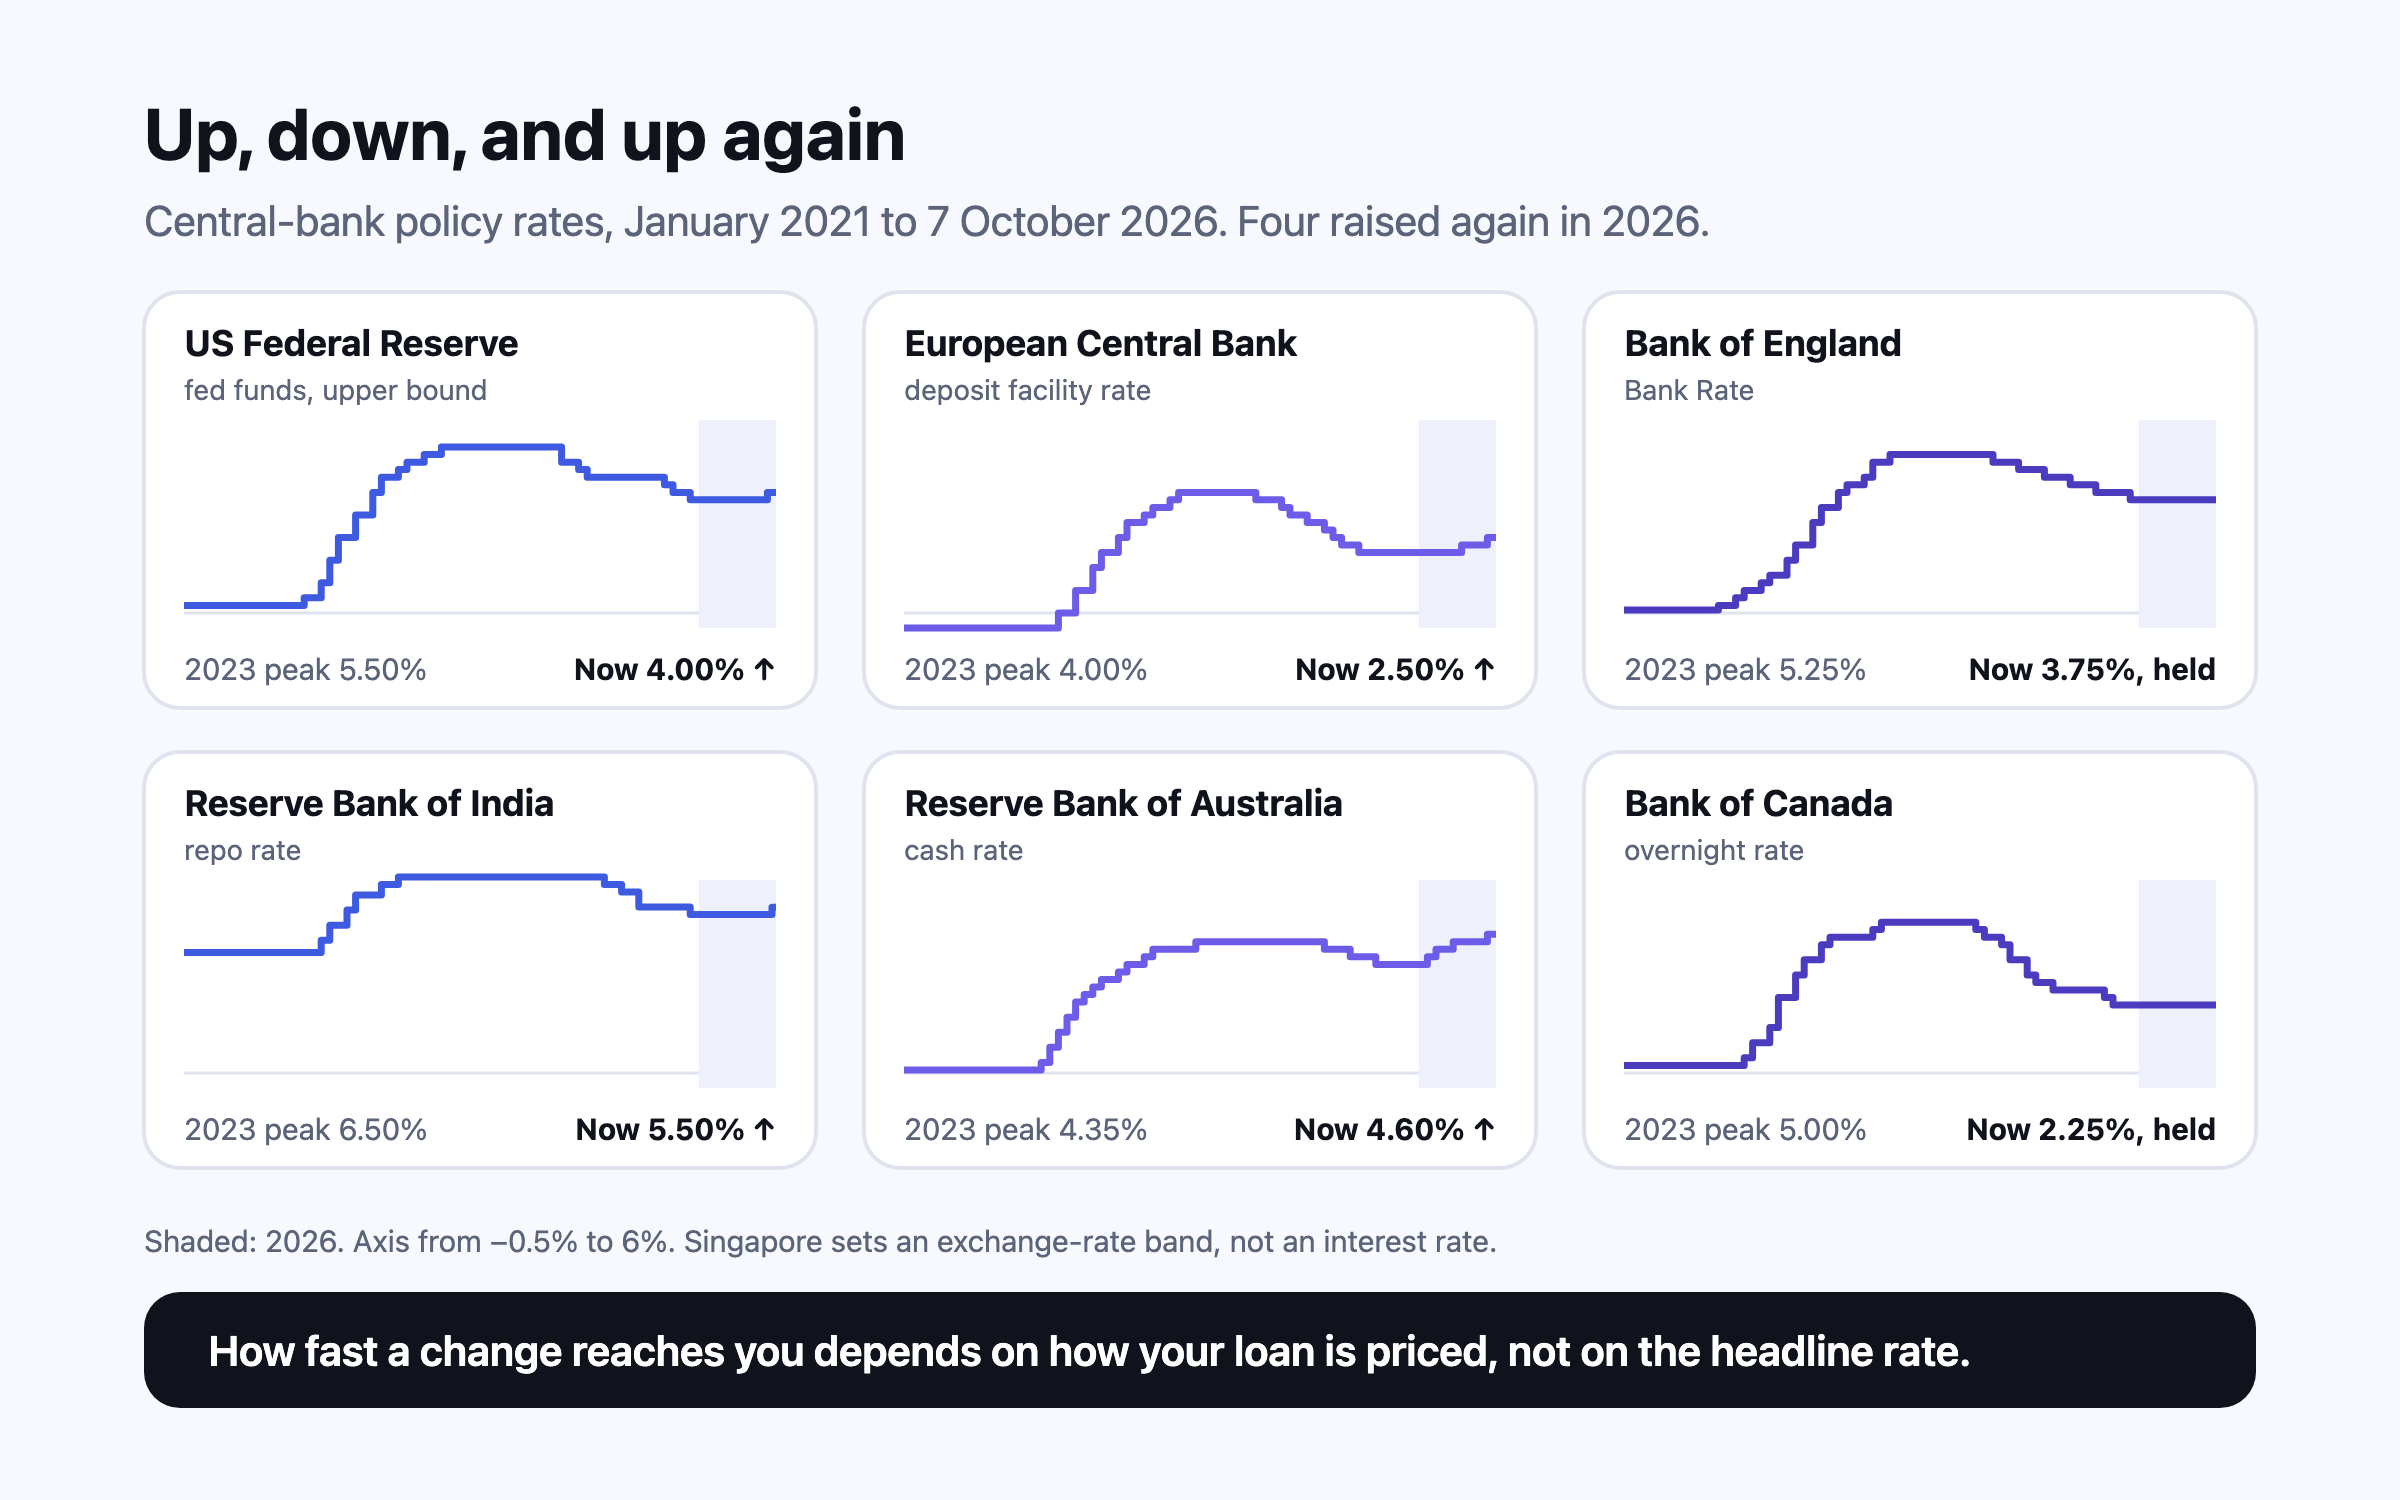
After cutting through 2024 and 2025, several central banks raised rates again in 2026 as energy prices, driven up by the conflict in the Middle East, pushed inflation back above target: the Fed to 3.75–4.00% in September, the RBA to 4.60%, the ECB to 2.50% and, on 7 October, the RBI to 5.50%. A rise reaches a US household with a 30-year fixed mortgage barely at all, an Australian or Indian floating-rate borrower within months, and a British or Canadian one when their fix ends. Savers gain, but more slowly than borrowers pay.
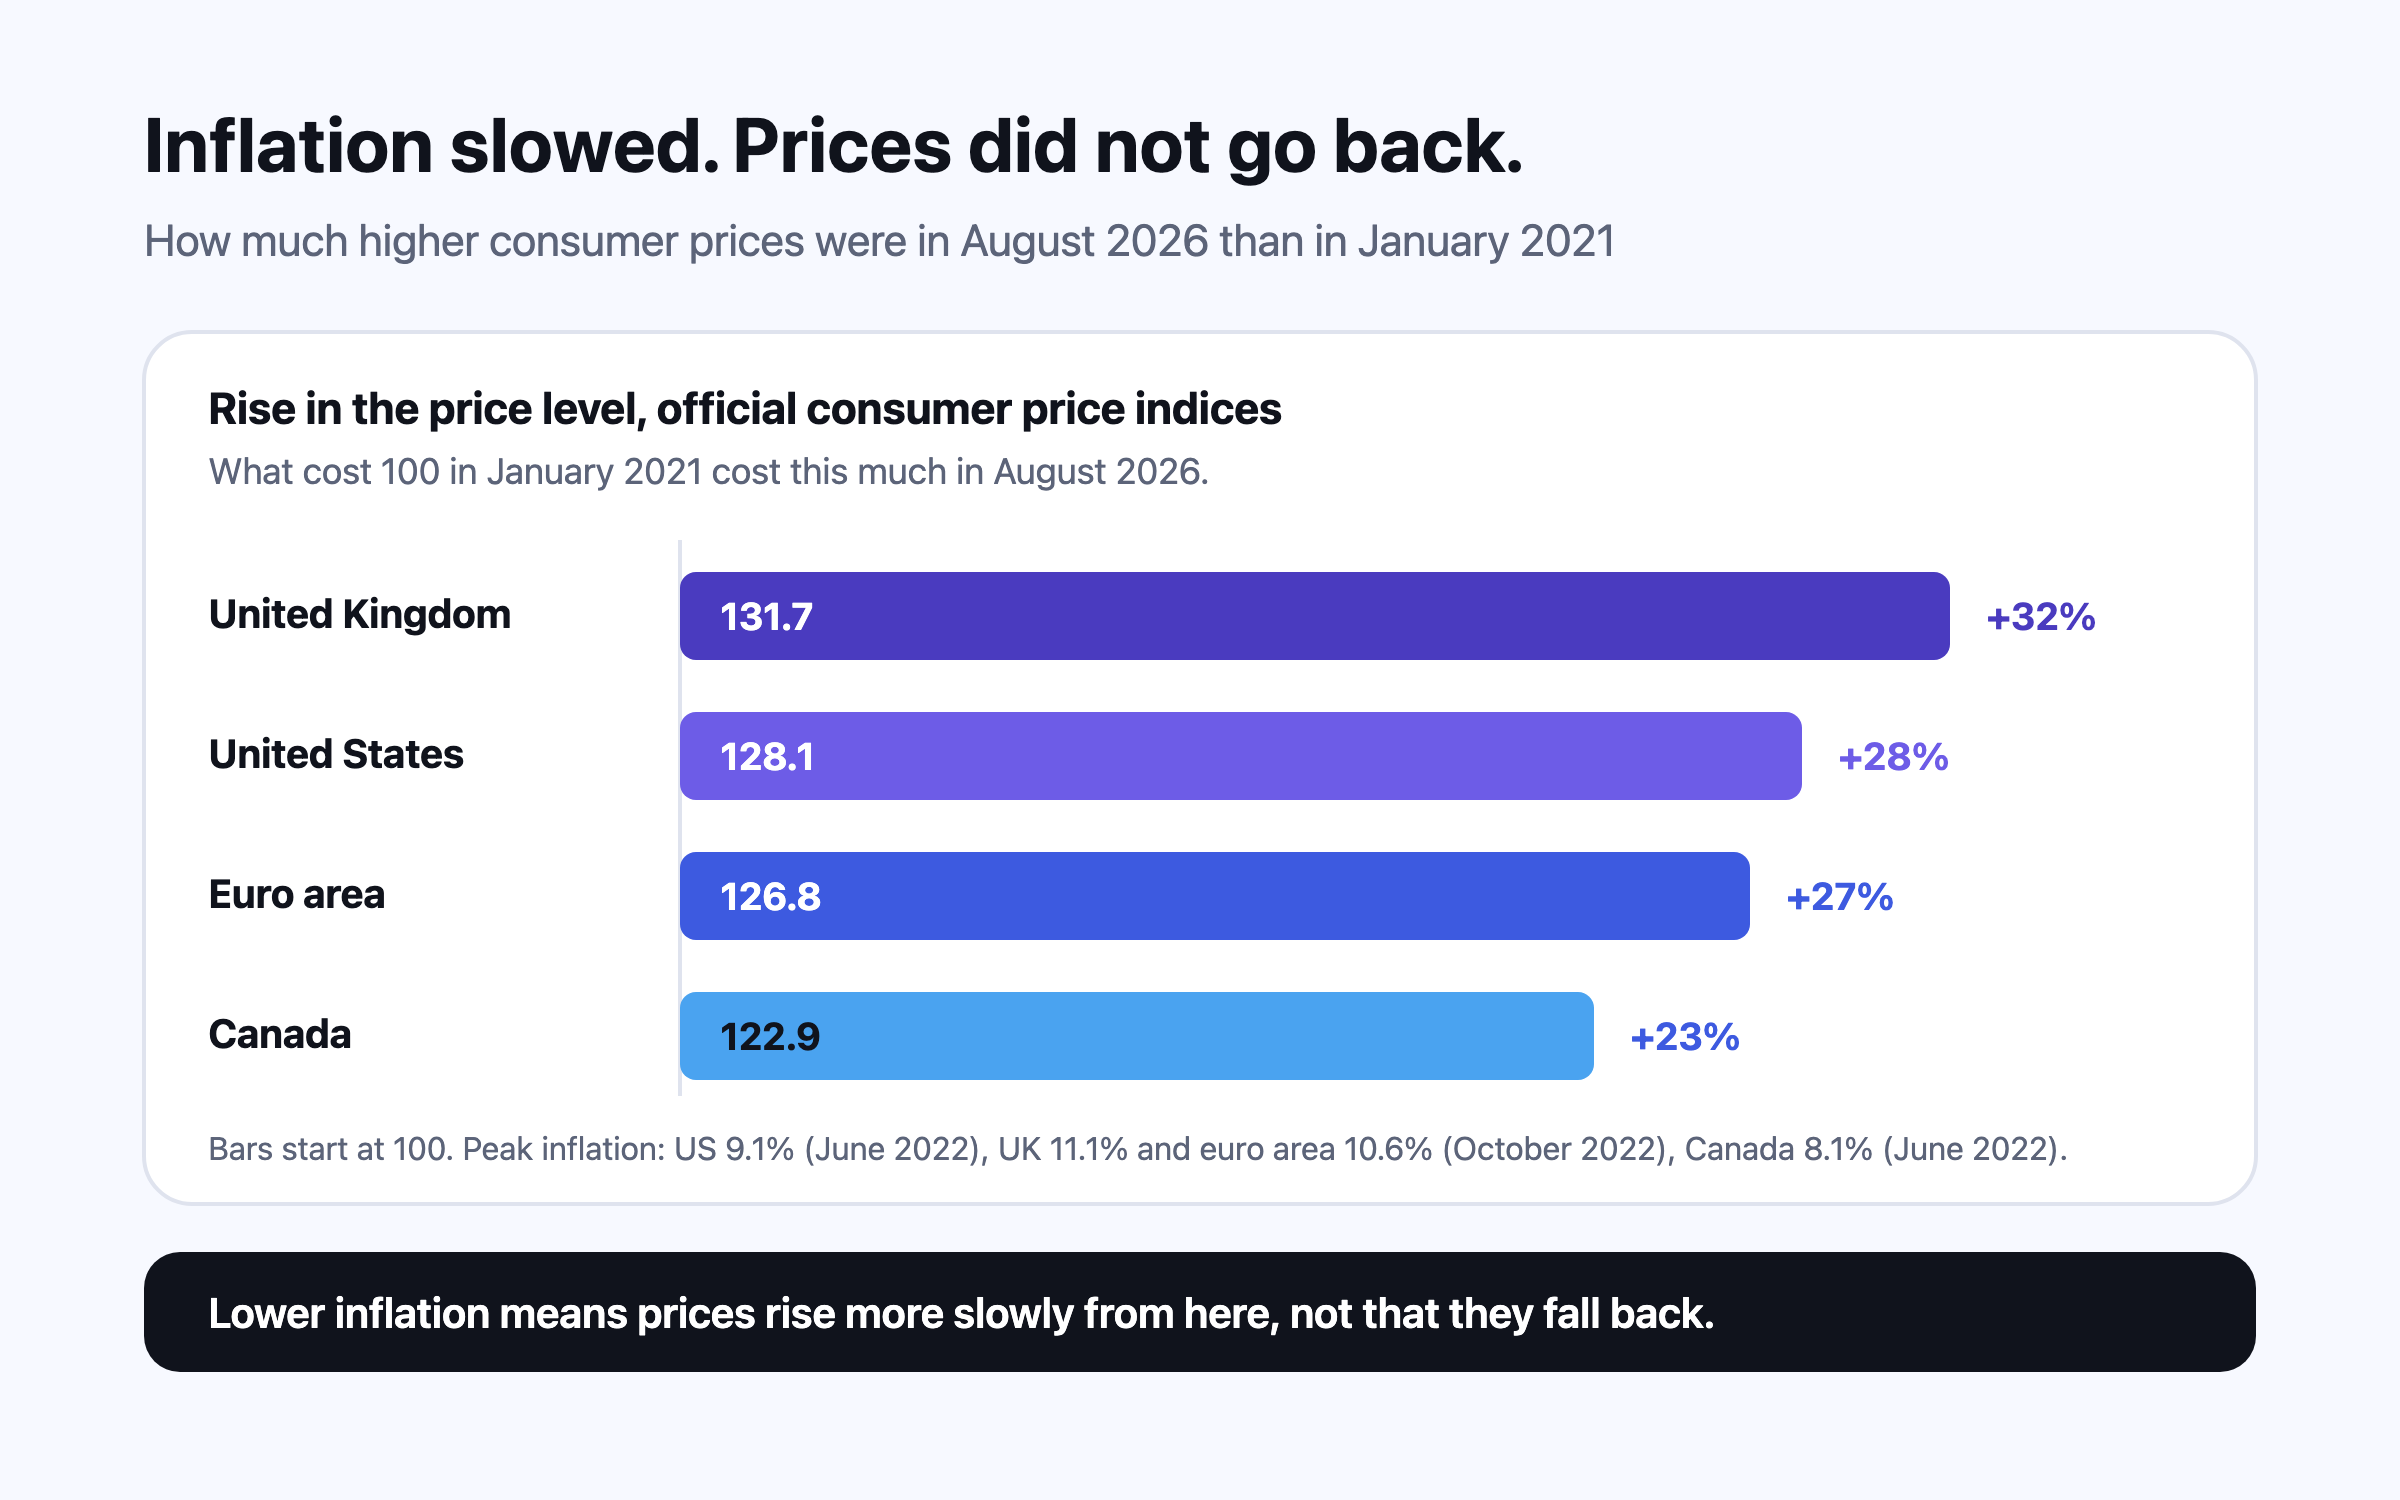
Inflation peaked at 9.1% in the US, 11.1% in the UK and 10.6% in the euro area in 2022, and pay fell behind prices almost everywhere. Inflation then slowed, but the price level never came back down: US consumer prices in August 2026 were about 28% above January 2021, UK prices about 32%. A 2026 energy shock has pushed inflation up again, to 3.8% in the euro area in September. Budgets, pay talks and long-term plans all have to work from the new price level.
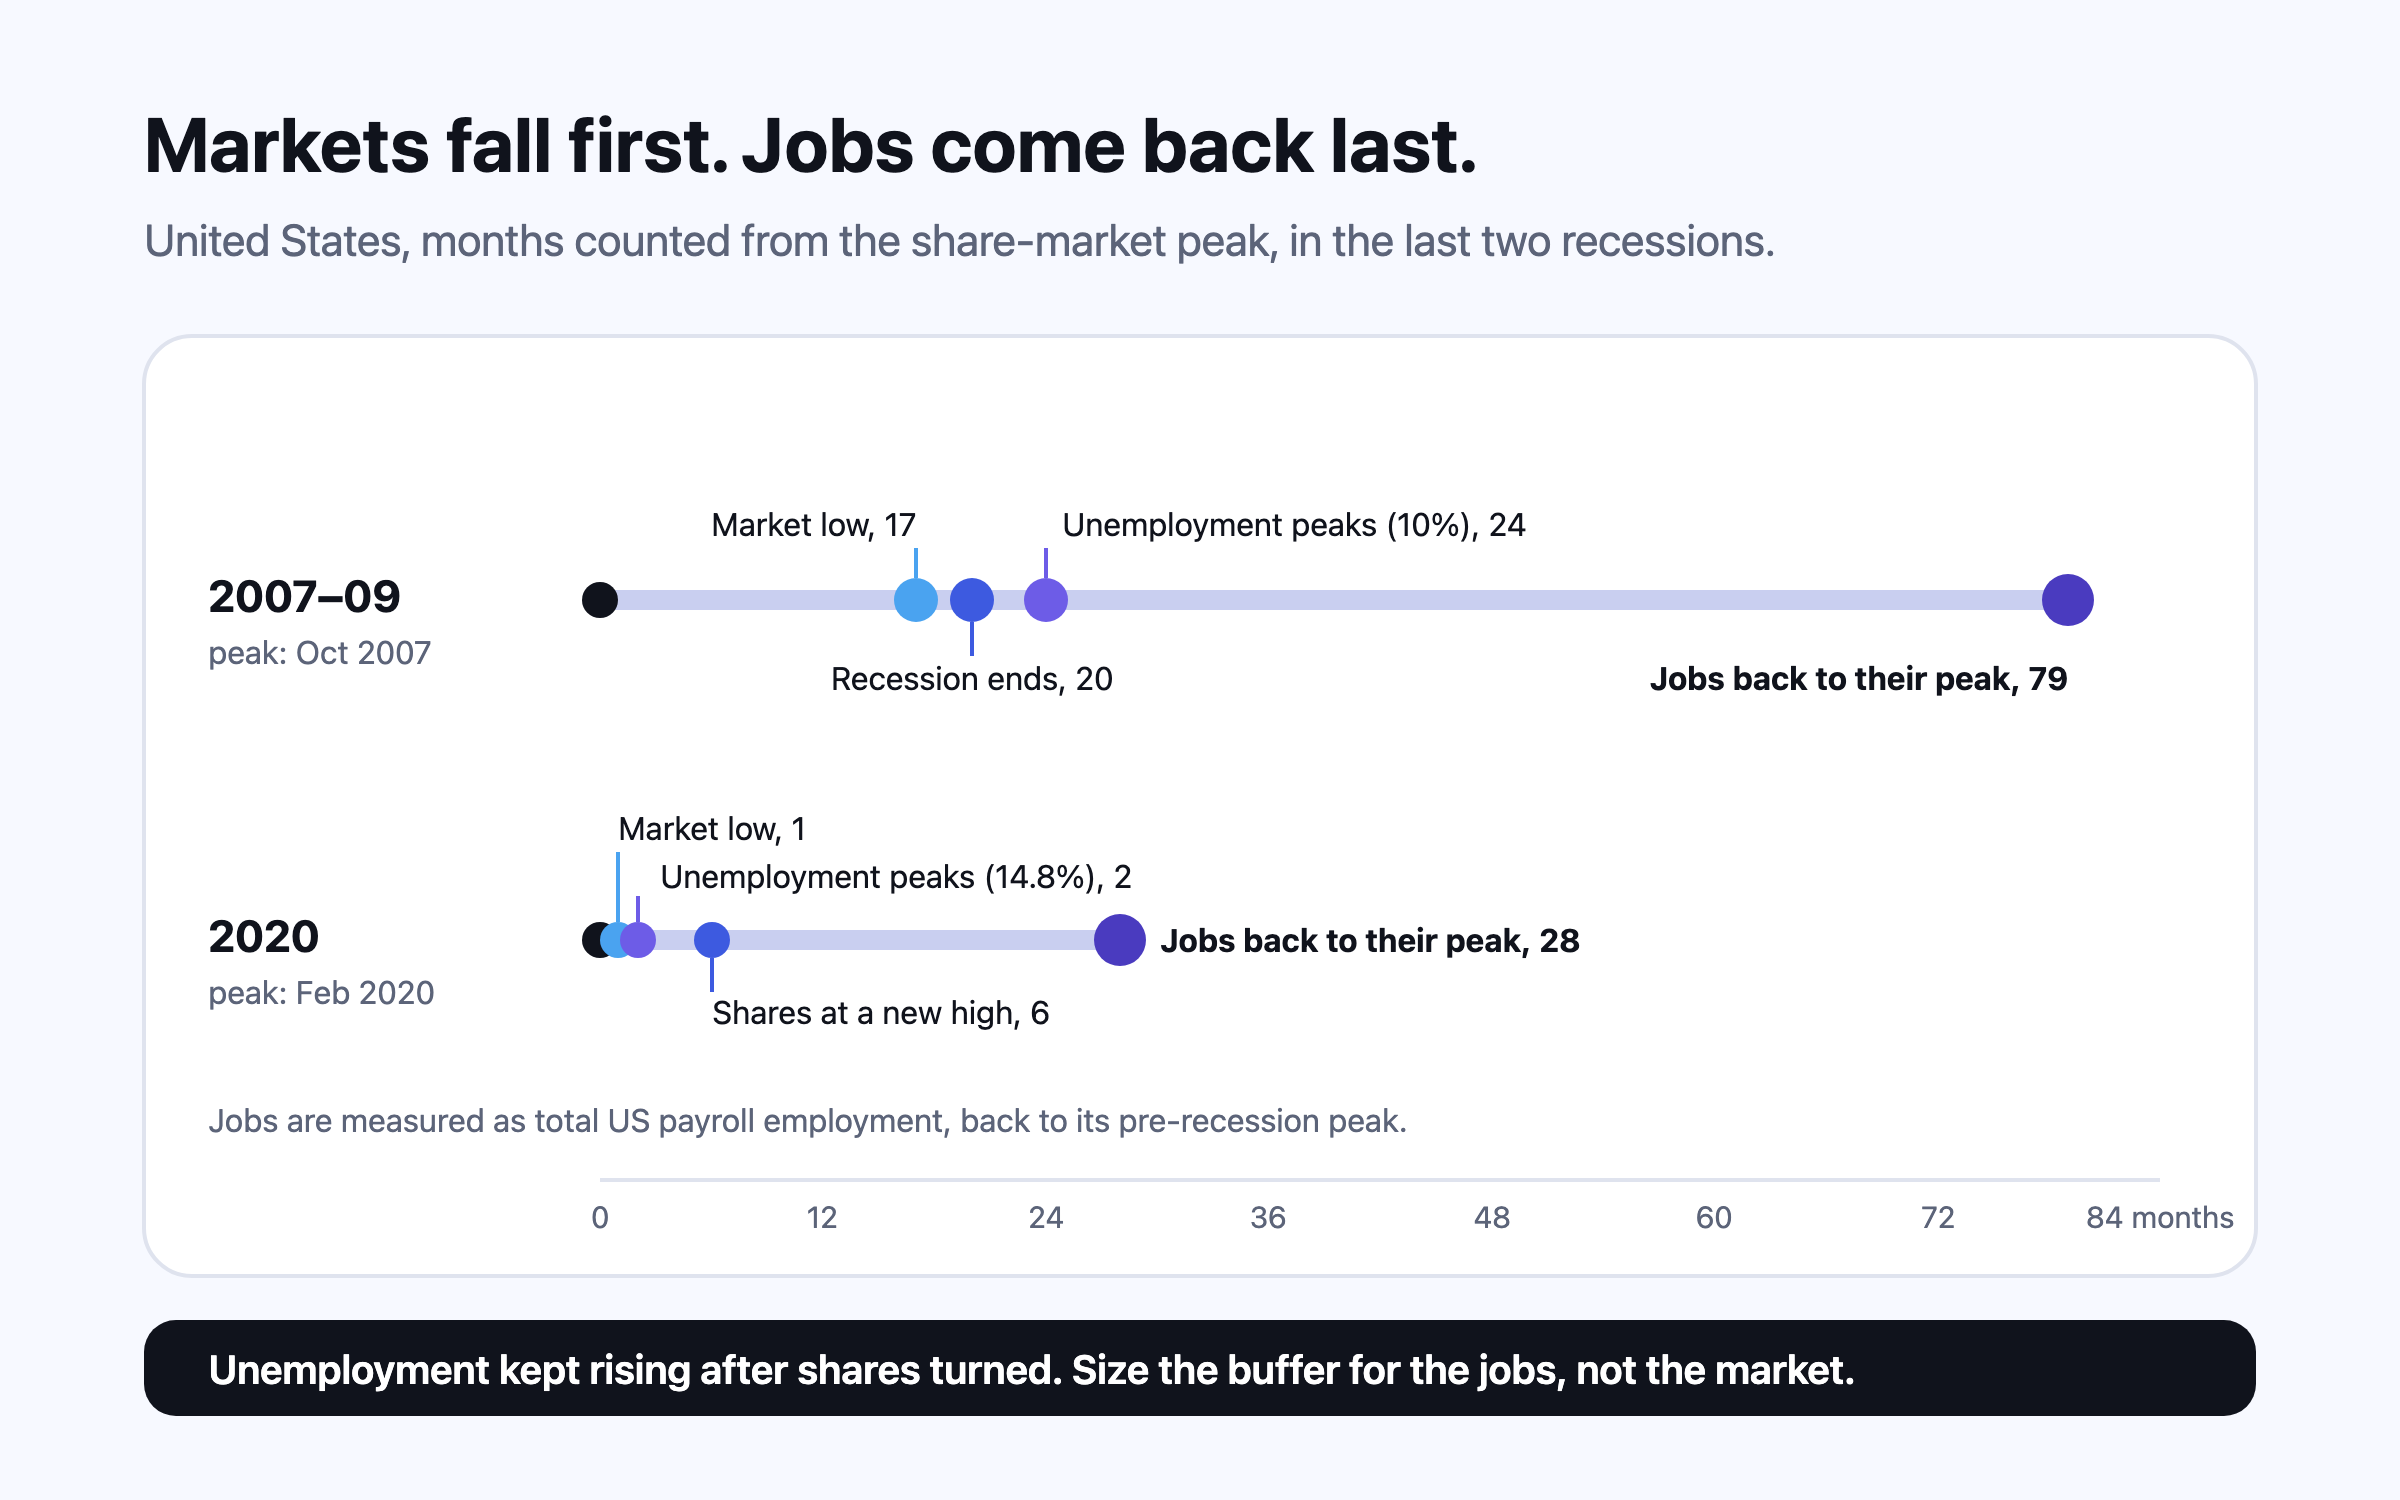
In the US the share market bottomed in March 2009, unemployment peaked seven months later at 10%, and payroll jobs did not regain their early-2008 level until May 2014. The cash that carries a household through is sized by how long a search can take in a bad year — the median reached 25 weeks in 2010 — and the portfolio is protected mostly by not being sold at the bottom.
This is general information, not financial, tax or legal advice for your circumstances. Rules and figures change; check the official source for your country, and consult a licensed professional before making financial decisions. Projections are estimates, not predictions.