In the last two recessions share prices hit bottom months before unemployment peaked, and jobs took years longer than markets to come back.
In the US the share market bottomed in March 2009, unemployment peaked seven months later at 10%, and payroll jobs did not regain their early-2008 level until May 2014. The cash that carries a household through is sized by how long a search can take in a bad year — the median reached 25 weeks in 2010 — and the portfolio is protected mostly by not being sold at the bottom.
Nivritee Research · 6 October 2026 · 8 min read
The pattern from the last two recessions is consistent enough to plan around. Share prices fall first and recover first; jobs are lost later and come back last. In the United States the S&P 500 fell 57% from its October 2007 peak to its trough in March 2009, and unemployment, 5% in December 2007, kept climbing for seven months after that market low, to 10% in October 20091. Payroll employment did not get back to its January 2008 level until May 20142. A household needs two things from that history: enough cash to outlast a long job search, and a plan that does not depend on selling shares when they are cheapest.
The two recessions were different animals. 2008–09 was a financial crisis that ground on for years; 2020 was a sudden shutdown, followed by an unusually fast rebound in most places. The table shows the rate before each, its peak, and the latest reading as of early October 2026. India is missing on purpose: its Periodic Labour Force Survey began only in 2017–18 and moved to monthly releases in 2025, so there is no comparable series covering 2008, and this article does not borrow one from elsewhere5.
Seasonally adjusted unemployment rates. UK figures are rolling three-month periods. Canada’s series is Statistics Canada’s current, revised one. Australia’s history is the OECD harmonised series, its latest reading the ABS headline. The euro area is the present 21-member area throughout. 3678910
Economy
2008–13: before → peak
2020: before → peak
Latest (2026)
United States
5.0% (Dec 2007) → 10.0% (Oct 2009)
3.5% (Feb 2020) → 14.8% (Apr 2020)
4.2% (Sep)
United Kingdom
5.2% (Jan–Mar 2008) → 8.5% (Sep–Nov 2011)
3.7% (Oct–Dec 2019) → 5.3% (Oct–Dec 2020)
4.9% (May–Jul)
Canada
6.1% (Jan 2008) → 8.8% (Jun 2009)
5.5% (Jan 2020) → 14.2% (May 2020)
6.4% (Aug)
Australia
4.0% (Feb 2008) → 5.9% (Jun 2009)
5.1% (Feb 2020) → 7.4% (Jul 2020)
4.6% (Aug)
Euro area
7.3% (Feb 2008) → 12.3% (Feb 2013)
7.1% (Mar 2020) → 8.6% (Aug 2020)
6.4% (Aug)
Three things stand out. The euro area’s 2008 recession never really ended for its labour market: unemployment kept rising into 2013, through the sovereign-debt crisis that followed10. The 2020 spike was enormous in North America and muted in the UK and continental Europe, where furlough and short-time work schemes kept people on payrolls while they were idle610. And the UK’s peak arrived in September to November 2011, long after output had started growing again. That slow tail is the part households underestimate6.
How long a job search takes, in good years and bad
The question people ask after a layoff is not the national rate but their own odds of being back at work in three or six months. The US Bureau of Labor Statistics publishes the answer every month. In an ordinary labour market the median spell of unemployment is around two to two and a half months; at the worst of the last crisis it was 25.2 weeks, close to six months, in June 20104. The average was higher still, peaking at 40.7 weeks in July 2011, because a minority of very long searches pulls the mean up11. In April 2010, 45.5% of unemployed Americans had been looking for more than 27 weeks12.
Duration of unemployment from the Current Population Survey, seasonally adjusted. The peaks arrive a year or more after the recessions that caused them. 41112
United States
Median search
Average search
Share out of work 27+ weeks
Worst of 2008–13
25.2 weeks (Jun 2010)
40.7 weeks (Jul 2011)
45.5% (Apr 2010)
Worst after 2020
20.3 weeks (Mar 2021)
32.0 weeks (Jun 2021)
43.0% (Mar 2021)
September 2026
11.5 weeks
24.8 weeks
27.1%
Britain shows the same long tail today. In May to July 2026, of 1,778,000 unemployed people, 973,000 had been looking for up to six months, 342,000 for six to twelve months and 463,000 for more than a year13. That is about 26% unemployed for over a year and about 45% for over six months — in a labour market with no recession declared13. Long-term unemployment is not a recession-only risk; it is what happens to a large minority of people every year.
Markets fall first and recover first
Share prices are a guess about future profits, so they move on expectations; unemployment moves on what firms actually do months later. The table lines up the two US episodes. In both, the market low came before the recession ended and before unemployment peaked, and jobs were the last thing to recover1142.
Market dates and falls are for the S&P 500 price index: 2007–09 from the Federal Reserve’s history of the Great Recession, 2020 from the daily index. The 2007–09 recovery date uses the OECD’s monthly-average index, which smooths daily swings. Payroll losses run from January 2008 to February 2010, and from February to April 2020. 115143216
United States
2007–09
2020
Share-market peak
October 2007
19 February 2020
Share-market low
March 2009, 57% below the peak
23 March 2020, 33.9% below the peak
Recession ends (NBER trough)
June 2009
April 2020
Unemployment peaks
October 2009, at 10.0%
April 2020, at 14.8%
Share prices back above their peak
January 2014, on the OECD’s monthly US index
18 August 2020, on the S&P 500
Payroll jobs back to their peak
May 2014, after losing about 8.7 million
June 2022, after losing about 21.9 million
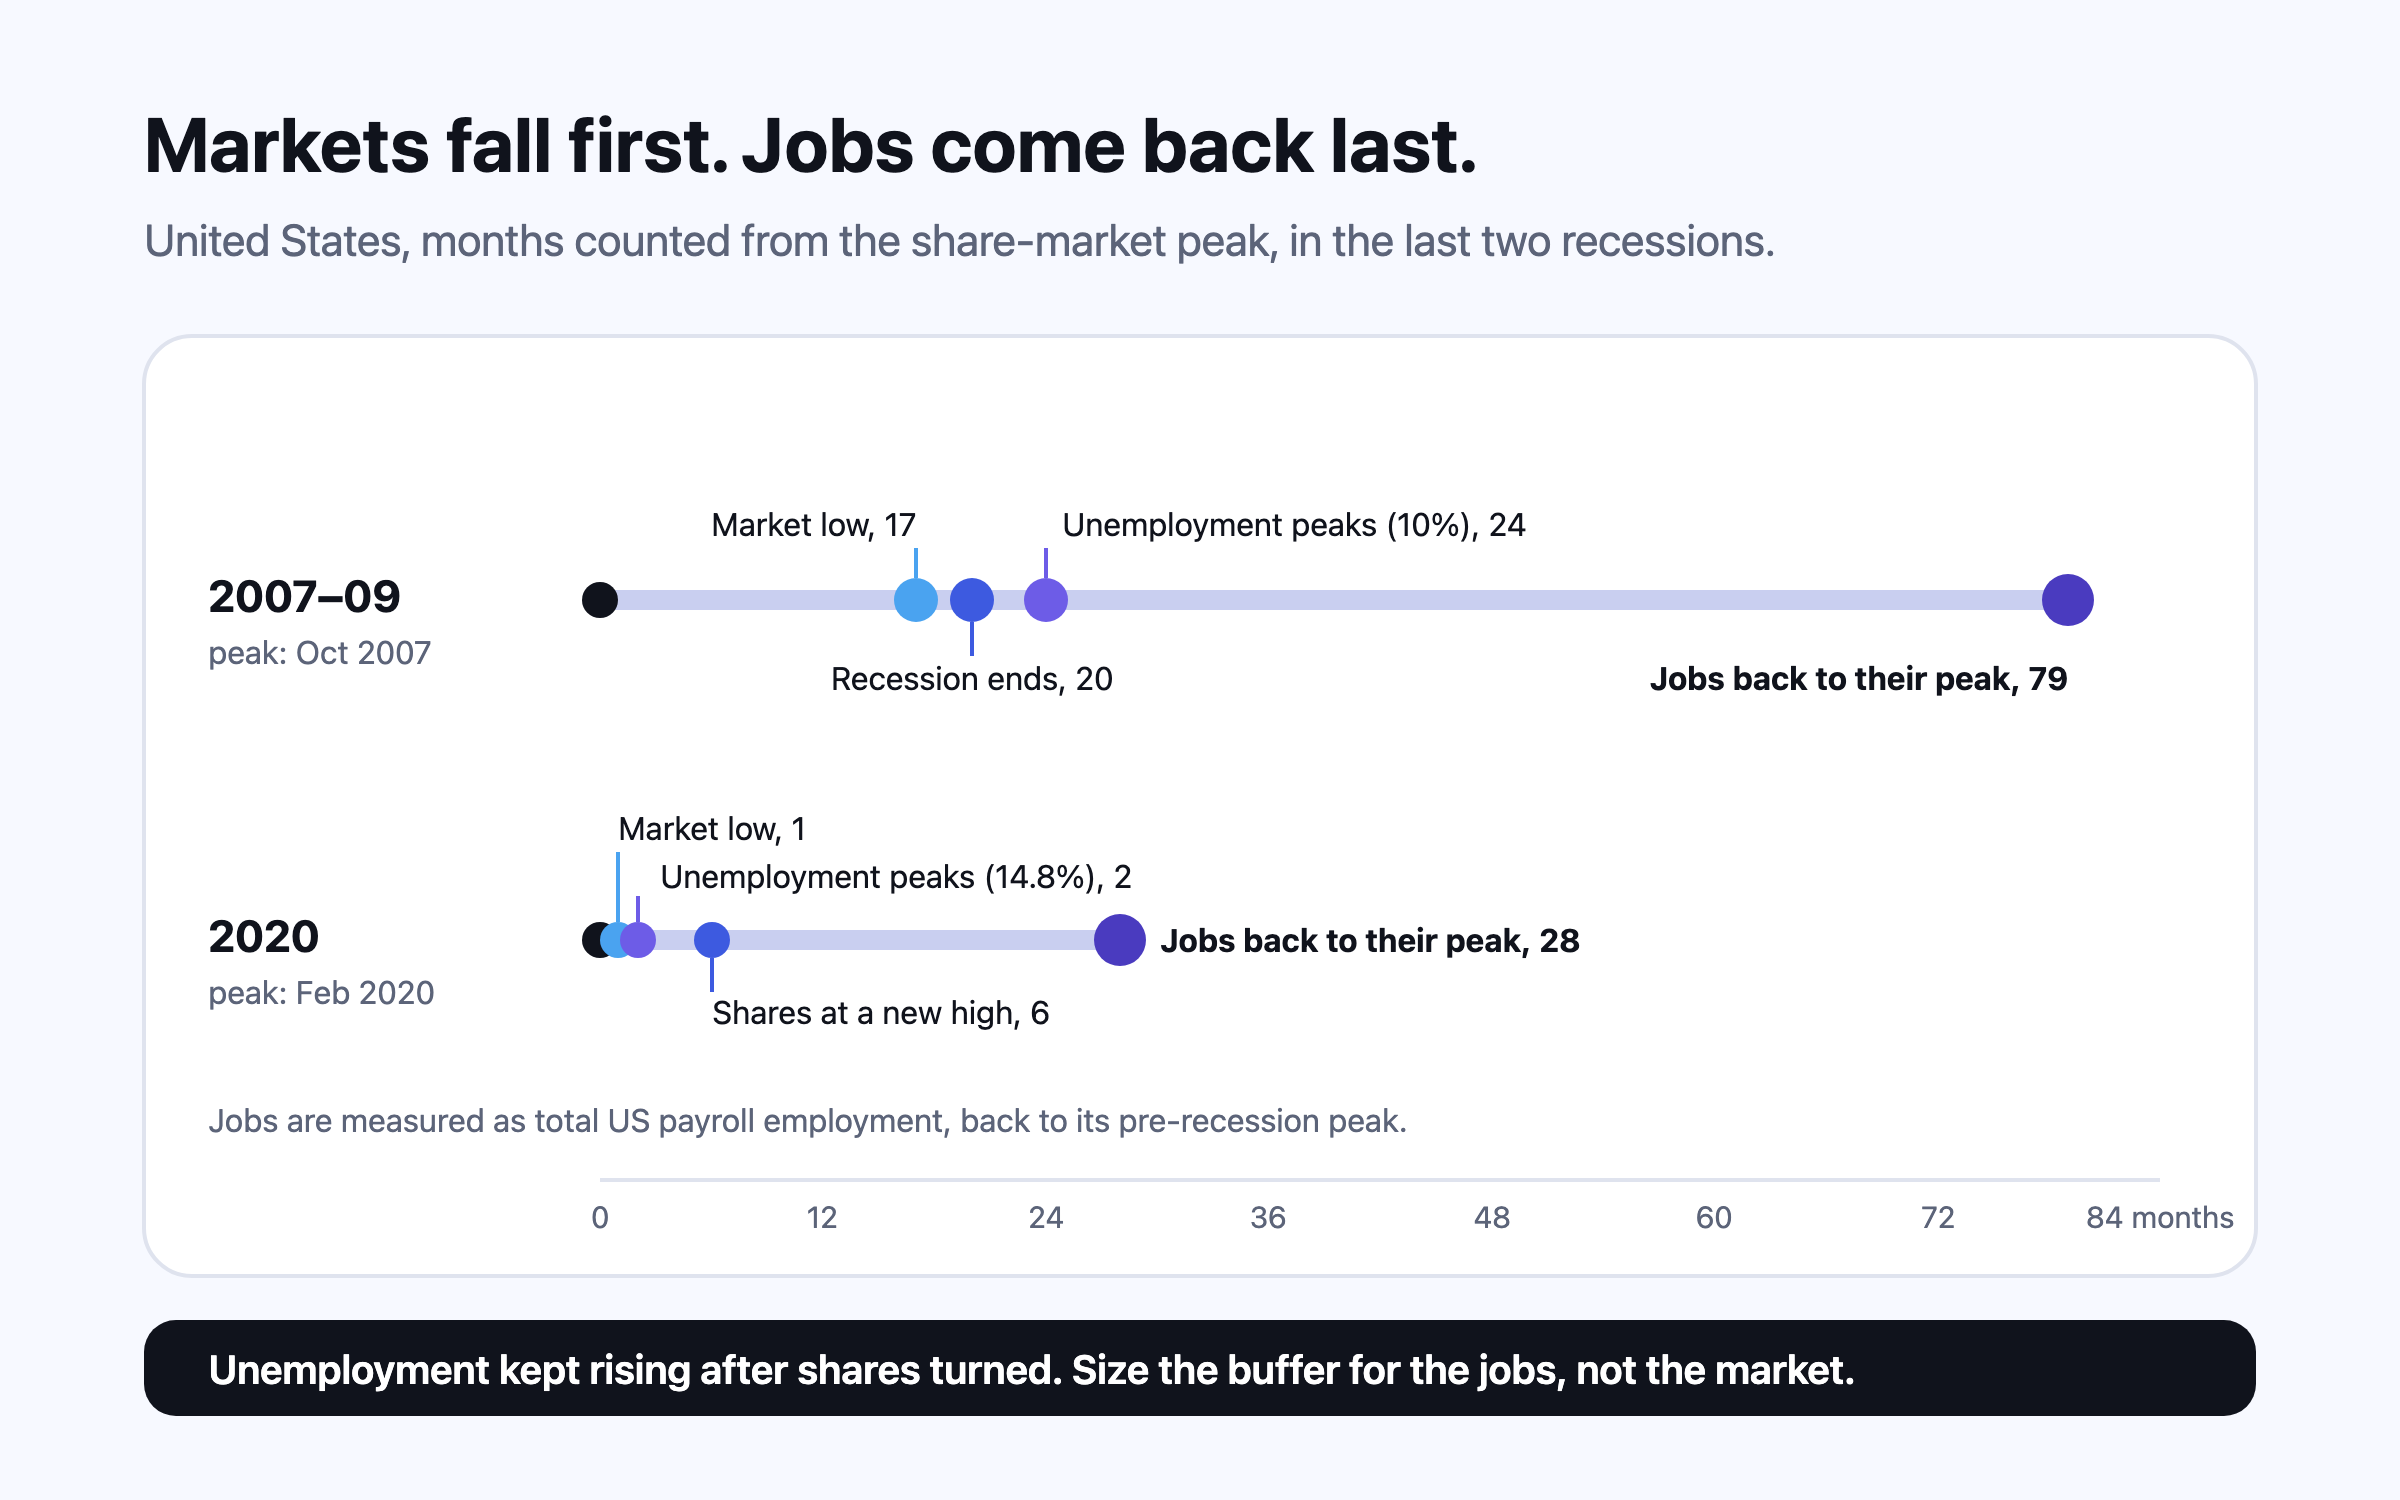
Measured from the 2007 peak, the market low came after 17 months, the recession ended at 20, unemployment peaked at 24 and jobs were regained only after 79. In 2020 the same sequence ran in fast-forward: the low after one month, unemployment’s peak after two, a new market high after six and jobs after 281152. On the OECD’s monthly-average US share index, the 2007–09 fall was 53% and the index did not regain its October 2007 level until January 201416.
Markets also fall without recessions. The S&P 500 dropped 25.4% between 3 January and 12 October 2022, as interest rates rose, while US unemployment never went above 4.0% that year; the index did not close above its January 2022 level until 19 January 2024153. And recovery has no timetable: Japan’s Nikkei 225 took more than 34 years to close above its 1989 peak17. The US record is the friendliest in the data, which is one reason to own more than one market (global diversification over 125 years).
Which jobs go first
Recessions are not evenly spread. Each one hits the industries closest to its cause, and the households working in them take most of the loss.
Seasonally adjusted payroll employment from the BLS Current Employment Statistics survey. Each starting point is the industry’s high before the fall, except manufacturing, which had been shrinking for decades and is measured from the start of the recession in December 2007. The last two rows are not a recession: they are the slowdown in US technology employment, still under way in September 2026. The information sector covers software publishing, telecoms, data processing and media as well as internet companies. 1819202122
US industry
Before the fall
Low point
Change
Construction (2006–11)
7,726,000 (Apr 2006)
5,427,000 (Jan 2011)
−29.8%
Manufacturing (2007–10)
13,739,000 (Dec 2007)
11,439,000 (Feb 2010)
−16.7%
Leisure and hospitality (2020)
16,889,000 (Feb 2020)
8,719,000 (Apr 2020)
−48.4%
Information (2022–26)
3,115,000 (Nov 2022)
2,739,000 (Sep 2026)
−12.1%
Computer systems design (2023–26)
2,483,500 (Mar 2023)
2,355,400 (Sep 2026)
−5.2%
The technology layoffs of 2022 onwards are the clearest case of an industry downturn running without a general recession. Official US data show employment in the information sector falling from 3,115,000 in November 2022 to 2,739,000 in September 2026, a loss of 376,000 jobs, while total payrolls kept growing212. Layoffs.fyi, the tracker most often quoted in the press, has counted publicly reported layoffs at technology companies worldwide since 202023. It is useful as a running signal, but it counts announcements, not people out of work: some cuts are planned and never happen, some are overseas, and none of it nets off hiring. For the size of the damage, use the statistics offices.
Where the labour market stands in October 2026
The NBER, which dates American recessions, had not called one as of early October 2026; its last recorded downturn ended in April 202014. But the direction has turned. US unemployment was 4.2% in September, after touching 4.5% in November 20253, and payrolls grew by only about 29,000 in September on the first estimate2. The median job search, 11.5 weeks, is longer than at any point in 2022 or 20234. British unemployment was 4.9% in May to July 2026, against 3.6% in mid-20226. Canada’s was 6.4% in August7, the euro area’s 6.4%10, and Australia’s rose 0.4 points over the year to 4.6% in August9 — before the Reserve Bank of Australia raised its cash rate to 4.60% at the end of September24. Higher borrowing costs and softer hiring together are the conditions in which a household’s buffer matters most.
Four households, one question: how long could we last?
The figures below are illustrative households, chosen to look like readers rather than averages. The question each asks is the same: if one income stopped tomorrow, how many months could we pay our essential bills?
Dan and Lauren, 38 and 36, Columbus, Ohio. Together they take home $9,200 a month, $5,000 of it Dan’s. Their essential spending — mortgage, food, insurance, utilities, childcare, minimum debt payments — is $6,100, and they keep $24,000 in a high-yield savings account. That is 3.9 months of essentials, which sounds thin. But if Dan lost his job, Lauren’s $4,200 would still arrive, leaving a monthly gap of $1,900 that $24,000 covers for 12.6 months, longer than the average US search at its 2011 peak of 40.7 weeks11. A second income is the strongest emergency fund most couples have.
Chris, 44, a Leeds engineering manager and his family’s only earner. Essentials are £3,400 a month and the family has £12,000 in easy-access savings, 3.5 months’ worth. With about 26% of Britain’s unemployed out of work for more than a year13, his target is six months — £20,400, so £8,400 more. Beyond that, he and his wife have written down which costs go first if a search runs past six months: the second car, the holiday fund, and the overpayments on the mortgage.
Pooja, 31, a product manager in Bengaluru. She takes home ₹2.1 lakh a month, spends ₹85,000 on essentials and keeps ₹4.5 lakh in a sweep-in deposit: 5.3 months. Technology is the sector where cuts have run longest, with US information-sector employment down 12.1% from its 2022 peak21, so she aims for nine months, ₹7.65 lakh, and closes the ₹3.15 lakh gap over the next year before raising her SIPs. Her provident fund is not part of the buffer: it is for later, and drawing on it early costs her future self.
Wen Jie and Hui Lin Lim, 52 and 50, Singapore. Both work; their portfolio is S$900,000, of which S$630,000 is in global equity funds. A fall like the 33.9% of February–March 202015 would take about S$214,000 off the equities in a month. Their cash covers a year of essentials, so nothing has to be sold. Had they sold at the March 2020 low, they would have locked in that loss five months before the US index set a new high15. The cash buffer is what makes not selling possible.
Why selling in a downturn costs so much
The best measurement of what investors actually do in volatile markets is Morningstar’s annual Mind the Gap study, which compares a fund’s return with the return the average dollar invested in it earned, given when money went in and out. Over the ten years to the end of 2025 the average dollar in US mutual funds and ETFs earned 8.7% a year against the funds’ own 9.9%, a gap of about 1.2 points a year, around 12% of the return25. The gap was about 0.4 points in the least volatile fifth of funds and more than 2 points in the most volatile fifth, the ones most likely to provoke a trade25. Morningstar is careful to say that not all of the gap is bad behaviour; regular monthly investing opens one too. Its own reading of the volatility pattern is that big swings push investors into trading at the wrong moments.
Morgan Housel’s *The Psychology of Money* makes the point that matters for a recession: the goal is to be able to stay invested through the bad years, which means building room for error before they arrive26. Jeremy Siegel’s long record in *Stocks for the Long Run* shows shares rewarding patience over decades, while warning that the short-run path is violent27. Neither book says markets always recover quickly. Both say that a household forced to sell at the bottom turns a temporary fall into a permanent loss.
There is a real exception. Somebody already living off their portfolio cannot simply wait, because every withdrawal during a fall sells low (sequence-of-returns risk). The answer there is a runway of cash and short bonds for the first years of spending, so that shares are not sold into a crash — the idea behind the bucket strategy.
Work out essential monthly spending: what still has to be paid if an income stops.
Multiply by the months you need — about six for a single earner in a normal field, nine or more for one income in a cyclical industry or a household with dependants.
Hold that amount in deposits you can reach within days, in the currency you would spend, and mark it as separate from investments.
Write down now what you would cut, and in what order, if a search ran past the buffer.
Decide in advance that a market fall is not a reason to sell, and keep contributions going if your job is safe.
Refill the buffer before resuming extra investing once it has been used.
How long does it take to find a job after being laid off?
In the US the median search was 11.5 weeks in September 2026, but it reached 25.2 weeks in June 2010, after the financial crisis4. In Britain in May–July 2026 about 26% of unemployed people had been looking for more than a year13.
Do stock markets fall before a recession?
Usually, and they usually recover before jobs do. In 2007–09 the S&P 500 bottomed in March 2009, the recession ended in June, and unemployment peaked in October1. Markets also fall without recessions: the S&P 500 fell 25.4% in 2022 while US unemployment stayed at or below 4.0%153.
Should I sell my stocks before a recession?
The evidence is against trying. Over the ten years to 2025 the average dollar in US funds and ETFs earned about 1.2 points a year less than the funds themselves, because of the timing of purchases and sales25. A cash buffer that removes the need to sell is a more reliable protection than a forecast.
How big should my emergency fund be for a recession?
Base it on how long a search takes in a bad year: the US median reached about six months in 2010 and the average about nine in 2011411. Six months of essential spending suits most single earners; nine or more suits one income in a cyclical industry.
How long did it take jobs to recover after 2008 and 2020?
US payroll employment regained its January 2008 level in May 2014, 76 months later, and its February 2020 level in June 2022, 28 months later2.
Are we in a recession in 2026?
Not in the US on the official count: the NBER had not called a recession as of early October 202614. But hiring has slowed: US unemployment was 4.2% in September and the median search 11.5 weeks, longer than in 2022 or 202334.
How reliable is Layoffs.fyi?
It is a useful tracker of announced technology layoffs, compiled from public reports, but it counts announcements rather than people out of work and nets off no hiring23. Official employment data, such as the 376,000 fall in US information-sector jobs from November 2022 to September 2026, measure the net change21.
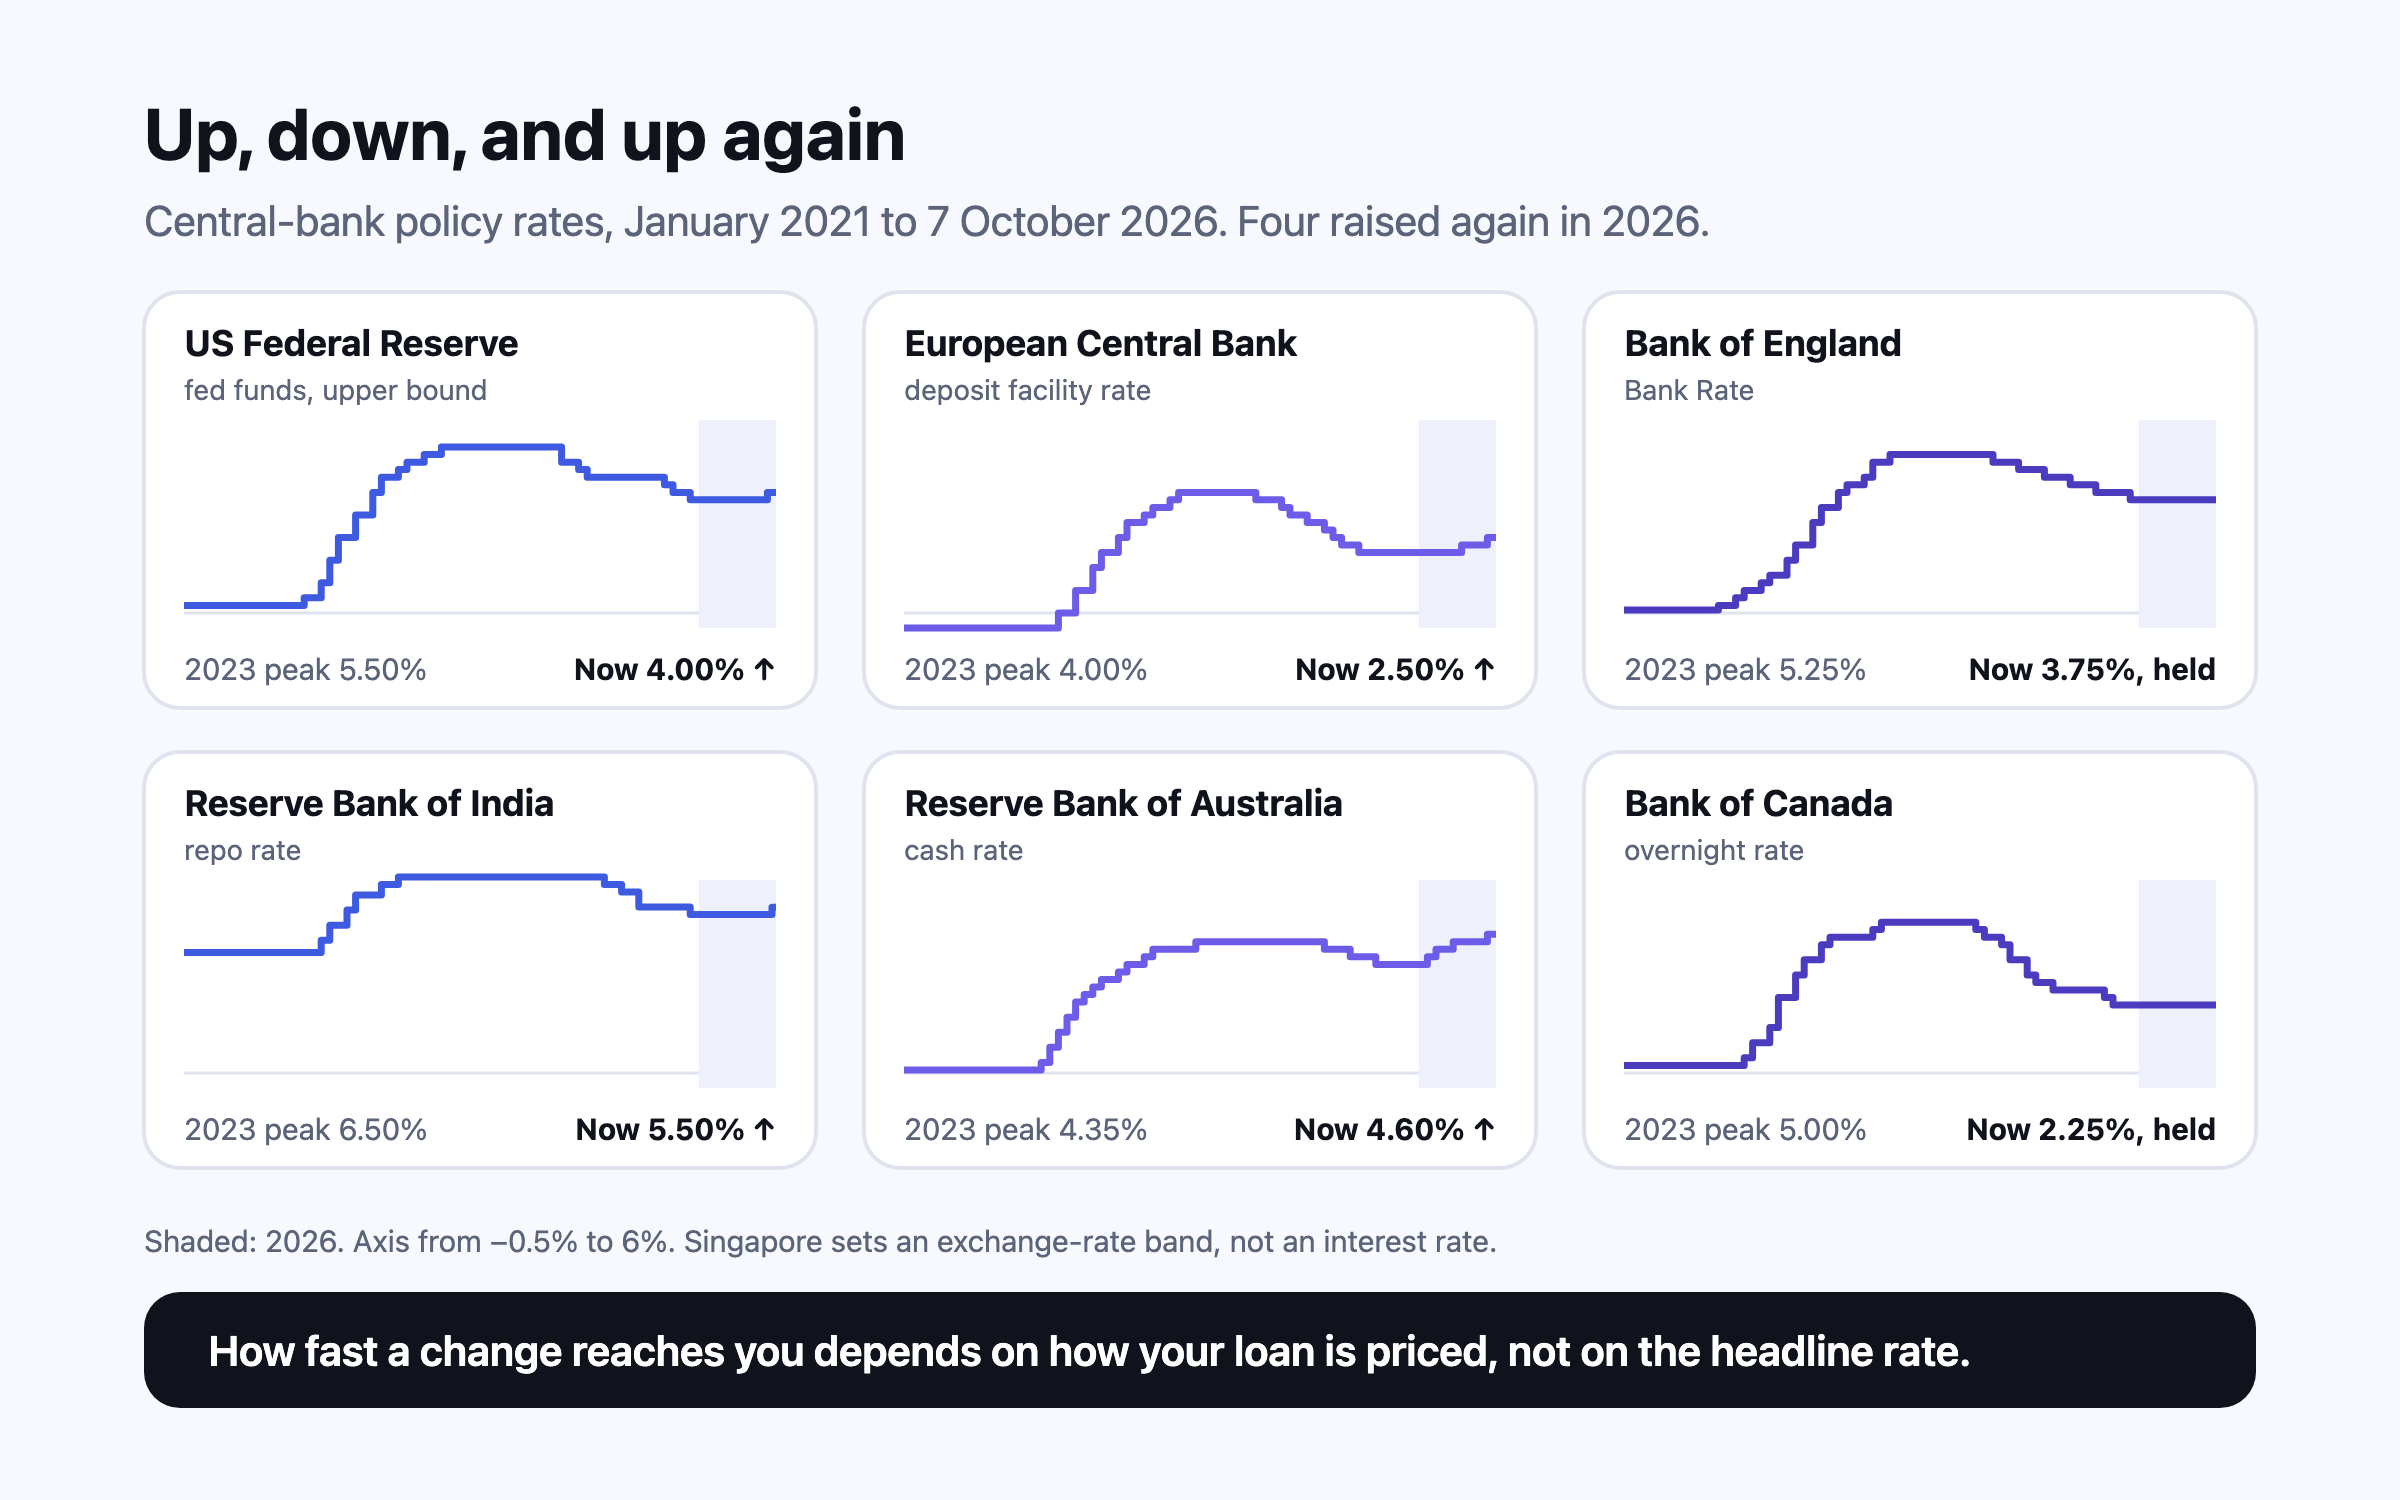
After cutting through 2024 and 2025, several central banks raised rates again in 2026 as energy prices, driven up by the conflict in the Middle East, pushed inflation back above target: the Fed to 3.75–4.00% in September, the RBA to 4.60%, the ECB to 2.50% and, on 7 October, the RBI to 5.50%. A rise reaches a US household with a 30-year fixed mortgage barely at all, an Australian or Indian floating-rate borrower within months, and a British or Canadian one when their fix ends. Savers gain, but more slowly than borrowers pay.
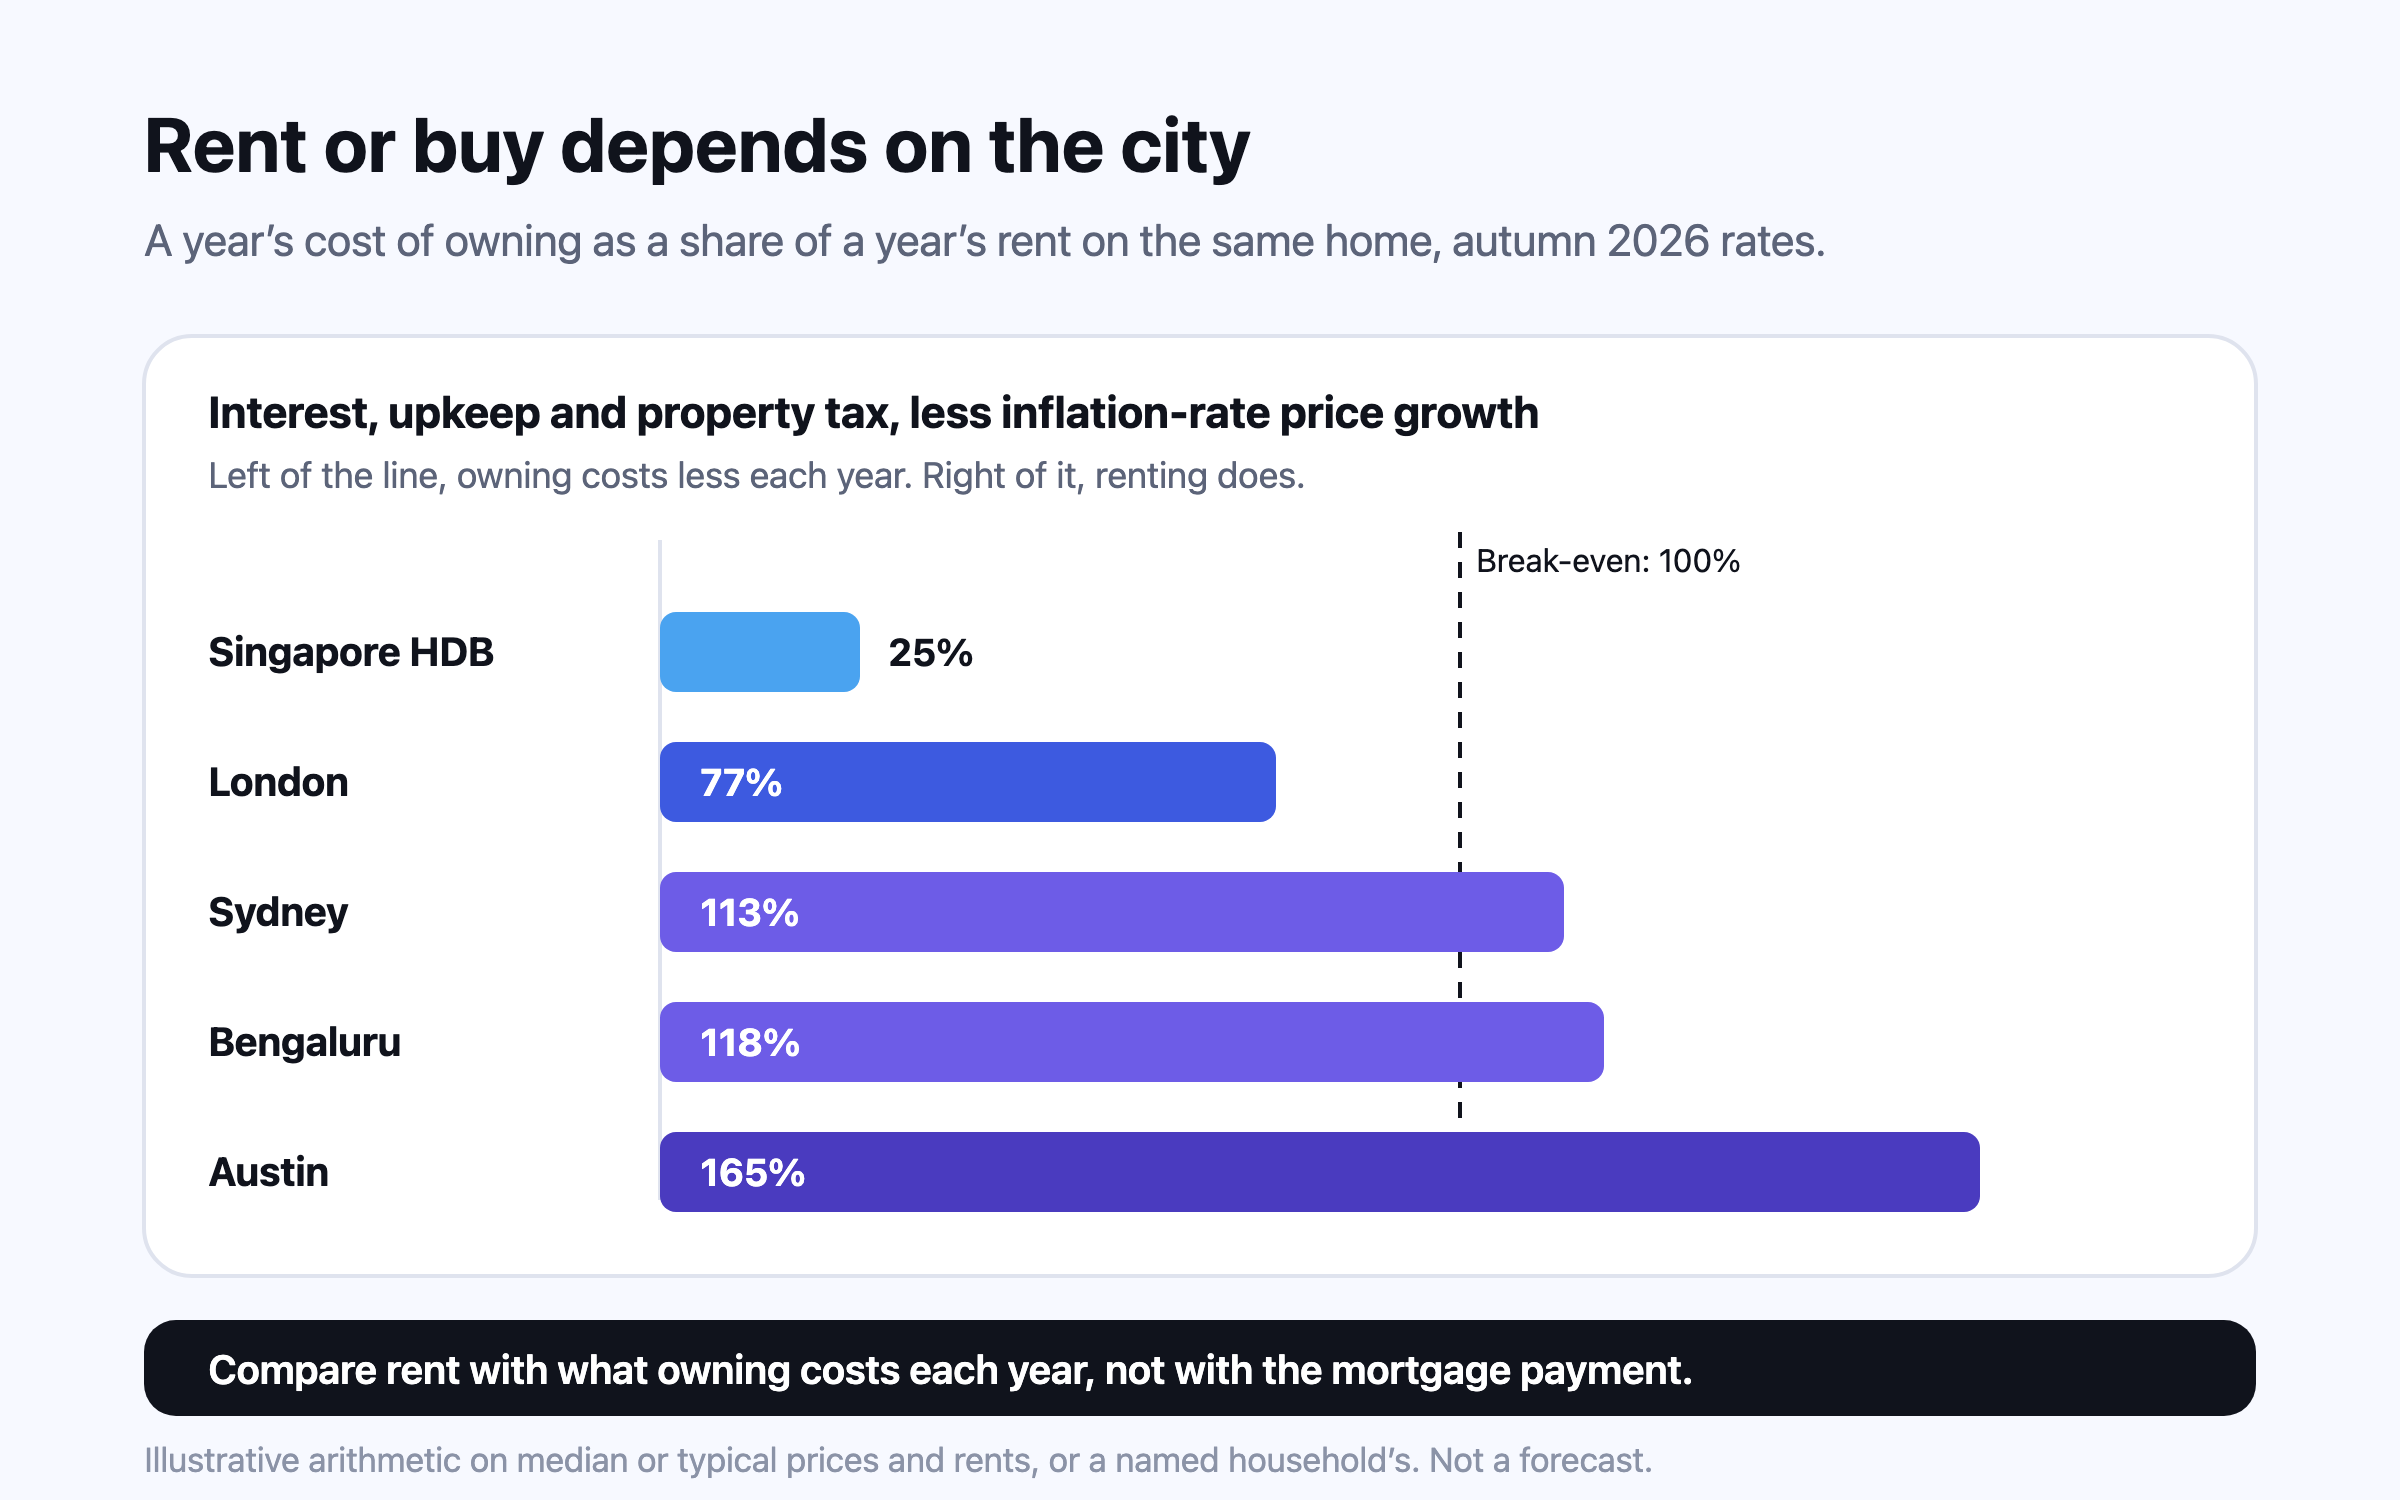
Compare rent with the unrecoverable cost of owning — interest, upkeep, property tax and the return your deposit gives up, less expected price growth — not with the mortgage payment. At autumn 2026 rates, owning the average London home costs somewhat less than renting it, an Austin home costs far more to own than to rent, and an HDB flat in Singapore costs far less. Transfer taxes then decide how long you must stay.
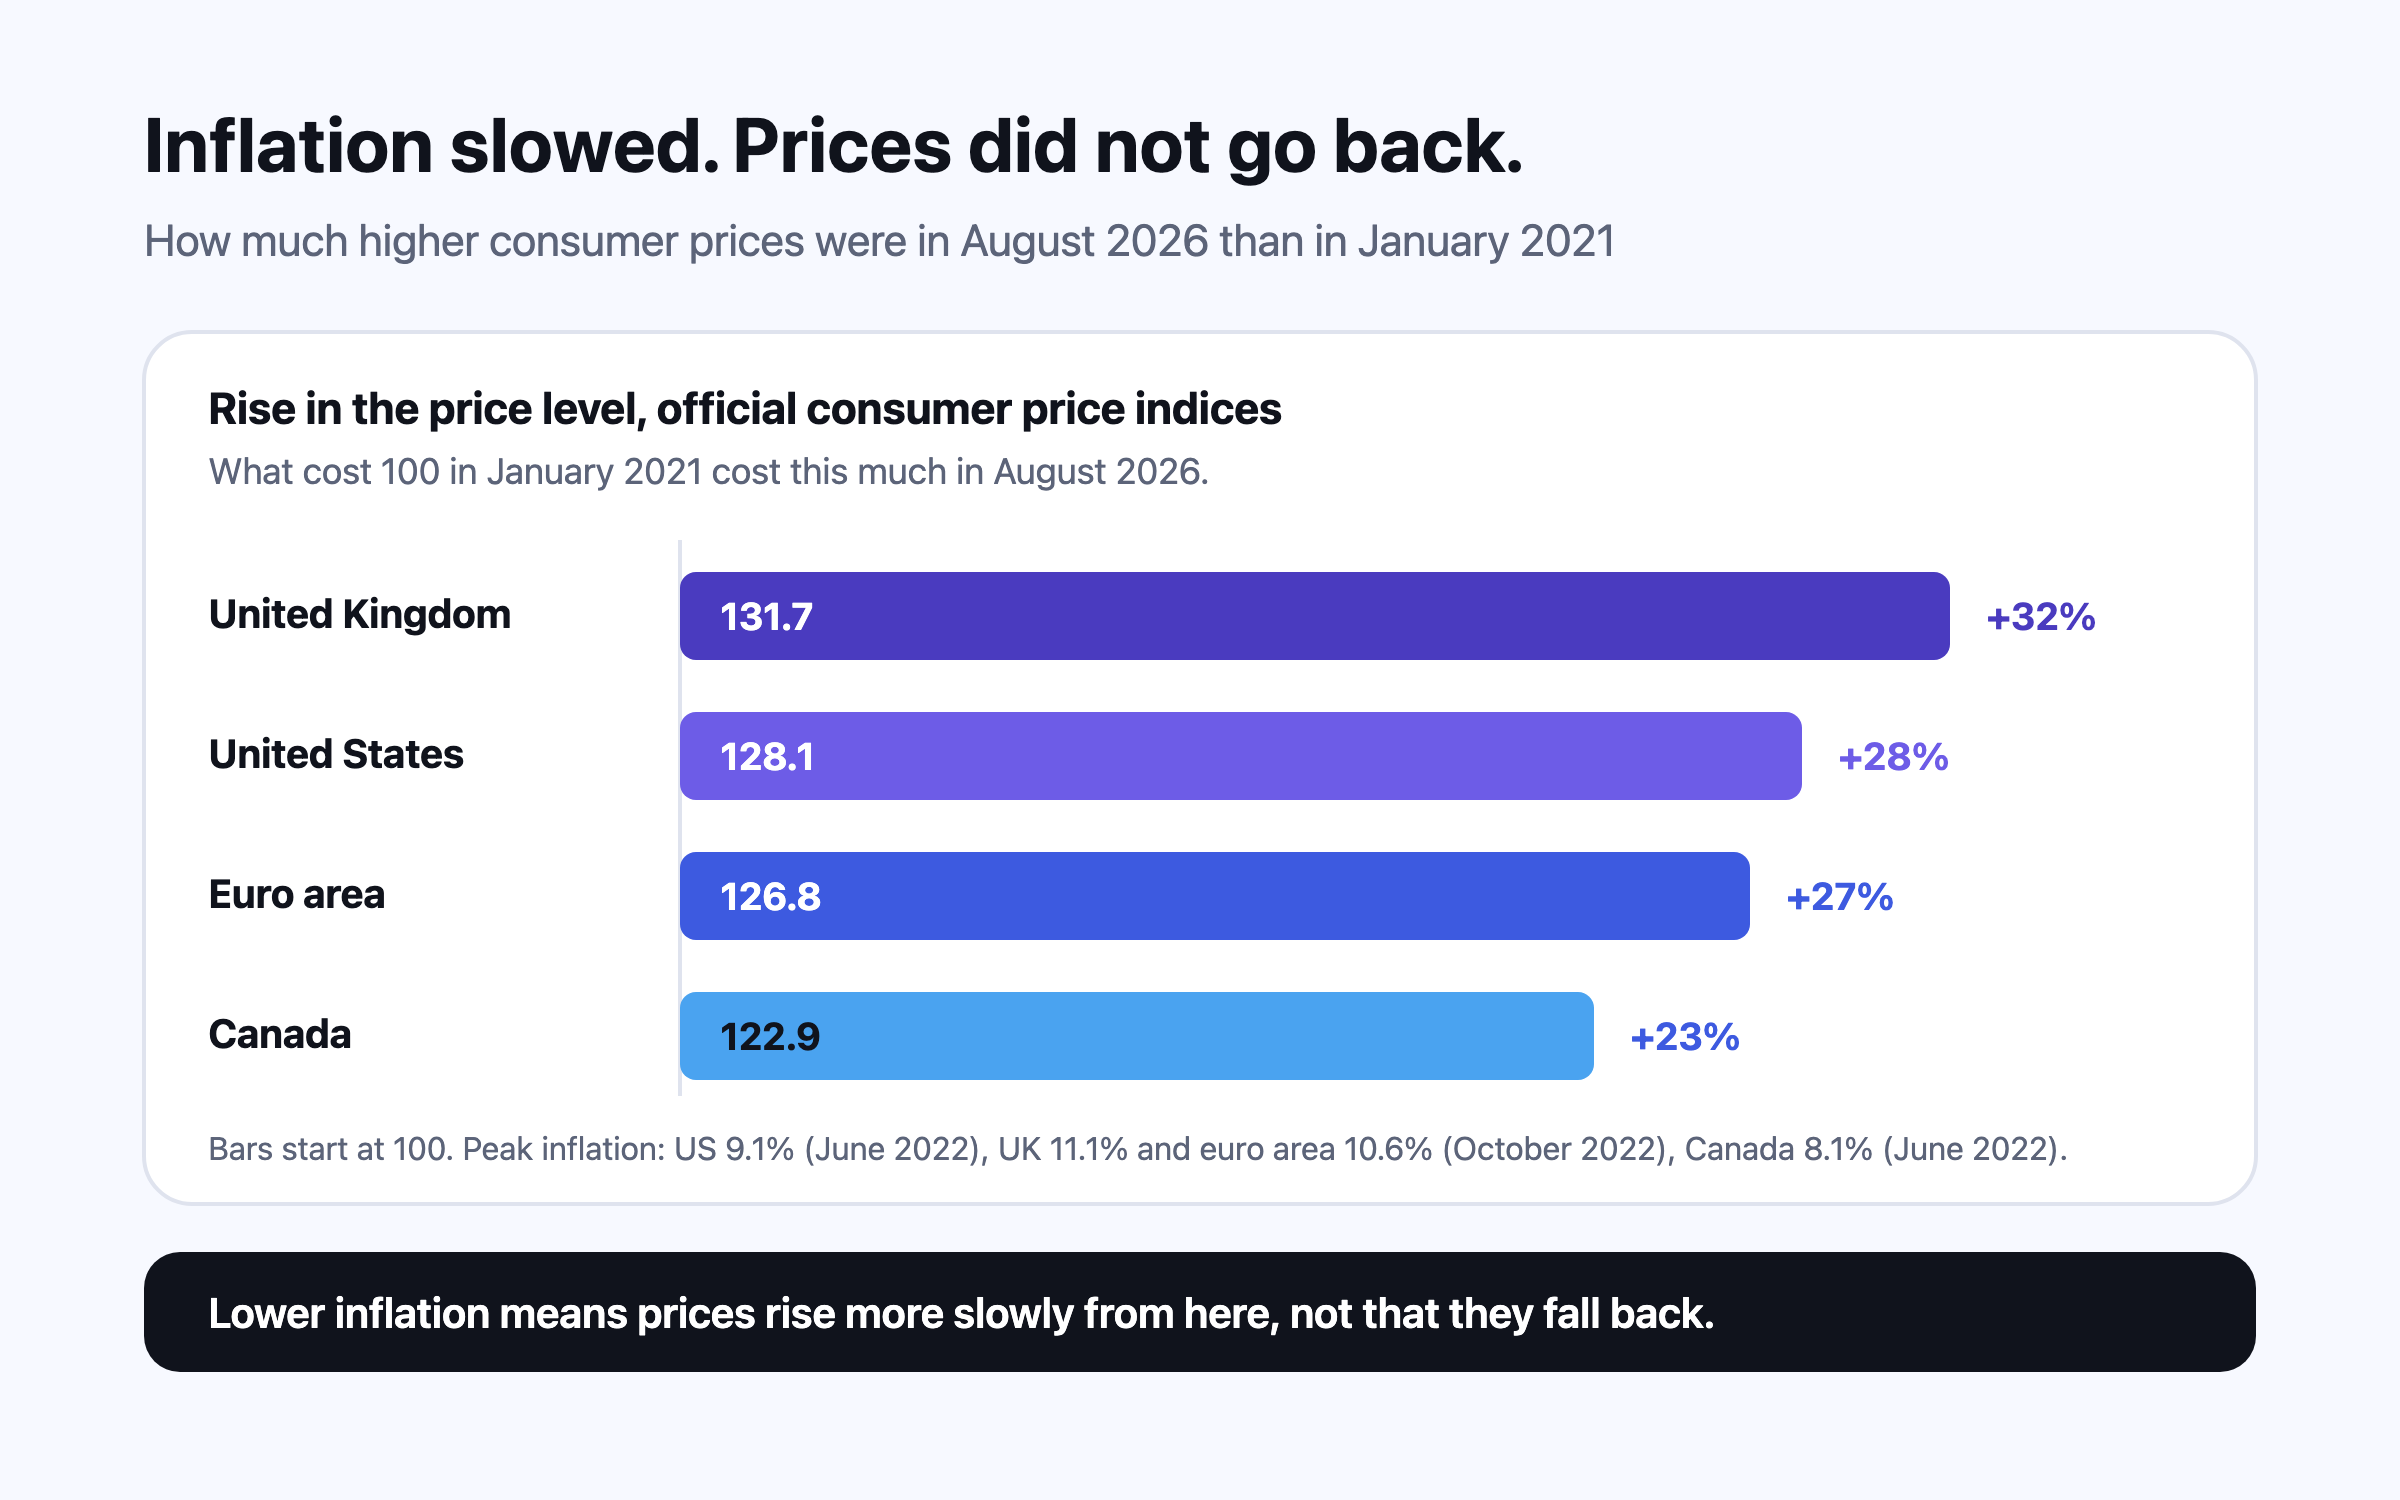
Inflation peaked at 9.1% in the US, 11.1% in the UK and 10.6% in the euro area in 2022, and pay fell behind prices almost everywhere. Inflation then slowed, but the price level never came back down: US consumer prices in August 2026 were about 28% above January 2021, UK prices about 32%. A 2026 energy shock has pushed inflation up again, to 3.8% in the euro area in September. Budgets, pay talks and long-term plans all have to work from the new price level.
This is general information, not financial, tax or legal advice for your circumstances. Rules and figures change; check the official source for your country, and consult a licensed professional before making financial decisions. Projections are estimates, not predictions.