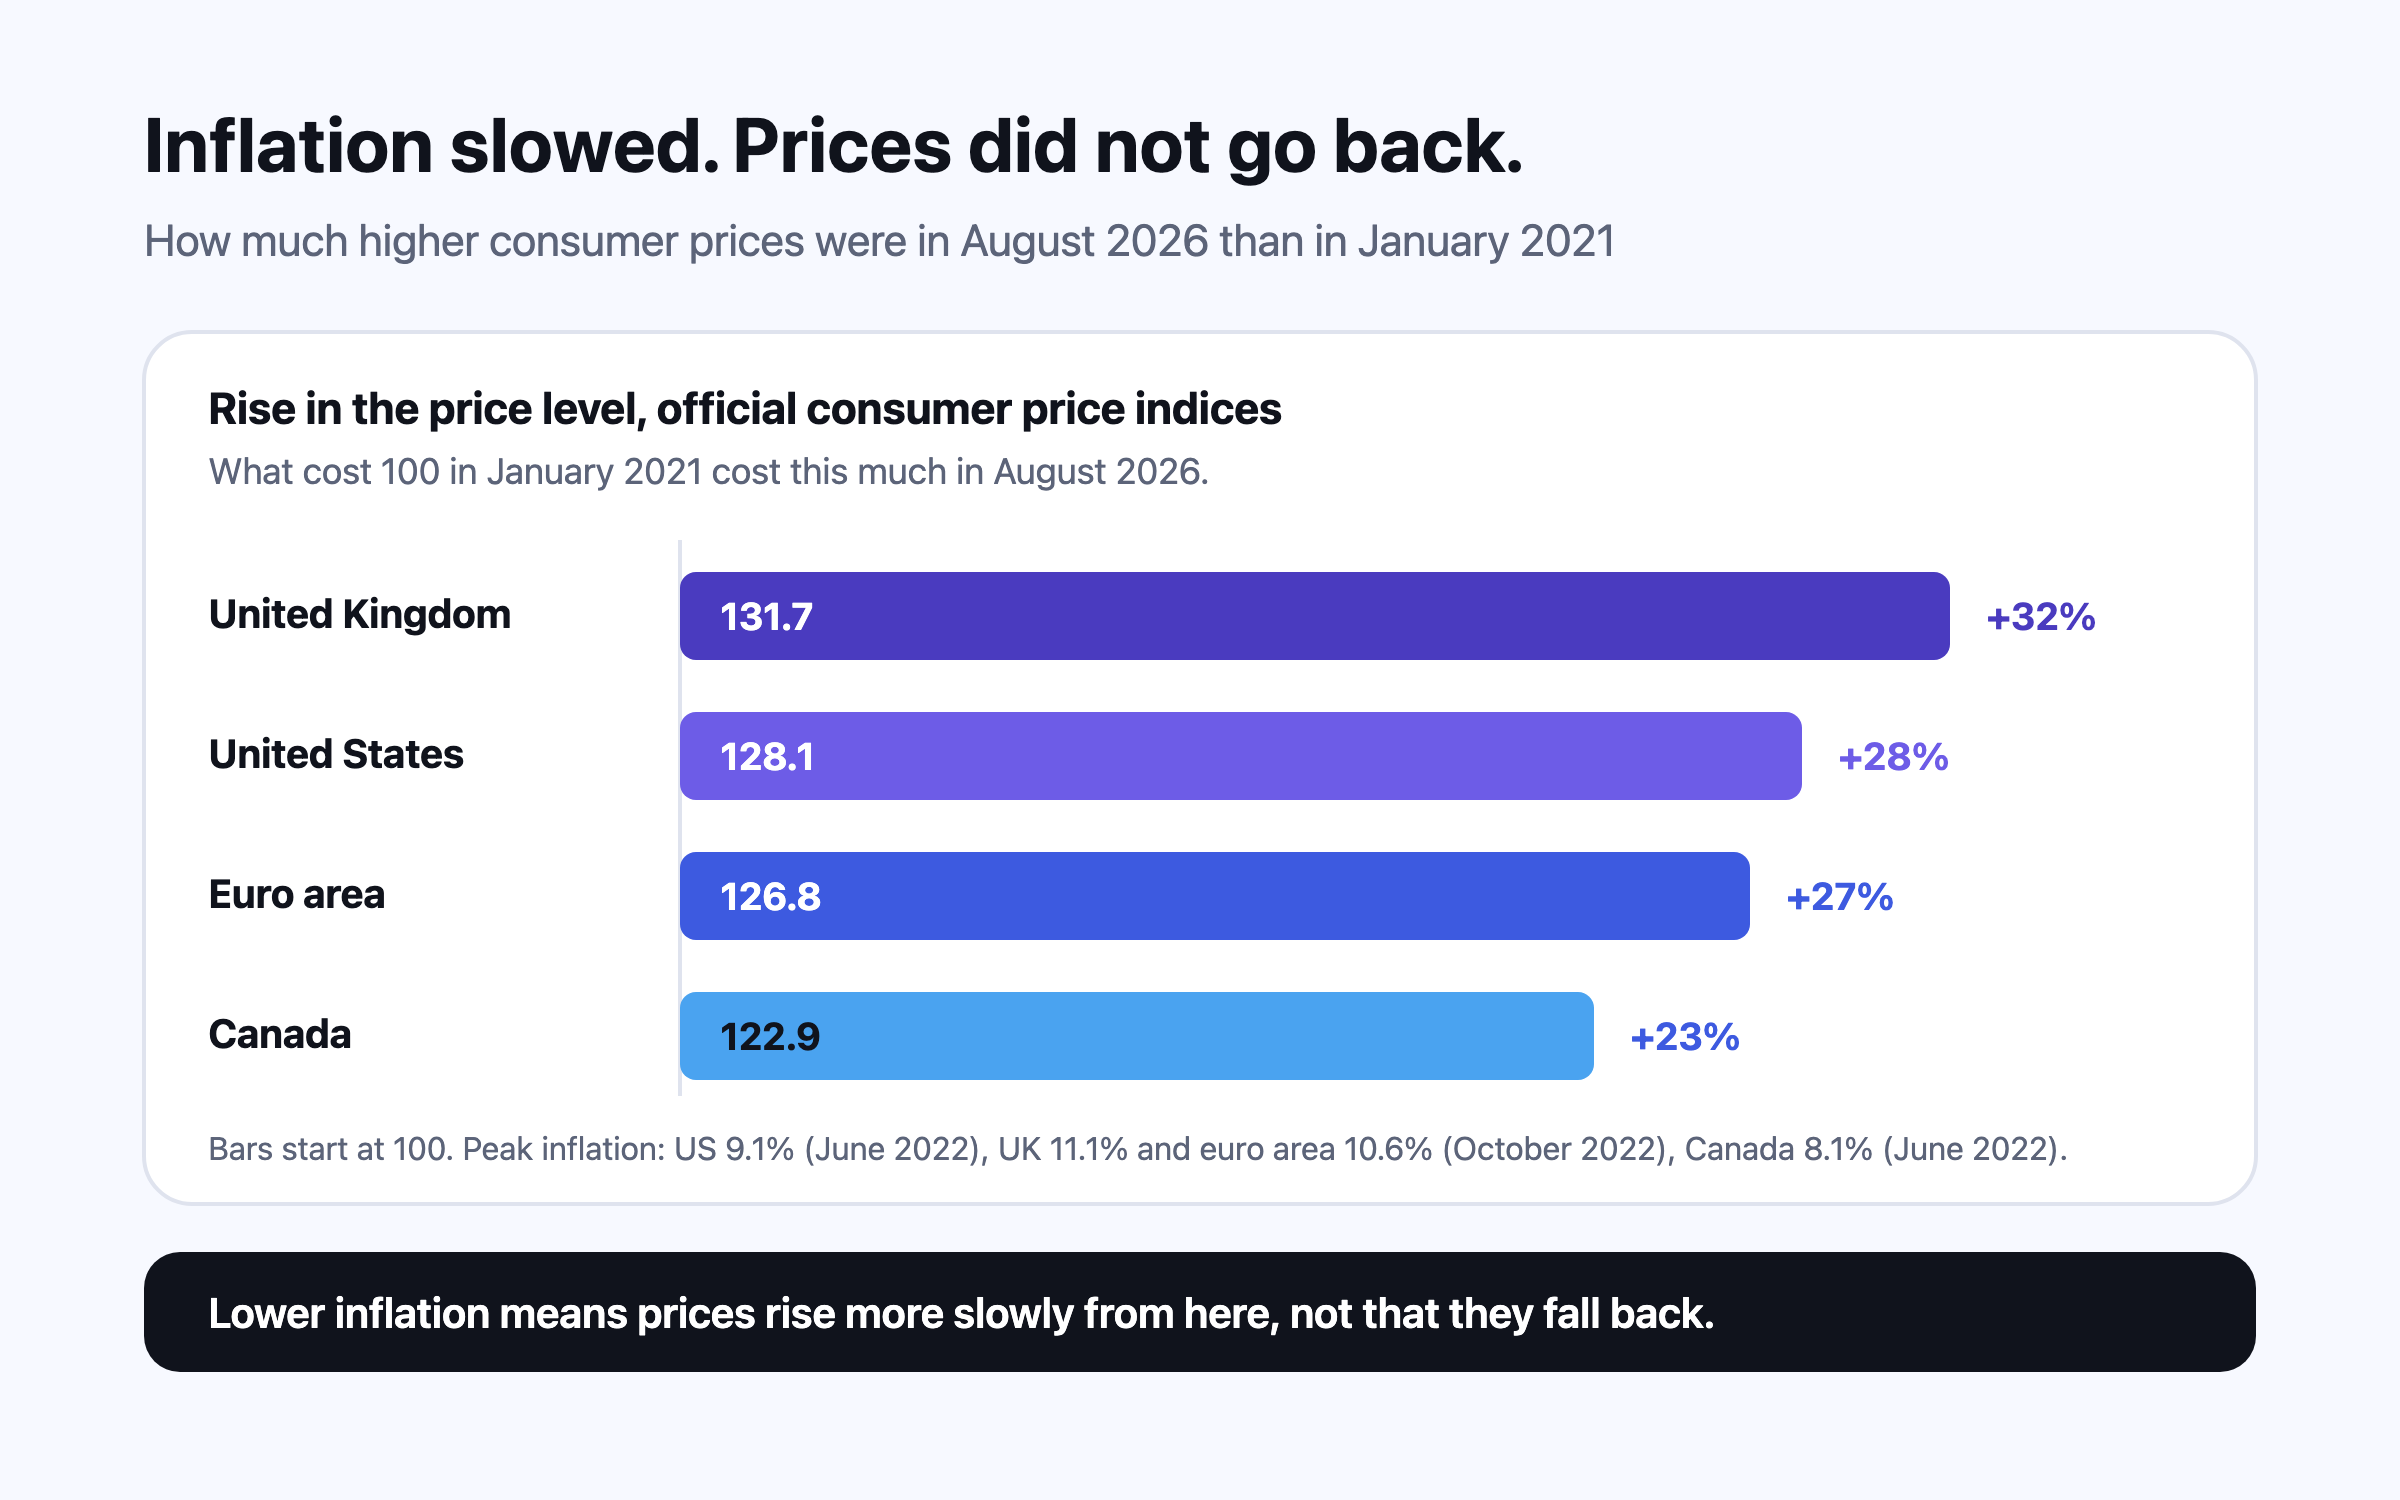
US and UK prices in August 2026 were 28–32% higher than in January 2021. Inflation slowing never meant prices falling, and in 2026 it is rising again.
Inflation peaked at 9.1% in the US, 11.1% in the UK and 10.6% in the euro area in 2022, and pay fell behind prices almost everywhere. Inflation then slowed, but the price level never came back down: US consumer prices in August 2026 were about 28% above January 2021, UK prices about 32%. A 2026 energy shock has pushed inflation up again, to 3.8% in the euro area in September. Budgets, pay talks and long-term plans all have to work from the new price level.
Nivritee Research · 6 October 2026 · 9 min read
The inflation of 2021 to 2024 did not end the way most people hoped. Inflation — the rate at which prices rise — came down from its 2022 peaks. Prices themselves did not. On official figures, US consumer prices in August 2026 were about 28% higher than in January 202112, UK prices about 32% higher3, euro-area prices about 27%4 and Canadian prices about 23%5. A household whose income rose less than that over the same years is poorer in what it can buy, even if its pay slip says otherwise.
And the story is not over. In 2026, the ECB says, conflict in the Middle East and the war in Ukraine pushed energy prices up again6; euro-area inflation rose to 3.8% in September on Eurostat’s flash estimate, with energy prices up 18.8% on the year7. This article sets out how high inflation went and where, what it did to food, energy and wages, the argument over whether company profits made it worse, how households coped, where it stands now, and what it means for a budget, a pay rise and a long-term plan. For the separate question of why medical and education costs rise faster than general prices, see inflation is not one number.
Euro-area inflation, September 2026 flash: rising again
How high it went, and where it is now
The surge started with reopening after the pandemic, as demand returned faster than supply chains could follow, and turned into a cost-of-living crisis when Russia’s invasion of Ukraine in February 2022 sent energy and food prices up. For most rich economies it was the highest inflation in thirty or forty years. The timing differed by months, mostly because energy prices reached households at different speeds: quickly in the US, later in Europe, where regulated tariffs and price caps delayed the rise into the autumn of 2022.
Consumer price inflation over twelve months, from each country’s statistics office or central bank. Australia’s and New Zealand’s peaks are quarterly measures. India and Japan rebased their indices in 2026, so their latest readings are on new baskets. 82911127131415161718192021222324
Economy
Peak headline inflation
When
Latest reading (2026)
United States
9.1%
June 2022
3.4% (August)
United Kingdom
11.1%
October 2022
3.1% (August)
Euro area
10.6%
October 2022
3.8% (September flash)
Canada
8.1%
June 2022
3.0% (August)
Australia
7.8%
Year to December quarter 2022
4.0% (year to August, monthly CPI)
New Zealand
7.3%
Year to June quarter 2022
4.1% (year to June quarter)
India
7.79%
April 2022
4.82% (August, new 2024 base)
Singapore
7.5%
August and September 2022
2.3% (August)
Japan
4.3%
January 2023
1.9% (August, new 2025 base)
Singapore’s own core measure, which leaves out accommodation and private transport, peaked at 5.5% in January 202321 and was 2.2% in August 202622. The 2026 rise is concentrated where energy matters most. Canadian petrol prices were up 22.8% on the year in August14; Australian electricity was up 13.2%, largely because government rebates ended16; US energy prices were up 16.3% while US prices excluding food and energy rose 2.4%2. The ECB’s staff expect euro-area inflation to average 3.0% in 2026 and fall back to 2.1% by 20286 — a projection, not a promise.
Food and energy: where households felt it
Headline inflation understates what many families went through, because the fastest rises were in things nobody can cut back on much. UK food prices rose 19.2% in the year to March 2023, the highest in over 45 years10. US food at home rose 13.5% in the year to August 2022, the most since 197925. Euro-area energy prices rose 41.5% in the year to October 202212. In India, food inflation hit 11.51% in July 2023 and 10.87% in October 2024, well after headline inflation had calmed2627.
Energy shows how much government policy shaped what households paid. Ofgem raised Britain’s price cap for a typical household by 80%, to £3,549 a year, from October 2022, and set it to rise to £4,279 in January 20232829. The government’s Energy Price Guarantee then limited a typical household’s bill to about £2,500 a year30. The ONS estimated that without it, prices for electricity, gas and other fuels would have risen by nearly 75% between September and October 2022, instead of the roughly 25% recorded9. In Singapore, household electricity tariffs were 23.3% higher on the year in the last quarter of 202221.
Real wages: pay fell behind, then partly caught up
For most workers, pay rose — just not as fast as prices. The ONS recorded a fall in real regular pay of 3.0% in the year to April–June 2022, a record31; real pay returned to growth only in mid-202332. In the US, real average hourly earnings fell 3.6% between June 2021 and June 202233. Canadian hourly wages rose 5.2% in the year to June 2022 against prices up 8.1%13; Australia’s wage price index rose 3.3% in the year to December 2022 against prices up 7.8%3415.
Across the rich world the picture was the same. In early 2023, the OECD found nominal wage growth trailing inflation by 3.8 points on average across 34 member countries, with real wages falling in 30 of them35. By early 2025 real wages were growing again in 33 of 37 countries, by 2.5% on average, but were still below their early-2021 level in 18 of them36; in the US, real wages remained 2% below37. Wages rising faster than prices for a while is not the same as winning back what was lost.
Did profits make it worse? The greedflation debate
Whether companies used the crisis to raise prices beyond their costs is one of the most argued questions of the episode, and the honest answer is that it depends on where and when you look. The case for a profit role is strongest in Europe. ECB President Christine Lagarde said in June 2023 that unit profits contributed around two-thirds of euro-area domestic inflation in 2022, against an average of about one-third over the previous two decades38. An IMF working paper estimated that rising profits accounted for 45% of the increase in euro-area consumer prices between early 2022 and early 202339. In the US, Kansas City Fed economists found markups rose 3.4% in 2021 while inflation was 5.8%, suggesting they could explain more than half of that year’s inflation — though they argued firms were pricing in expected future costs rather than exploiting market power40.
The case against is just as well documented. San Francisco Fed economists found that aggregate US markups stayed essentially flat while core prices rose more than 10%, concluding that rising markups were not a main driver of inflation41. In Britain, the Competition and Markets Authority found that competition problems were not driving food inflation, and that operating profits in grocery retailing fell 41.5% in 2022/2342; it did find that about three-quarters of branded suppliers of products such as infant formula, baked beans and pet food had raised their unit profits43. The fair summary: energy and supply shocks started it; in some sectors and some economies, firms then widened margins; how much that added is still disputed.
How households coped
Surveys show the same three responses everywhere: buy less, buy cheaper, and draw down savings. In mid-2022, 91% of British adults told the ONS their cost of living had risen over the past month; of those, 62% were spending less on non-essentials and 53% using less fuel at home44. In the Federal Reserve’s survey of 2022, 35% of US adults said they were worse off than a year earlier, the highest since the question was first asked; 64% had switched to cheaper products and 51% had reduced their savings because of higher prices45.
The cushion ran out. San Francisco Fed researchers estimated that US households’ excess savings from the pandemic peaked at about $2.1 trillion in August 2021 and had been fully used up by March 20244647. The share of US adults who would cover a $400 emergency with cash was 63% in 2022, down from 68% in 2021, and still 63% in 2025, when just over nine in ten called price increases a minor or major concern4548. In Britain in July 2026, 56% of adults said their cost of living had risen in the past month, down from 79% in April, and spending less on non-essentials (59%) was still the most common response49.
Why prices do not come back down
The question people ask most is when prices will go back to normal. They almost certainly will not, and central banks do not want them to: every major central bank targets inflation of about 2% a year, so success means prices rising slowly from today’s level, not falling back to 2021’s. The Bank of England’s explainer notes that UK inflation averaged 2% from 1997 to 2021 before peaking at about 11% in 202250. Falling prices across the board — deflation — usually come with recessions and job losses, which is why policy is set to avoid them. Individual prices do fall: Indian tomato prices were 31.09% lower in August 2026 than a year earlier, even as onion prices rose 48.27%20.
Consumer price indices from each statistics office; the rise is computed from the two values shown. India, Japan, Australia, Singapore and New Zealand are left out because their indices were rebased or not gathered on a comparable monthly basis. 31245
Economy
Price index, January 2021
Price index, August 2026
Prices higher by
United Kingdom (CPI, 2015 = 100)
109.0
143.6
31.7%
United States (CPI-U)
261.582
334.980
28.1%
Euro area (HICP, 2025 = 100)
81.8
103.69
26.8%
Canada (CPI, 2002 = 100)
138.2
169.8
22.9%
Why it feels higher than the official figure
Many people are sure inflation is higher than the official number, and there is research on why. Francesco D’Acunto and colleagues found that people form their sense of inflation from the prices they see most often, such as groceries and fuel, weighting them by how often they buy them rather than by how much of their budget they take51. Food and fuel rose fastest and are bought weekly. Stefanie Stantcheva’s surveys found people dislike inflation mainly because they believe their own pay does not keep up52 — which, for 2022 and much of 2023, the real-wage data above says was true. The official figure is an average across all households; a household that spends more of its money on food, energy or rent can face a higher rate than the average.
What it means for your budget and your pay
The first adjustment is to re-base. Kate, 39, an office manager in Leicester, earned £45,000 in January 2021. To buy what that bought then, she needed about £59,300 in August 2026, on the UK consumer price index3. Jordan and Mia in Columbus, Ohio, with $85,000 of household income in January 2021, needed about $108,900 to stand still12. Aisha, an engineer in Calgary, needed about C$110,600 to match a C$90,000 salary5. Anything less than that is a pay cut in what the money buys, whatever the headline raise was.
The second is to judge every pay rise against inflation, not against zero. A 4% rise in Britain with prices up 3.1% in the year to August 2026 is a real rise of about 0.9%11. Ramesh and Kavita in Chennai, offered 6% when Indian inflation was 4.82%, would gain about 1.1% in real terms20. When negotiating, the inflation figure for the year just gone is the floor, not the ask; the real-wage data shows how long it can take to recover ground once it is lost36.
The third is to find where the rise is concentrated in your own spending. Nathan and Divya in Perth, paying A$2,000 a year for electricity, face about A$2,264 if their bill tracks the 13.2% national rise in the year to August 202616. That is a line they can shop around for or reduce; general inflation is not. A household that knows which of its costs are rising fastest can act on those rather than cutting everything a little. The working method is in budgeting methods compared and how to save more.
The national figure hides wide differences. In India in August 2026, food inflation on the new series was 5.95%, above the 4.82% headline, and prices in villages rose 5.23% against 4.31% in towns and cities20. In Singapore, where headline inflation was a modest 2.3%, MAS noted that elevated global energy prices had already pushed up household electricity and gas tariffs22. A family in Coimbatore that spends half its budget on food, or a Tampines household with a large air-conditioning bill, faces a higher rate of its own than the average suggests.
What it means for long-term plans
An inflation shock does its lasting damage through the price level. A plan made in 2021 that assumed 2% a year is now priced in money that buys roughly a fifth to a quarter less, so the target needs re-basing to today’s prices before anything else. Cash and fixed deposits lose most in a surge, because their rates lag prices, and a surge drains them from the other side too: the Fed’s 2022 survey found half of US adults had cut their saving to meet higher prices45. Shares and property have historically kept up with inflation over long periods, but not reliably over one or two years; bonds fell badly in 2022 as rates rose (interest rates and your money). Edward Chancellor’s *The Price of Time* argues that the long period of very low rates before 2022 set up some of what followed53.
Re-base your spending: write down what you spend now, not what you spent before 2022, and use that in any plan.
Find your own inflation rate: which of your costs rose most, and which you can change.
Check every income line against inflation: pay, pensions, rent received. Note which are index-linked and which are not.
Keep an emergency fund in cash, but do not hold long-term money there; a few years of inflation can take a large part of its value.
Test your long-term plan against a few years of higher inflation, not only the central bank’s target.
Revisit your plan once a year with the latest inflation figures, rather than reacting to every monthly release.
How Nivritee helps
Questions people ask
Will prices ever come back down?
Not in general. Central banks aim for about 2% inflation, so prices keep rising slowly from today’s level; US prices were about 28% above January 2021 in August 202612. Some individual prices fall, such as Indian tomatoes in 202620.
What is inflation now?
In the latest releases: 3.4% in the US and 3.1% in the UK in August 2026211, 3.8% in the euro area in September7, 3.0% in Canada, 4.0% in Australia and 4.82% in India in August141620.
How much of a pay rise do I need to keep up with inflation?
At least the inflation rate for the past year. A 4% rise against 3.1% UK inflation is a real gain of about 0.9%11. To make up for 2021–2026 in Britain, pay needed to rise about 32% from January 20213.
Is greedflation real?
It is disputed. The ECB found profits contributed around two-thirds of euro-area domestic inflation in 202238; the San Francisco Fed found US markups essentially flat41; the UK’s CMA found grocery retailers’ profits fell while some branded suppliers’ margins rose4243.
Why does inflation feel higher than the official figure?
Because people judge it by prices they see often, such as food and fuel, which rose fastest51. UK food prices rose 19.2% in the year to March 2023, against 10.1% for prices overall10.
Did wages keep up with inflation?
Not at first. UK real regular pay fell a record 3.0% in 202231, and in early 2025 real wages were still below their early-2021 level in 18 of 37 OECD countries36.
Should I keep cash during high inflation?
Keep an emergency fund, but long-term money in cash loses value when rates lag inflation. In 2022, 51% of US adults reduced their savings to cope with higher prices45.
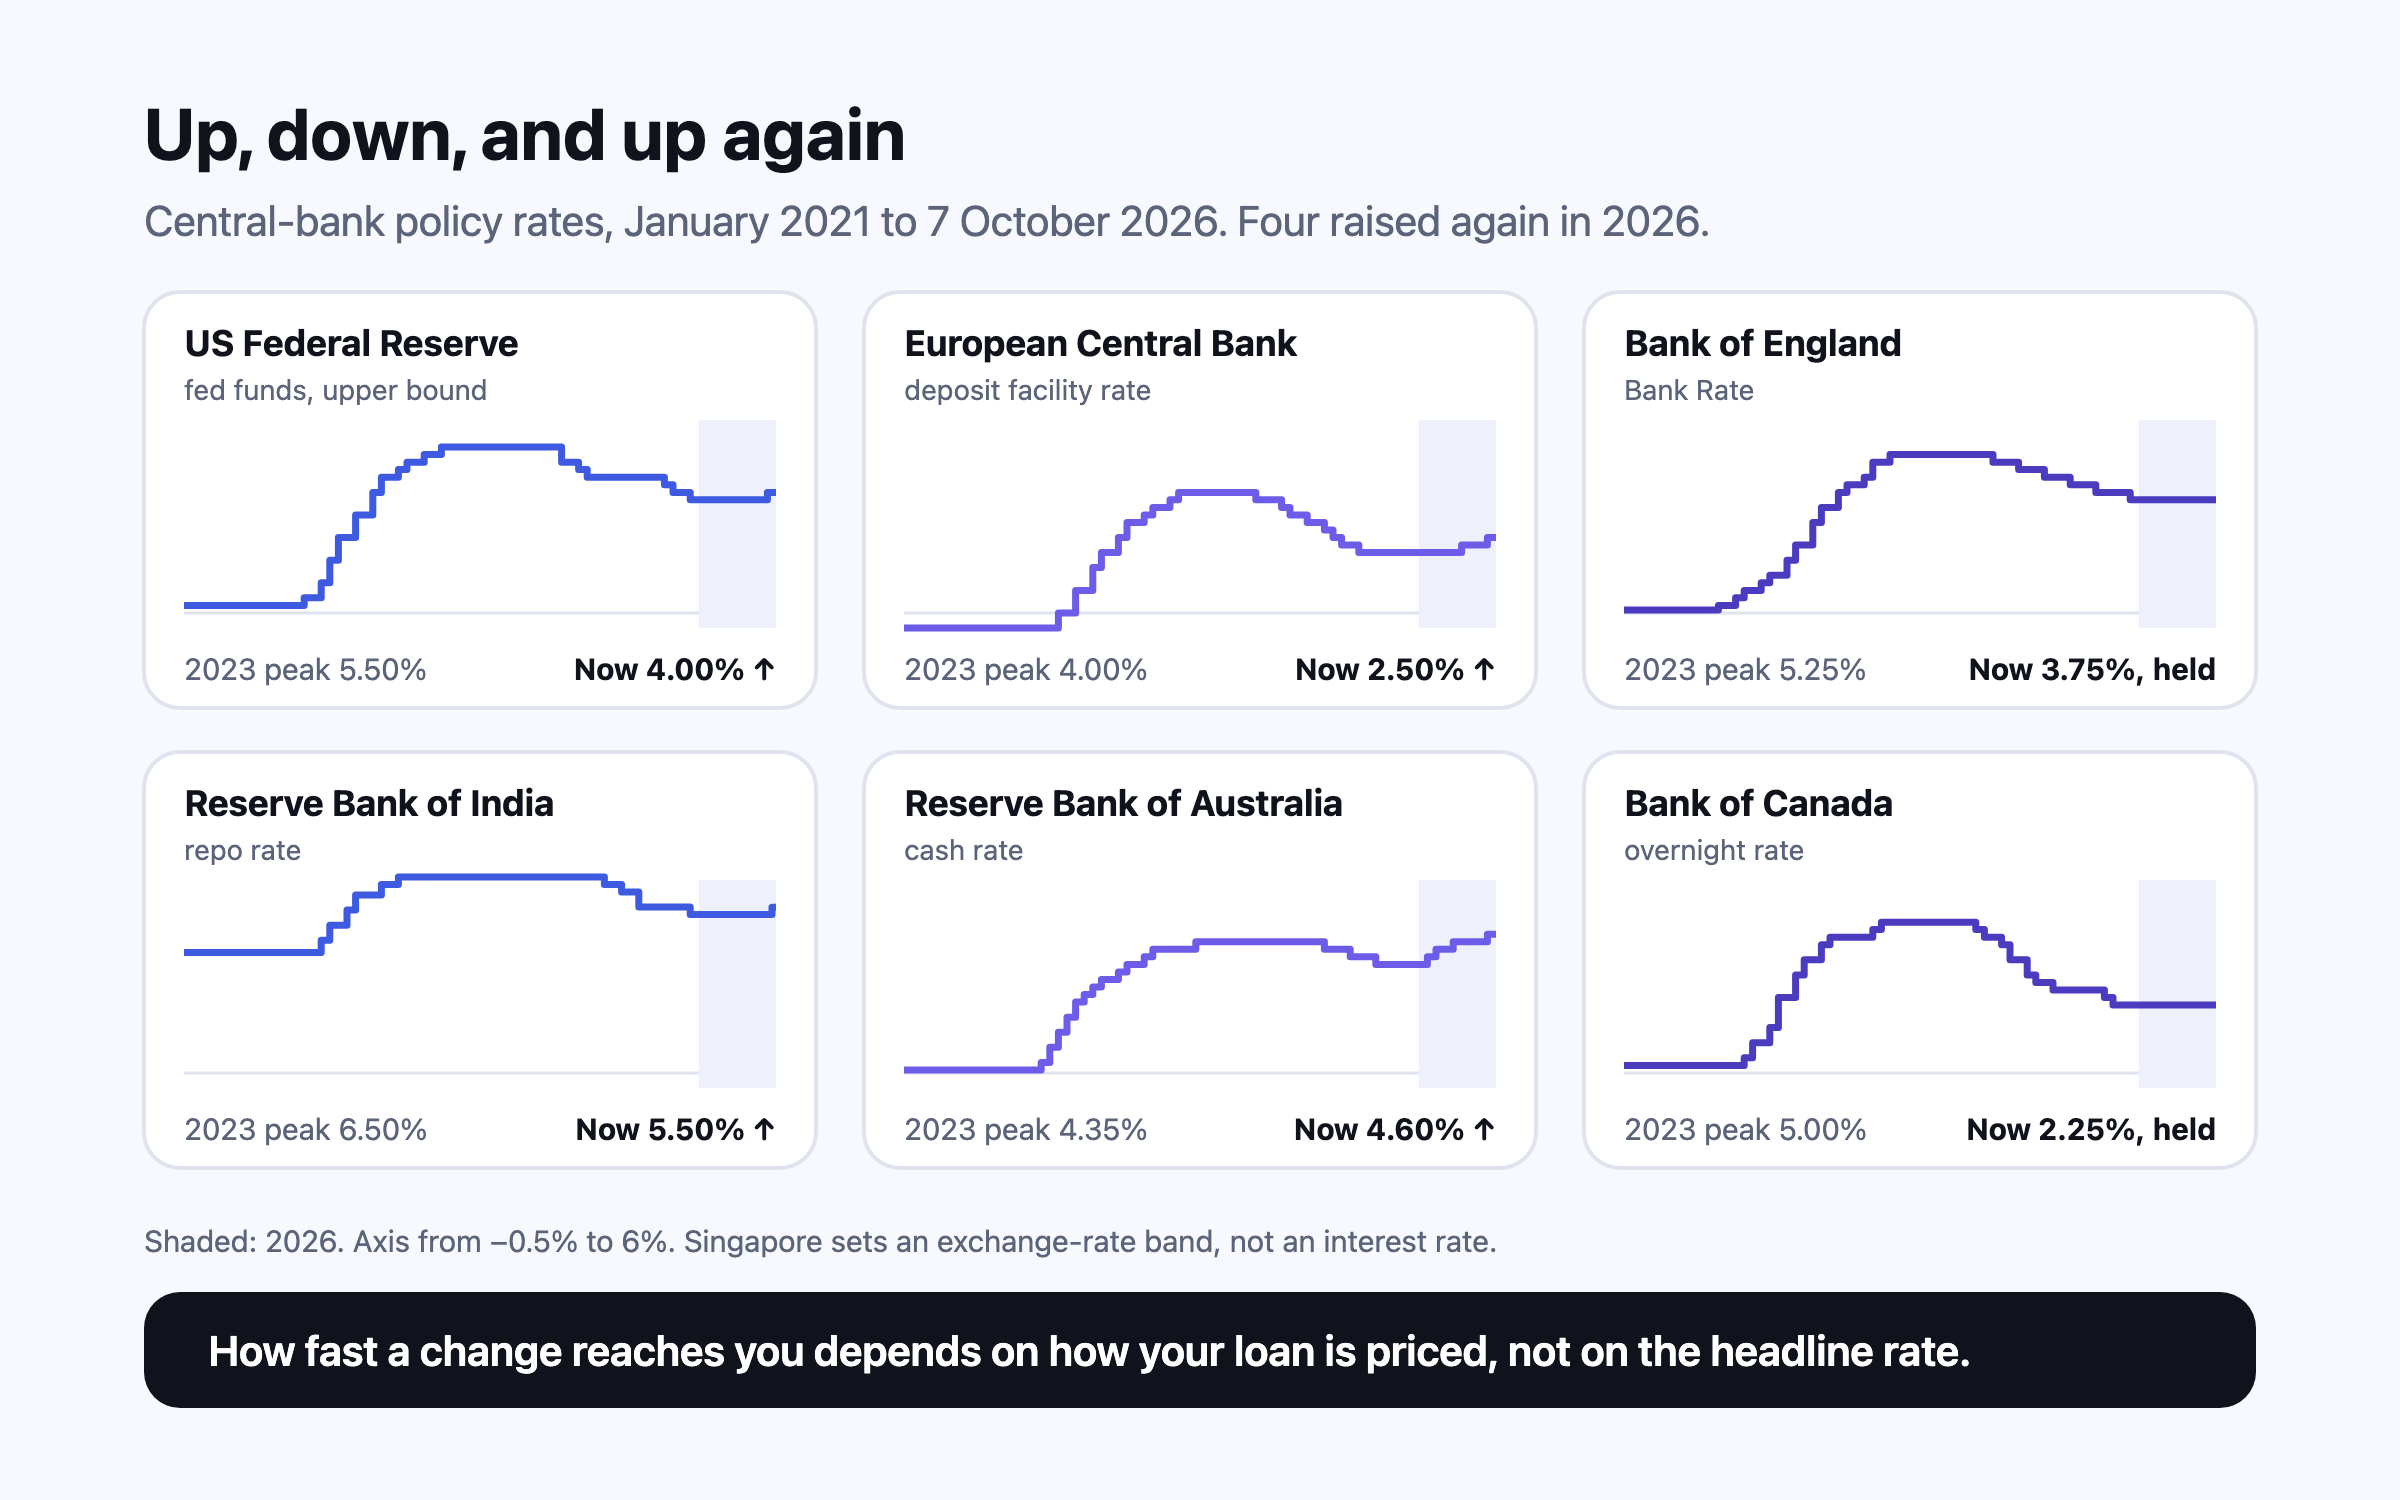
After cutting through 2024 and 2025, several central banks raised rates again in 2026 as energy prices, driven up by the conflict in the Middle East, pushed inflation back above target: the Fed to 3.75–4.00% in September, the RBA to 4.60%, the ECB to 2.50% and, on 7 October, the RBI to 5.50%. A rise reaches a US household with a 30-year fixed mortgage barely at all, an Australian or Indian floating-rate borrower within months, and a British or Canadian one when their fix ends. Savers gain, but more slowly than borrowers pay.
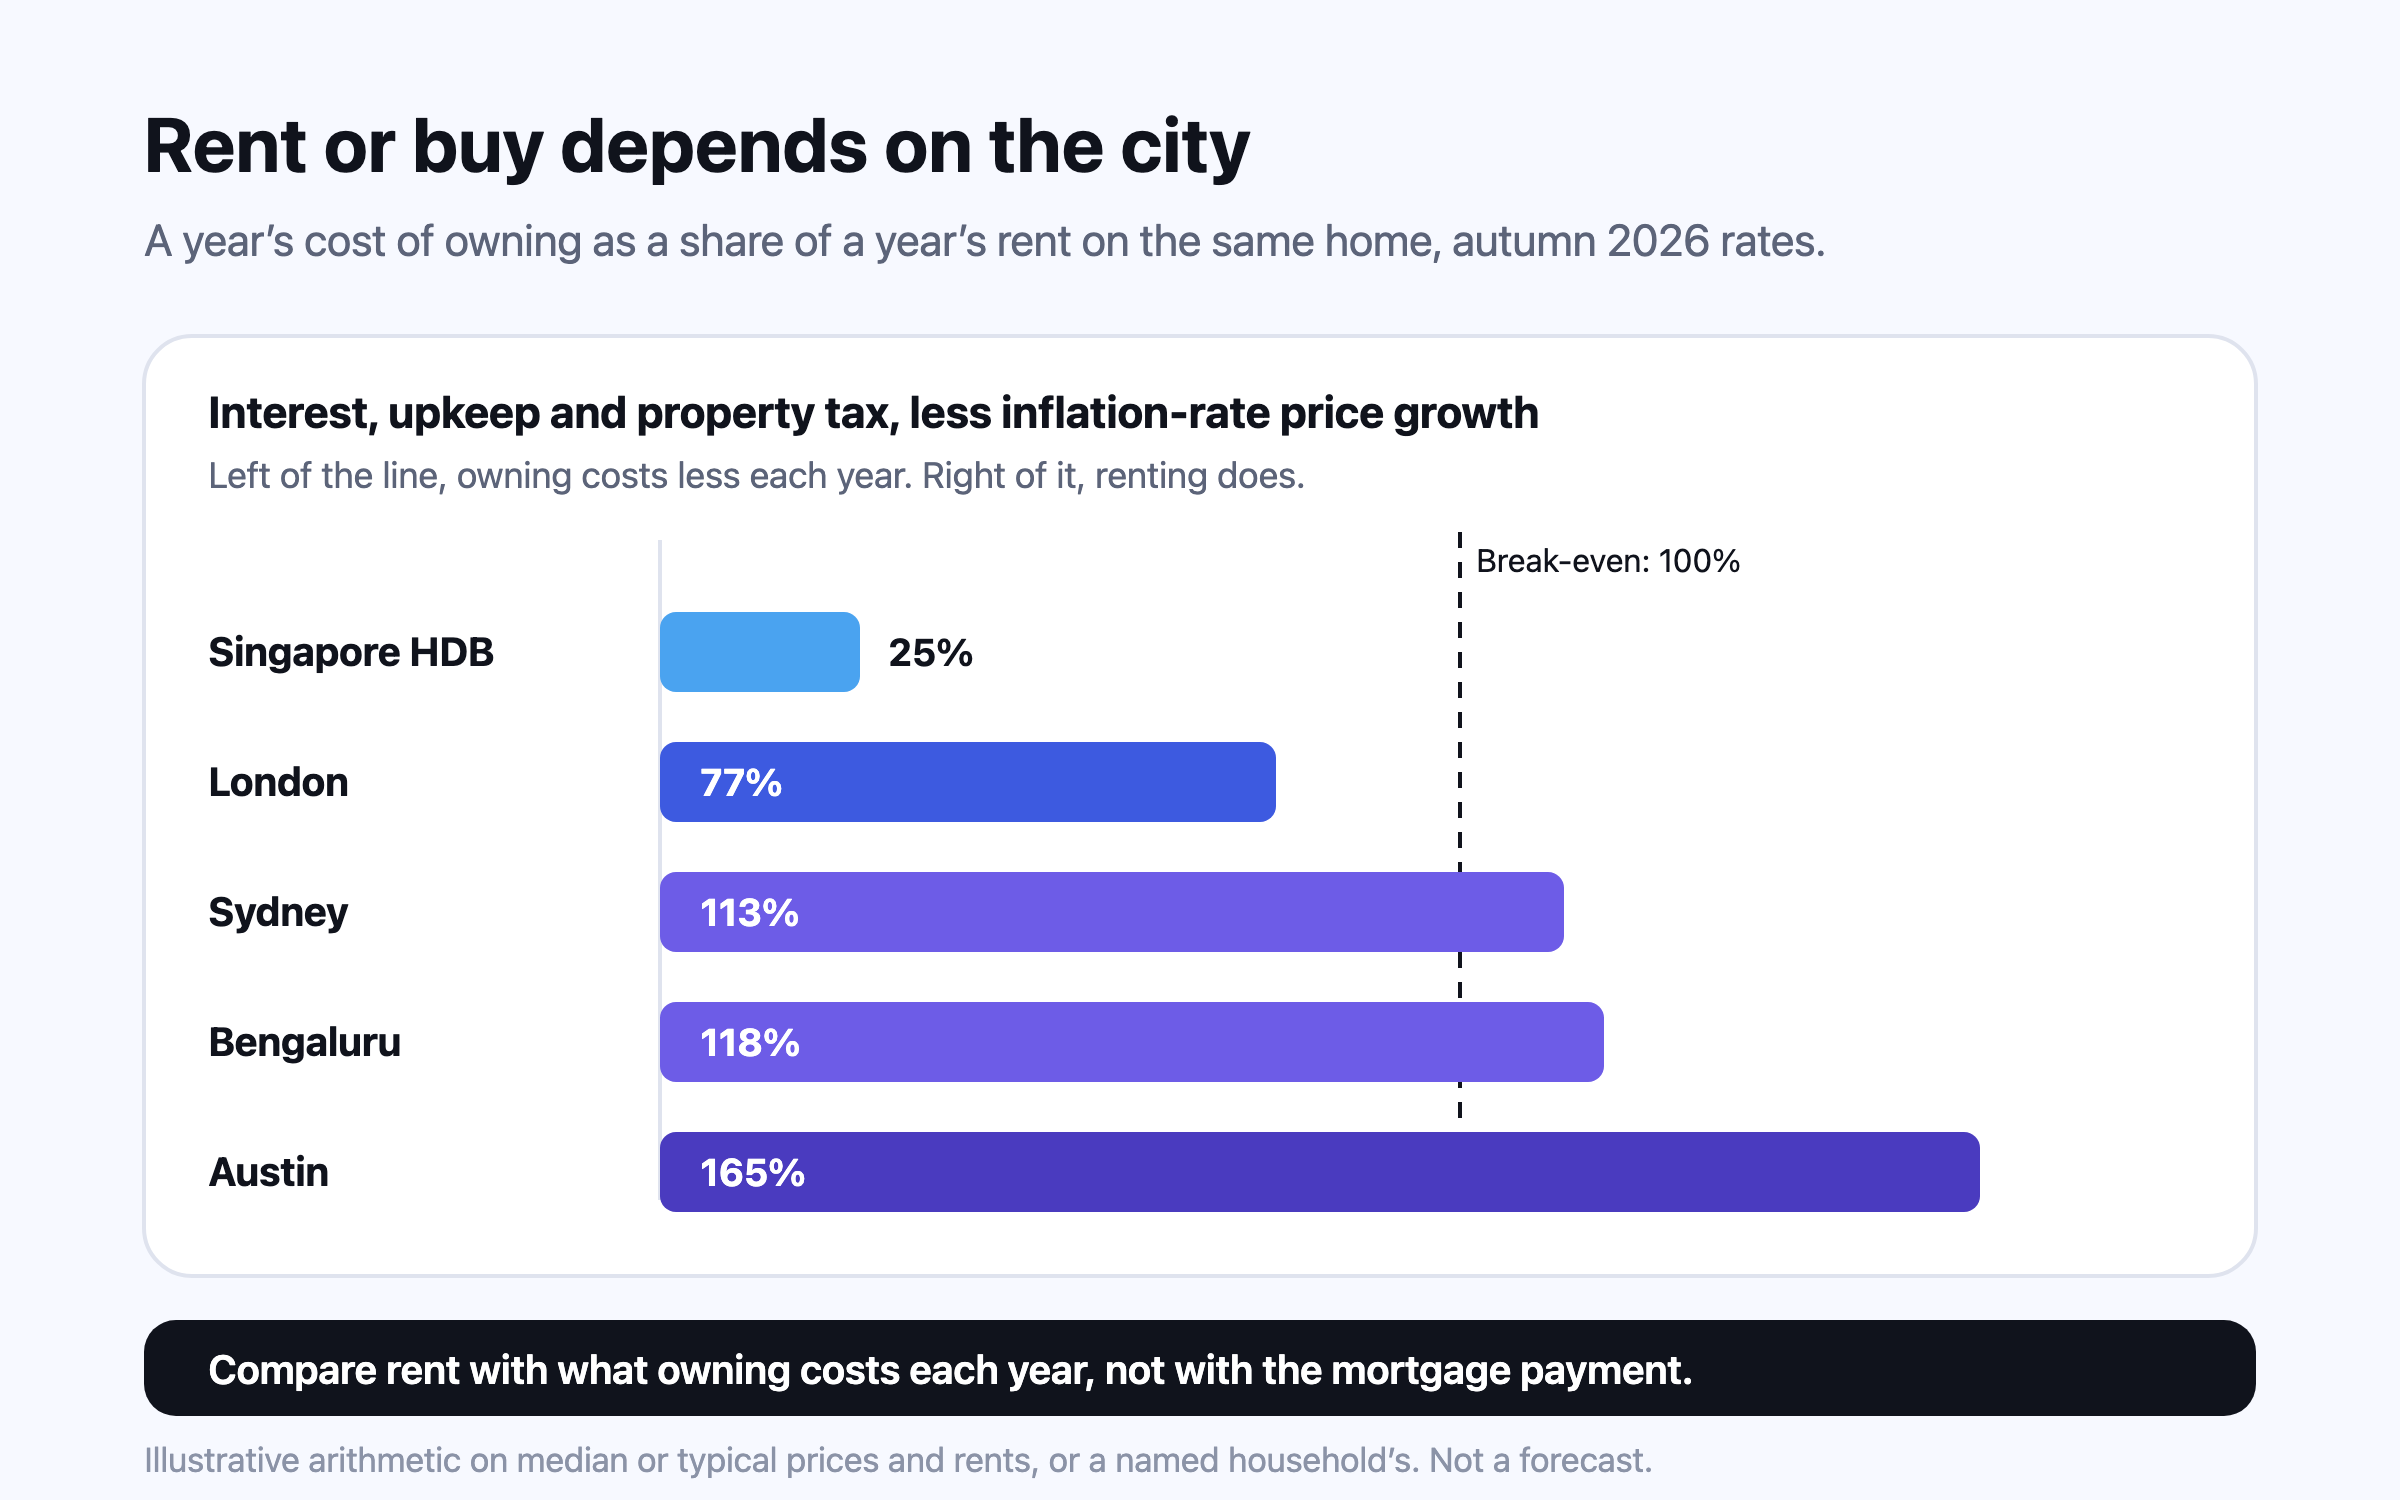
Compare rent with the unrecoverable cost of owning — interest, upkeep, property tax and the return your deposit gives up, less expected price growth — not with the mortgage payment. At autumn 2026 rates, owning the average London home costs somewhat less than renting it, an Austin home costs far more to own than to rent, and an HDB flat in Singapore costs far less. Transfer taxes then decide how long you must stay.
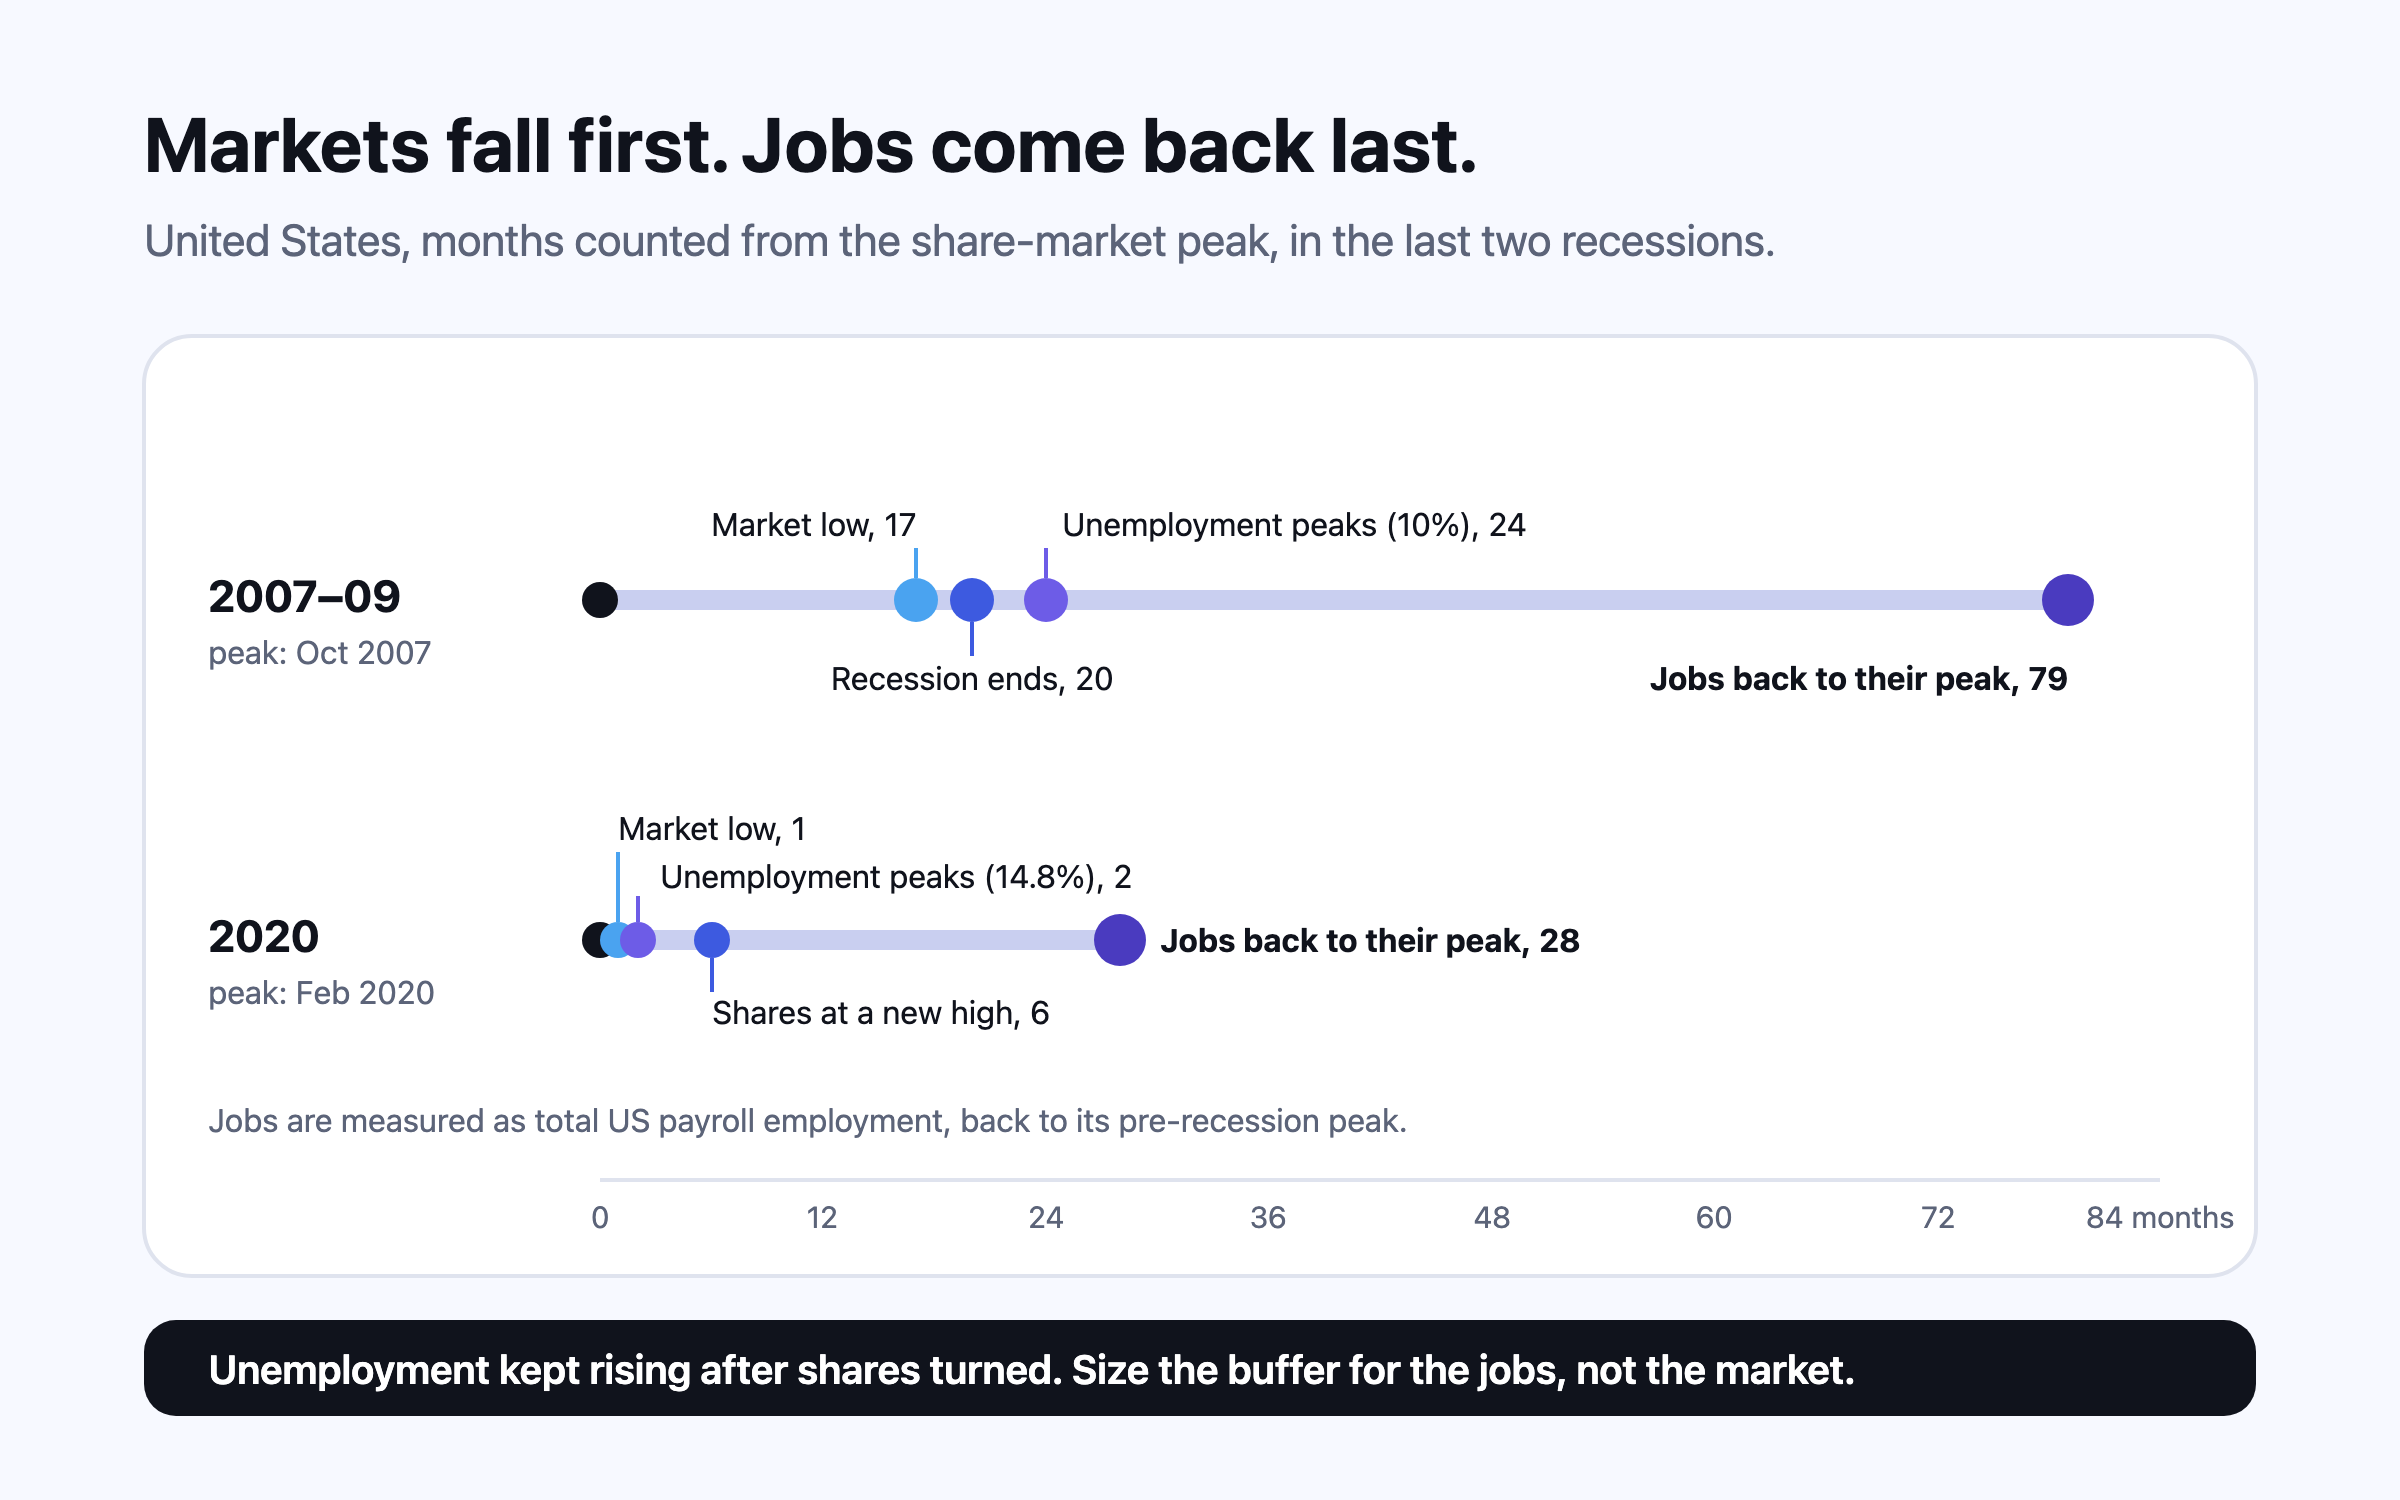
In the US the share market bottomed in March 2009, unemployment peaked seven months later at 10%, and payroll jobs did not regain their early-2008 level until May 2014. The cash that carries a household through is sized by how long a search can take in a bad year — the median reached 25 weeks in 2010 — and the portfolio is protected mostly by not being sold at the bottom.
This is general information, not financial, tax or legal advice for your circumstances. Rules and figures change; check the official source for your country, and consult a licensed professional before making financial decisions. Projections are estimates, not predictions.