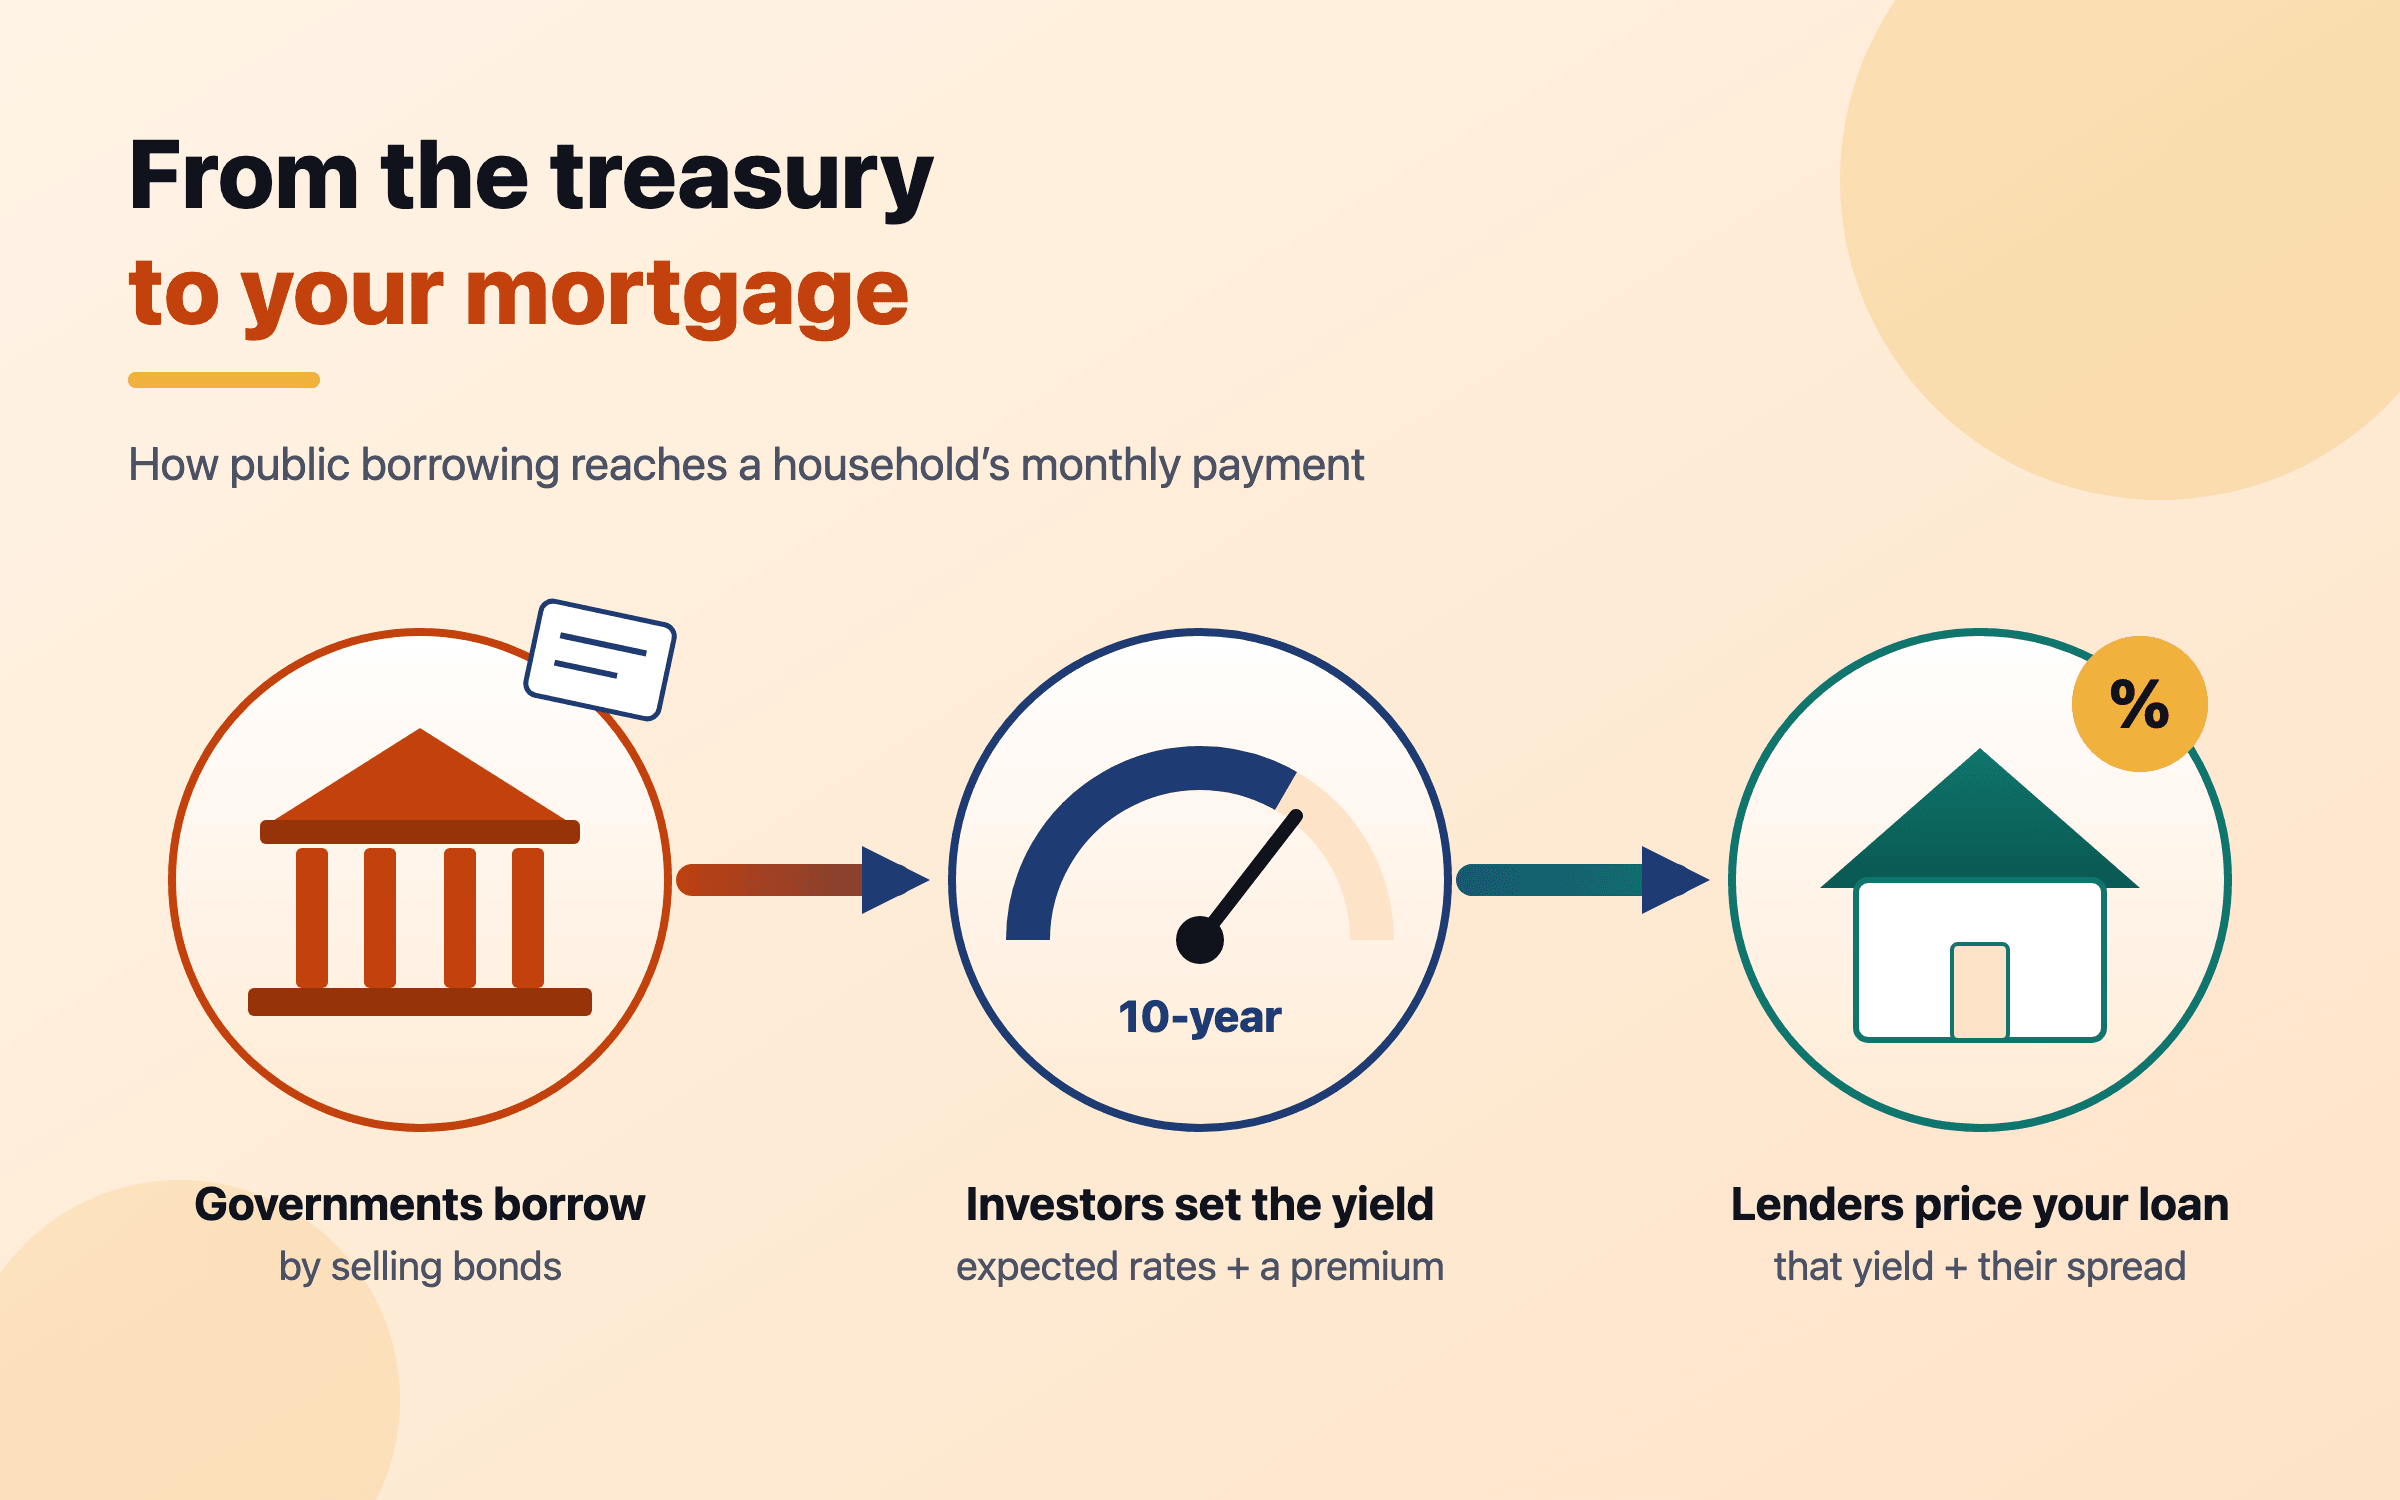
When governments borrow more, investors can demand more to lend for ten years — and fixed-rate borrowers pay it.
Public debt is heading toward 100% of world GDP, and the extra return investors want for lending long — the term premium — has climbed back above zero. Ten-year yields set fixed mortgage rates in the US, UK and Canada; floating loans in India and Australia follow the central bank instead. Know which one your loan follows, and test the payment two points higher.
Nivritee Research · 6 July 2026 · updated 15 October 2026 · 5 min read
Most households meet the bond market only once, through their mortgage. But the rate on a fixed-rate home loan is built on what a government pays to borrow for years at a time, and that has been rising. In October 2026 the US 10-year Treasury yielded 5.21%1 and a 30-year fixed mortgage averaged 7.40%2. This article traces how one leads to the other, why government debt is part of the story, and what you can do about it in your own loan.
How much governments owe
The IMF estimates that general government debt reached about 94% of world GDP in 2025, and its April 2026 Fiscal Monitor projected it reaching 100% by 2029, a year earlier than it had expected a year before3. Its October 2026 figures put the crossing in 20304. The averages hide wide differences:
General government gross debt as a share of GDP, 2025 estimate and 2030 projection
2025
2030 (projected)
IMF World Economic Outlook, October 2026. Gross debt, before subtracting what governments own; Singapore’s borrowing largely funds investments rather than deficits, so its gross figure overstates its burden. 4The figures in this chart
2025
2030 (projected)
Japan
204.8%
190.1%
Singapore
165.7%
169.0%
Italy
137.1%
135.8%
United States
124.4%
140.7%
France
115.5%
123.2%
Canada
113.6%
108.8%
United Kingdom
102.1%
100.9%
China
98.6%
119.5%
World
94.0%
100.3%
India
84.3%
77.0%
Germany
62.7%
73.6%
Australia
51.9%
54.3%
The direction matters more than the level. The IMF projects US debt rising from 124.4% of GDP in 2025 to 140.7% in 2030, France’s from 115.5% to 123.2% and China’s from 98.6% to 119.5%, while Japan’s and India’s ratios edge down4. More debt means more bonds to sell every year, and somebody has to be persuaded to buy them.
What a bond yield is made of
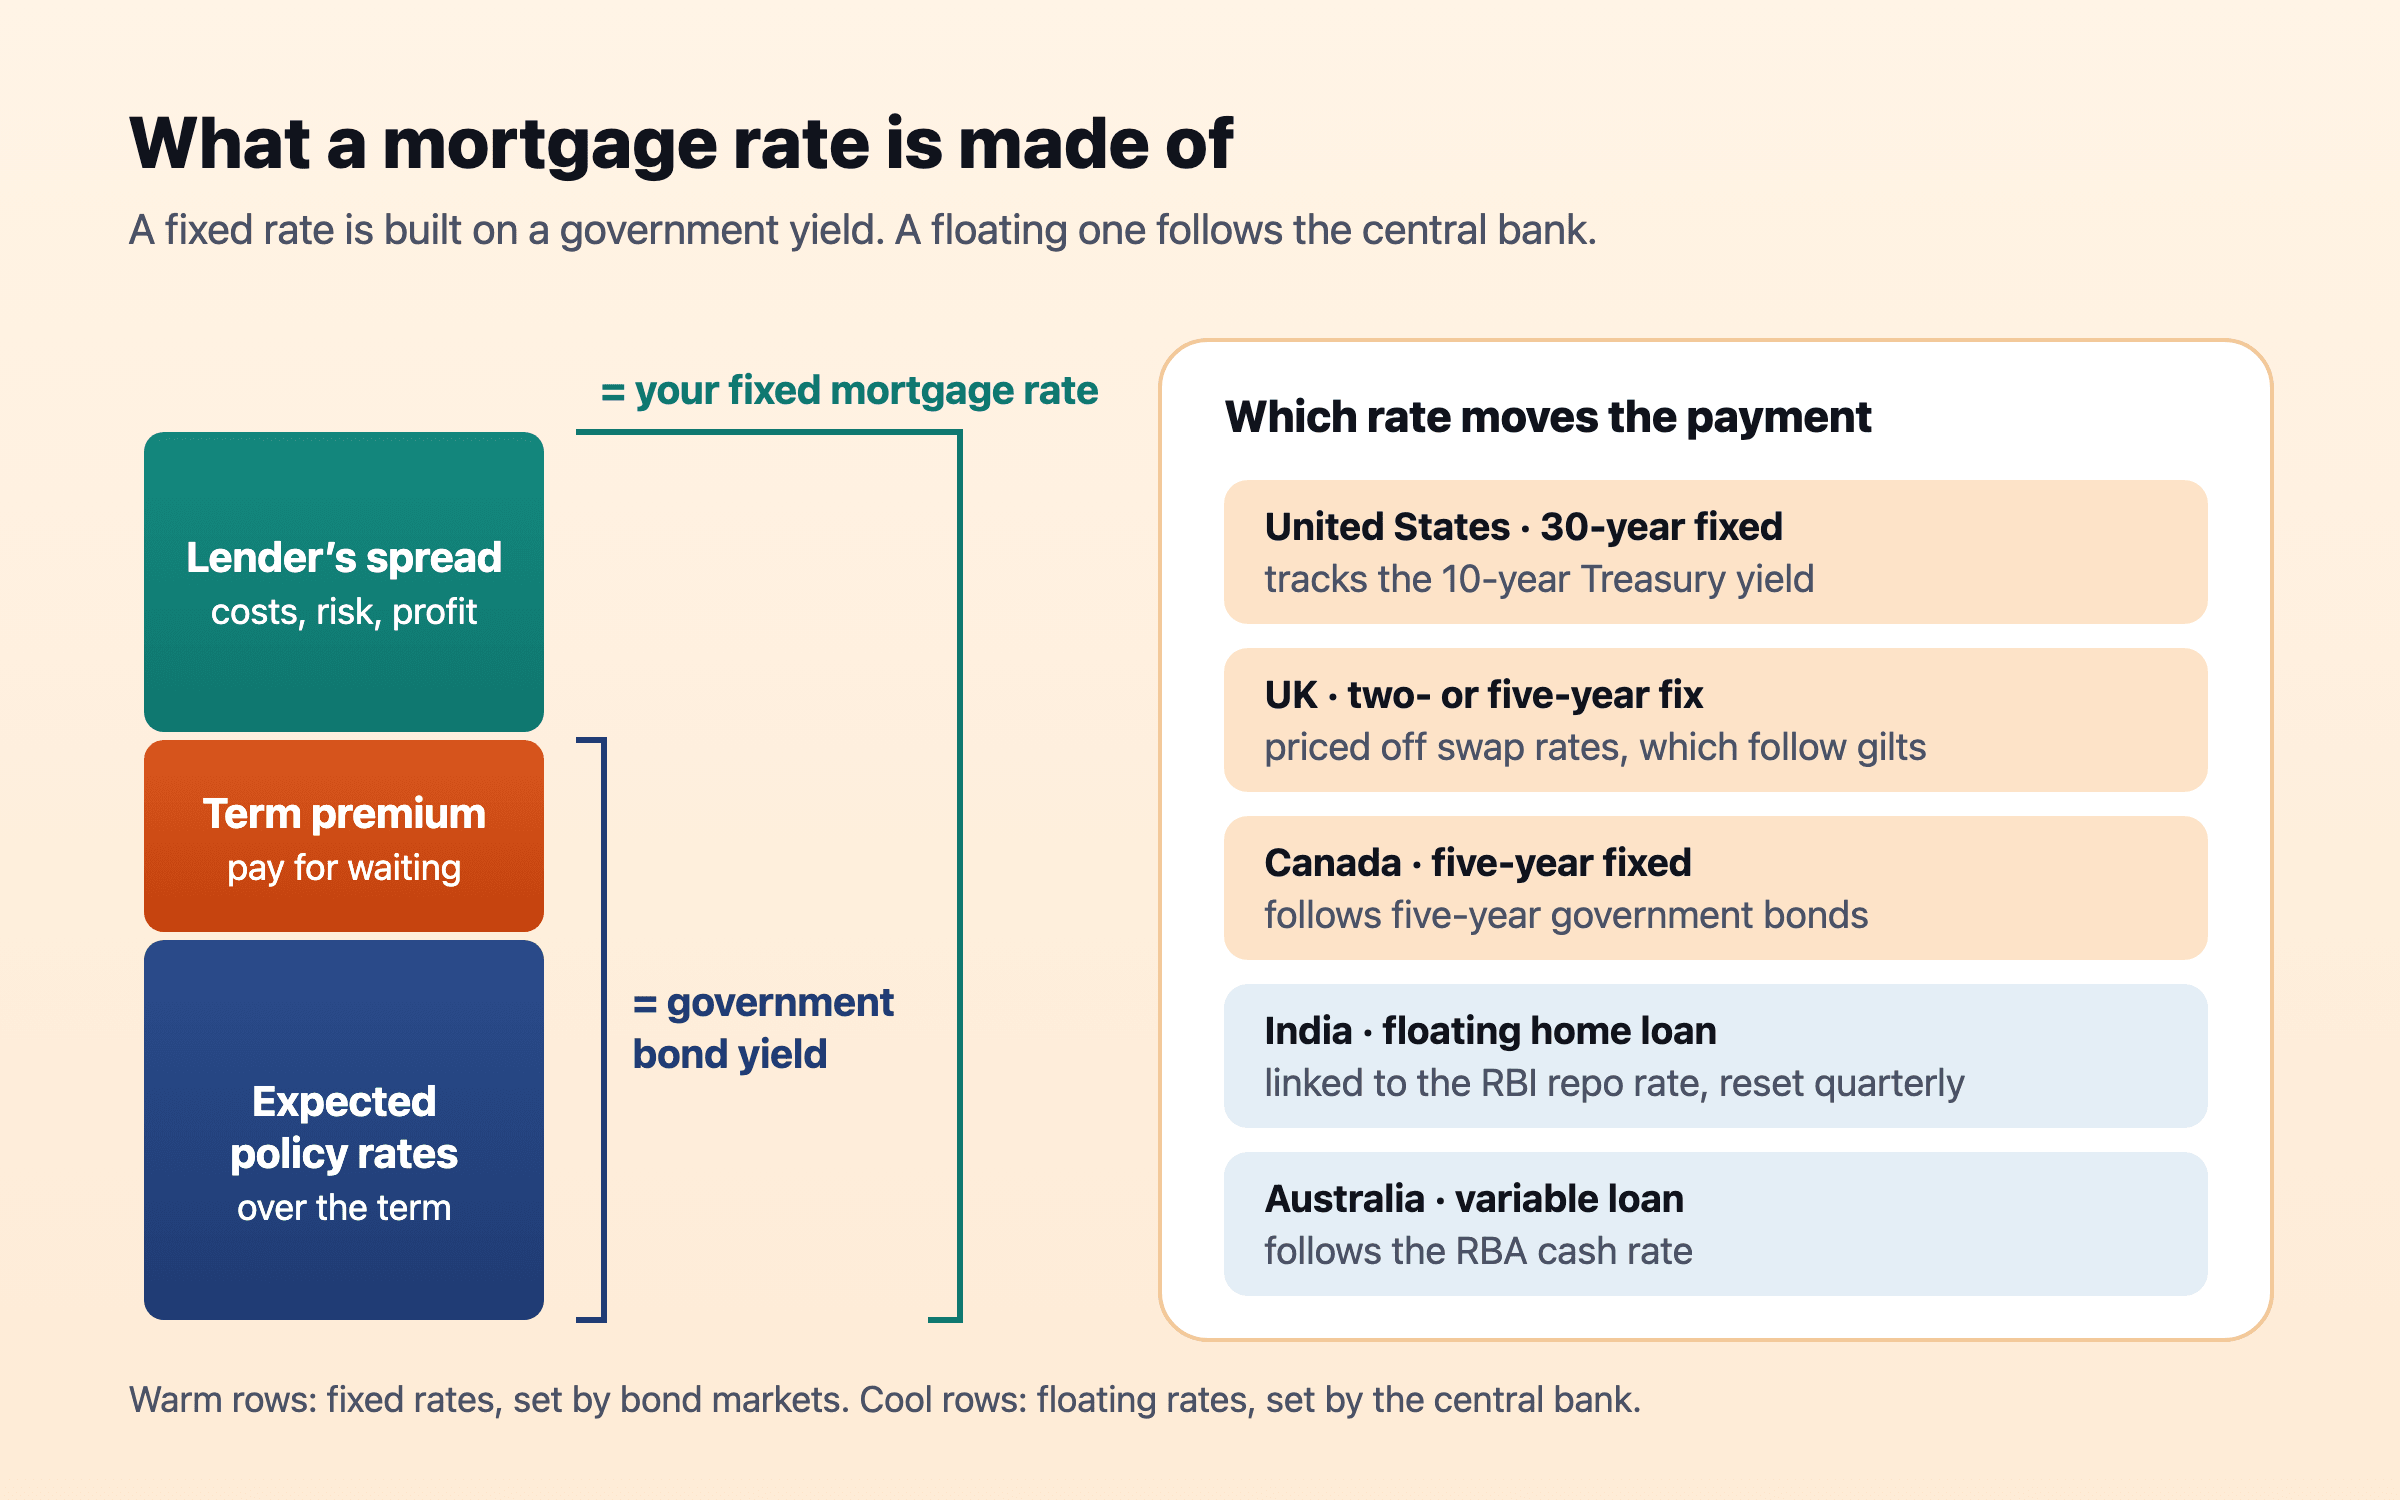
A 10-year government bond yield has two parts. The first is what investors expect short-term interest rates to average over the ten years — essentially a forecast of the central bank. The second is the term premium: the extra return investors want for locking their money up for ten years rather than rolling over short-term lending, and so bearing the risk that rates do not go as expected5. The central bank controls the first part closely. The second is set by the market, and that is where debt comes in.
Because government deficits have grown, investors have had to absorb more debt issuance.
— Bank of Canada, Financial Stability Report 20266
The Bank of Canada goes on to say that those investors face funding and balance-sheet limits, so they have demanded more compensation, and that this has been one driver of higher long-term yields6. The New York Fed’s estimate of the US 10-year term premium shows the shift: −0.79% at the end of 2019, when investors were paying for the safety of long bonds, 0.47% at the end of 2024 and 0.85% on 13 October 20267. A Federal Reserve note found that the jump in the 10-year yield from below 4% to above 5% in the second half of 2023 was driven mainly by the term premium, not by expectations of Fed policy5.
A fixed mortgage rate is a government yield plus the lender’s spread, so a rising term premium reaches it directly. A floating rate is tied to the central bank instead.
Yields in October 2026 show how far this has gone. The UK 10-year was 5.43% on 12 October8, the US 5.21%1, and Japan’s 3.02% on 14 October9 — high for a country whose 10-year yield was held near zero for most of the last decade.
United States: the 30-year fixed follows the 10-year
Because most American 30-year fixed loans are repaid or refinanced long before their term ends, lenders price them off the 10-year Treasury plus a spread. Calculated from the Federal Reserve’s data, that spread averaged 1.70 percentage points from 1971 to 20192,1. It widened to 2.85 points on average in 2023, when rate volatility made lenders and investors in mortgage bonds demand more, and has since narrowed to 1.96 points so far in 2026. In the week of 8 October 2026 it was 2.18: 7.40% against 5.22%2,1.
Gap between the US 30-year fixed mortgage rate and the 10-year Treasury yield, in percentage points
Weekly Freddie Mac rates against the 10-year yield on the same day or the day before, averaged. A borrower’s rate moves with both: the yield, and how wide the gap is. 2,1The figures in this chart
Average spread
1971–2019 average
1.70
2022
2.39
2023
2.85
2024
2.51
2025
2.30
2026 to October
1.96
The good news for existing US borrowers is that a 30-year fixed rate never resets. A rise in yields reaches only those who buy, move or refinance — which can make owners with older, cheaper loans reluctant to move.
United Kingdom: short fixes and the 2022 gilt shock
British borrowers fix for two or five years at a time; in the third quarter of 2025, 90% of outstanding mortgage balances were on fixed rates10. Lenders price those fixes off market rates that move with gilts, so a gilt shock reaches every borrower whose fix ends while it lasts.
September 2022 showed how fast that can happen. After the mini-budget, the 30-year gilt yield rose 130 basis points in three trading days — three times larger than any comparable move on record — exposing pension funds’ leveraged “liability-driven” investments to margin calls11. The Bank of England announced temporary purchases with capacity of up to £65 billion, and in the end bought £19.3 billion of gilts between 28 September and 14 October11. Mortgage lenders pulled products and repriced: the average two-year fix peaked at 6.65% and the five-year at 6.51% on 20 October 202212, against below 2% in the years before13.
The repricing is still working through. The Bank’s July 2026 Financial Stability Report expected a little over 5 million households to see their repayments rise by the end of 2028, with the typical owner-occupier coming off a fix in the next two years paying £45 a month more; the average two-year fix at 75% loan-to-value was 4.92%14.
India, Australia and Canada: whose rate moves the loan
India. Since 1 October 2019, every new floating-rate home loan from a bank must be linked to an external benchmark — in practice usually the RBI’s repo rate — and reset at least once every three months15. So an Indian borrower’s rate follows the RBI, not the 10-year bond. The RBI raised the repo rate by a quarter-point to 5.50% on 7 October 202616. SBI’s external benchmark rate was the repo plus 2.65 points, 7.90% before the rise17. See interest rates and your money on why lenders often stretch the tenure instead of raising the EMI.
Australia. Fewer than 5% of new and outstanding mortgages are on fixed terms, so almost every loan follows the cash rate18, which the RBA raised to 4.60% from 30 September 202619.
Canada. Five-year fixed mortgages make up around 40% of all mortgages, and about 60% of all outstanding mortgages were expected to renew in 2025 or 202620. Those fixes are priced off five-year government bonds. The Bank of Canada expects the last pandemic-era five-year fixed loans, about 12% of all mortgages, to renew within the next year with payments around 15% higher on average6.
For a household that earns in one country and owns a home in another — a family in Dubai with a flat in Bengaluru, say — the rate on the loan is set by the country of the loan, whatever the currency of the salary paying it.
What a household can do
Stress-test the payment two points higher
Whatever kind of loan you have, work out the payment if the rate were two percentage points higher and ask whether the household could carry it. Two points is not extreme: Britain’s two-year fixes went from below 2% in the years before 2022 to an average of 6.65% that October13,12.
Illustrative arithmetic on a standard repayment loan. US: Freddie Mac’s average for the week of 8 October 2026. UK: the July 2026 average two-year fix. India: an illustrative floating rate that rose with the quarter-point repo rise. 2,14,16
Illustrative loan
Rate today
Monthly payment
Two points higher
Extra each month
US: $400,000 over 30 years
7.40%
$2,770
$3,334
$565
UK: £250,000, 25 years left, fix ending at 2.00%
4.92%
£1,450 (was £1,060)
£1,754
£304
India: ₹50 lakh over 20 years
8.25% (8.00% before 7 October)
₹42,603 (was ₹41,822)
₹49,082
₹6,479
Fix or float
Fixing buys certainty about the payment; floating keeps you exposed but usually starts cheaper and lets you benefit when rates fall. Where you have the choice — the UK, Canada, and some lenders in India and Australia — the question is less which will be cheaper, which nobody knows, than which risk the household can carry. If a two-point rise in the stress test above would break the budget, the certainty is worth paying for.
Overpay or invest
Every extra payment earns the loan’s rate, with certainty and usually free of tax. With mortgage rates of 7% and more in the US2, that is a return that investing has to beat after tax and risk, not just on average. The full comparison, and the order to do things in, is in pay off debt or invest.
Questions people ask
Why do mortgage rates go up when government debt rises?
More government borrowing means more bonds to sell, and investors can demand a higher term premium to hold them. Fixed mortgage rates are priced off government yields plus a spread, so they rise too6.
What is the spread between the 30-year mortgage rate and the 10-year Treasury?
It averaged about 1.70 percentage points from 1971 to 2019, widened to 2.85 in 2023 and was about 2.18 in October 20262,1.
What is the term premium?
The extra yield investors want for lending for ten years rather than rolling over short-term loans. The New York Fed’s estimate for the US 10-year rose from −0.79% at the end of 2019 to 0.85% in October 20267.
Does the 10-year bond yield affect Indian home loans?
Not directly. Floating-rate bank home loans in India are linked to an external benchmark, usually the RBI’s repo rate, and reset at least every three months15.
What happened to UK mortgages after the 2022 mini-budget?
Gilt yields jumped, lenders withdrew products, and average two-year fixes peaked at 6.65% on 20 October 202212, against below 2% in prior years13.
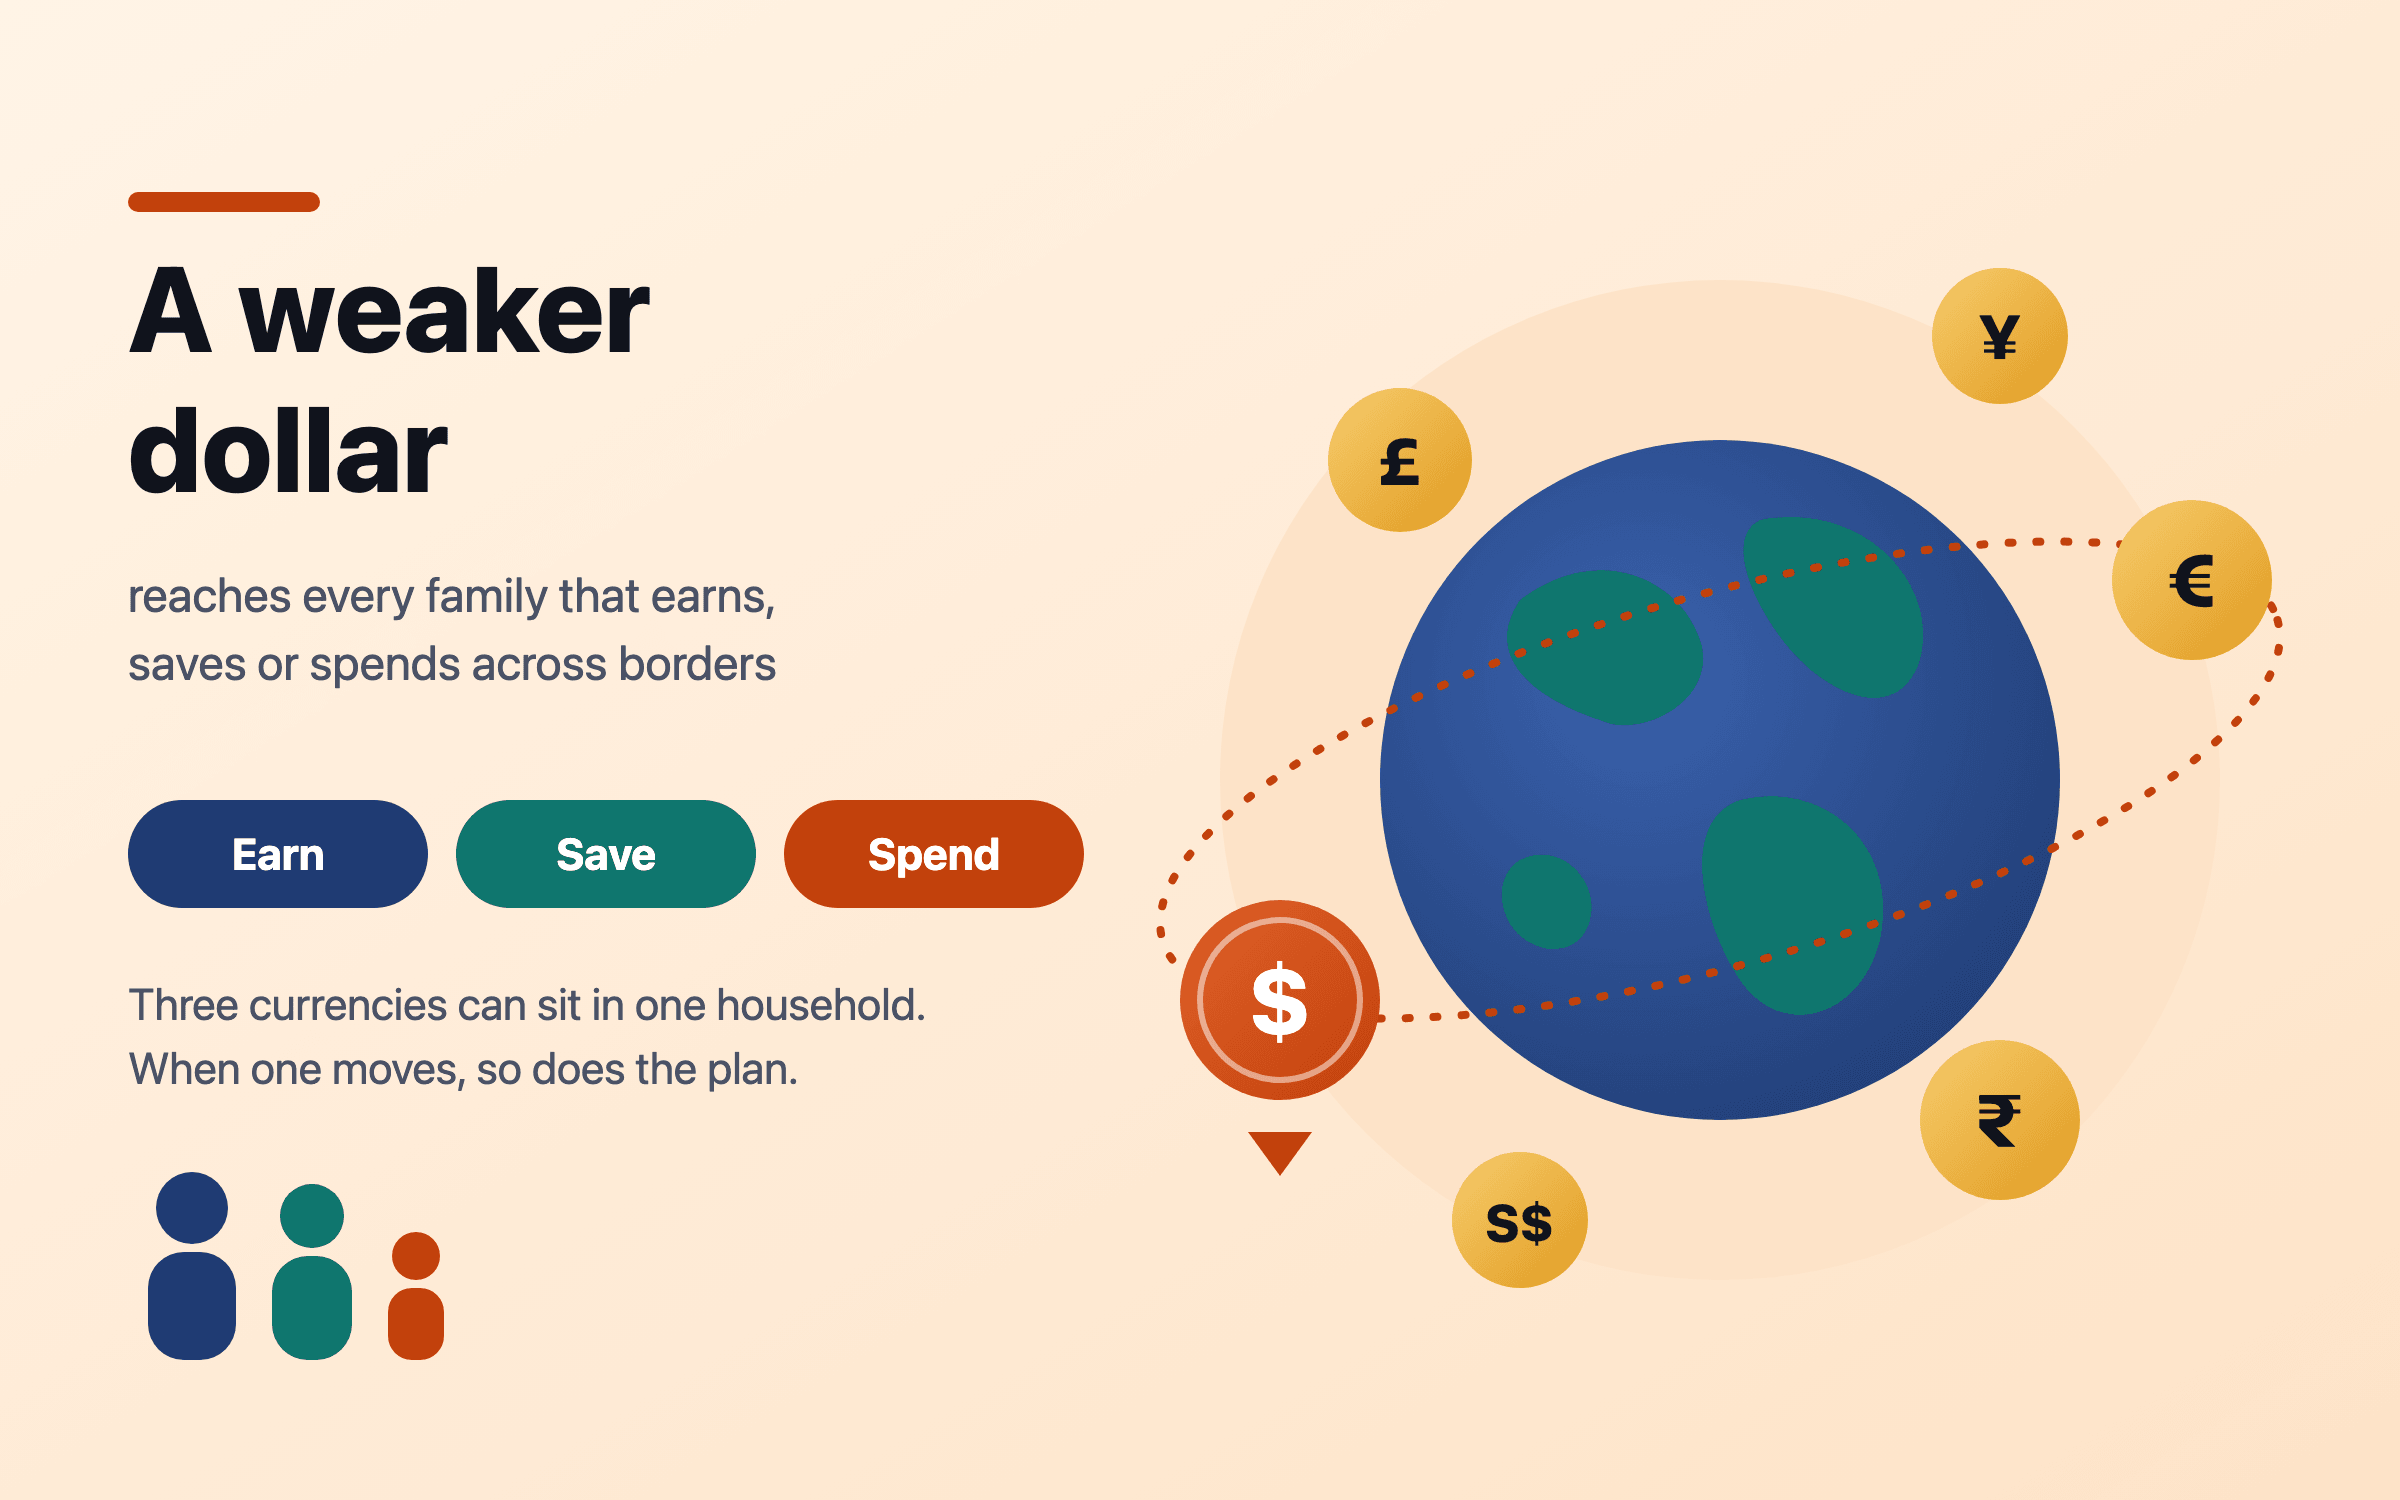
The US dollar index fell 10.8% in the first half of 2025, its worst start to a year since 1973, and the Fed’s broad dollar index ended 2025 down 7.4%. In 2026 the dollar steadied, and the rupee fell to record lows near 97 as oil surged. The same S&P 500 returned 16.4% in dollars in 2025, 2.7% in euros and 22.2% in rupees. What matters for a family is not which way the dollar moves but whether its savings are in the currency it will spend.
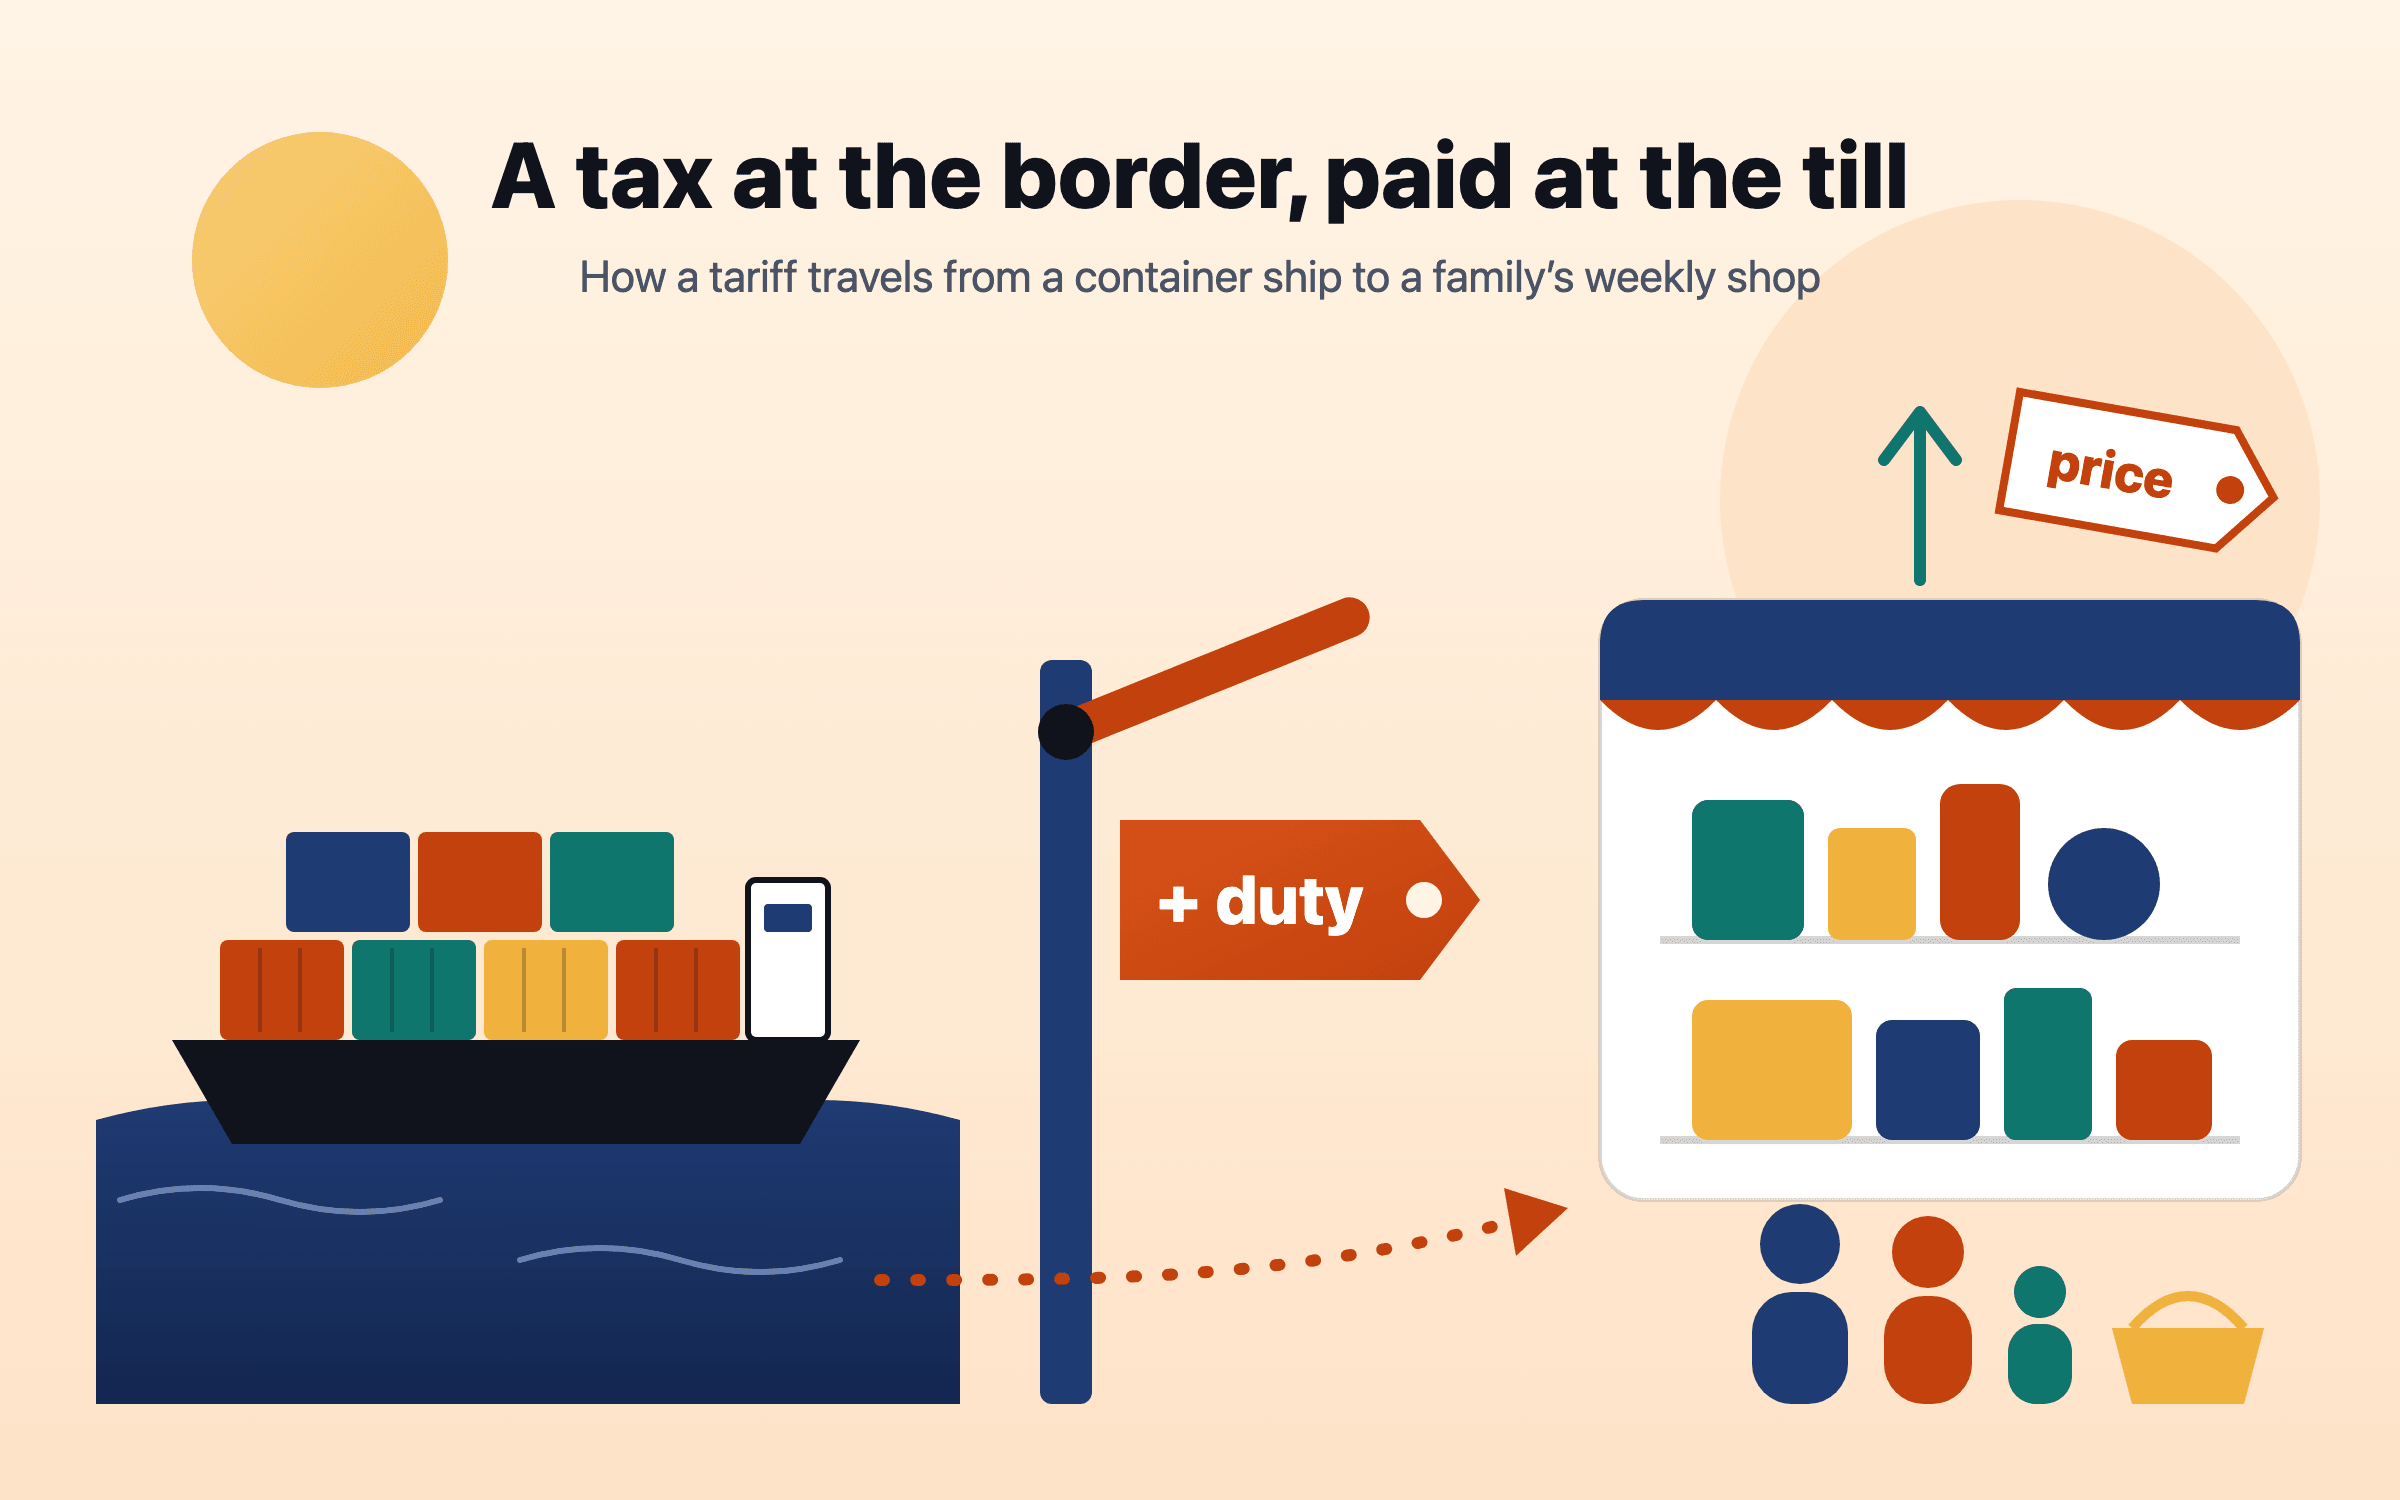
US tariffs rose in 2025 to their highest average level in about ninety years, were cut back by a Supreme Court ruling in February 2026, and were rebuilt under other laws. Research finds the cost lands mostly on buyers in the importing country, spread across importers, shops and households; Yale’s Budget Lab puts it at about $1,100 a year for the average US household. Elsewhere the effect arrives through export orders, jobs, markets and interest rates. The useful response is a budget that knows which costs are rising, a cash buffer sized to your job’s exposure, and no trading on headlines.
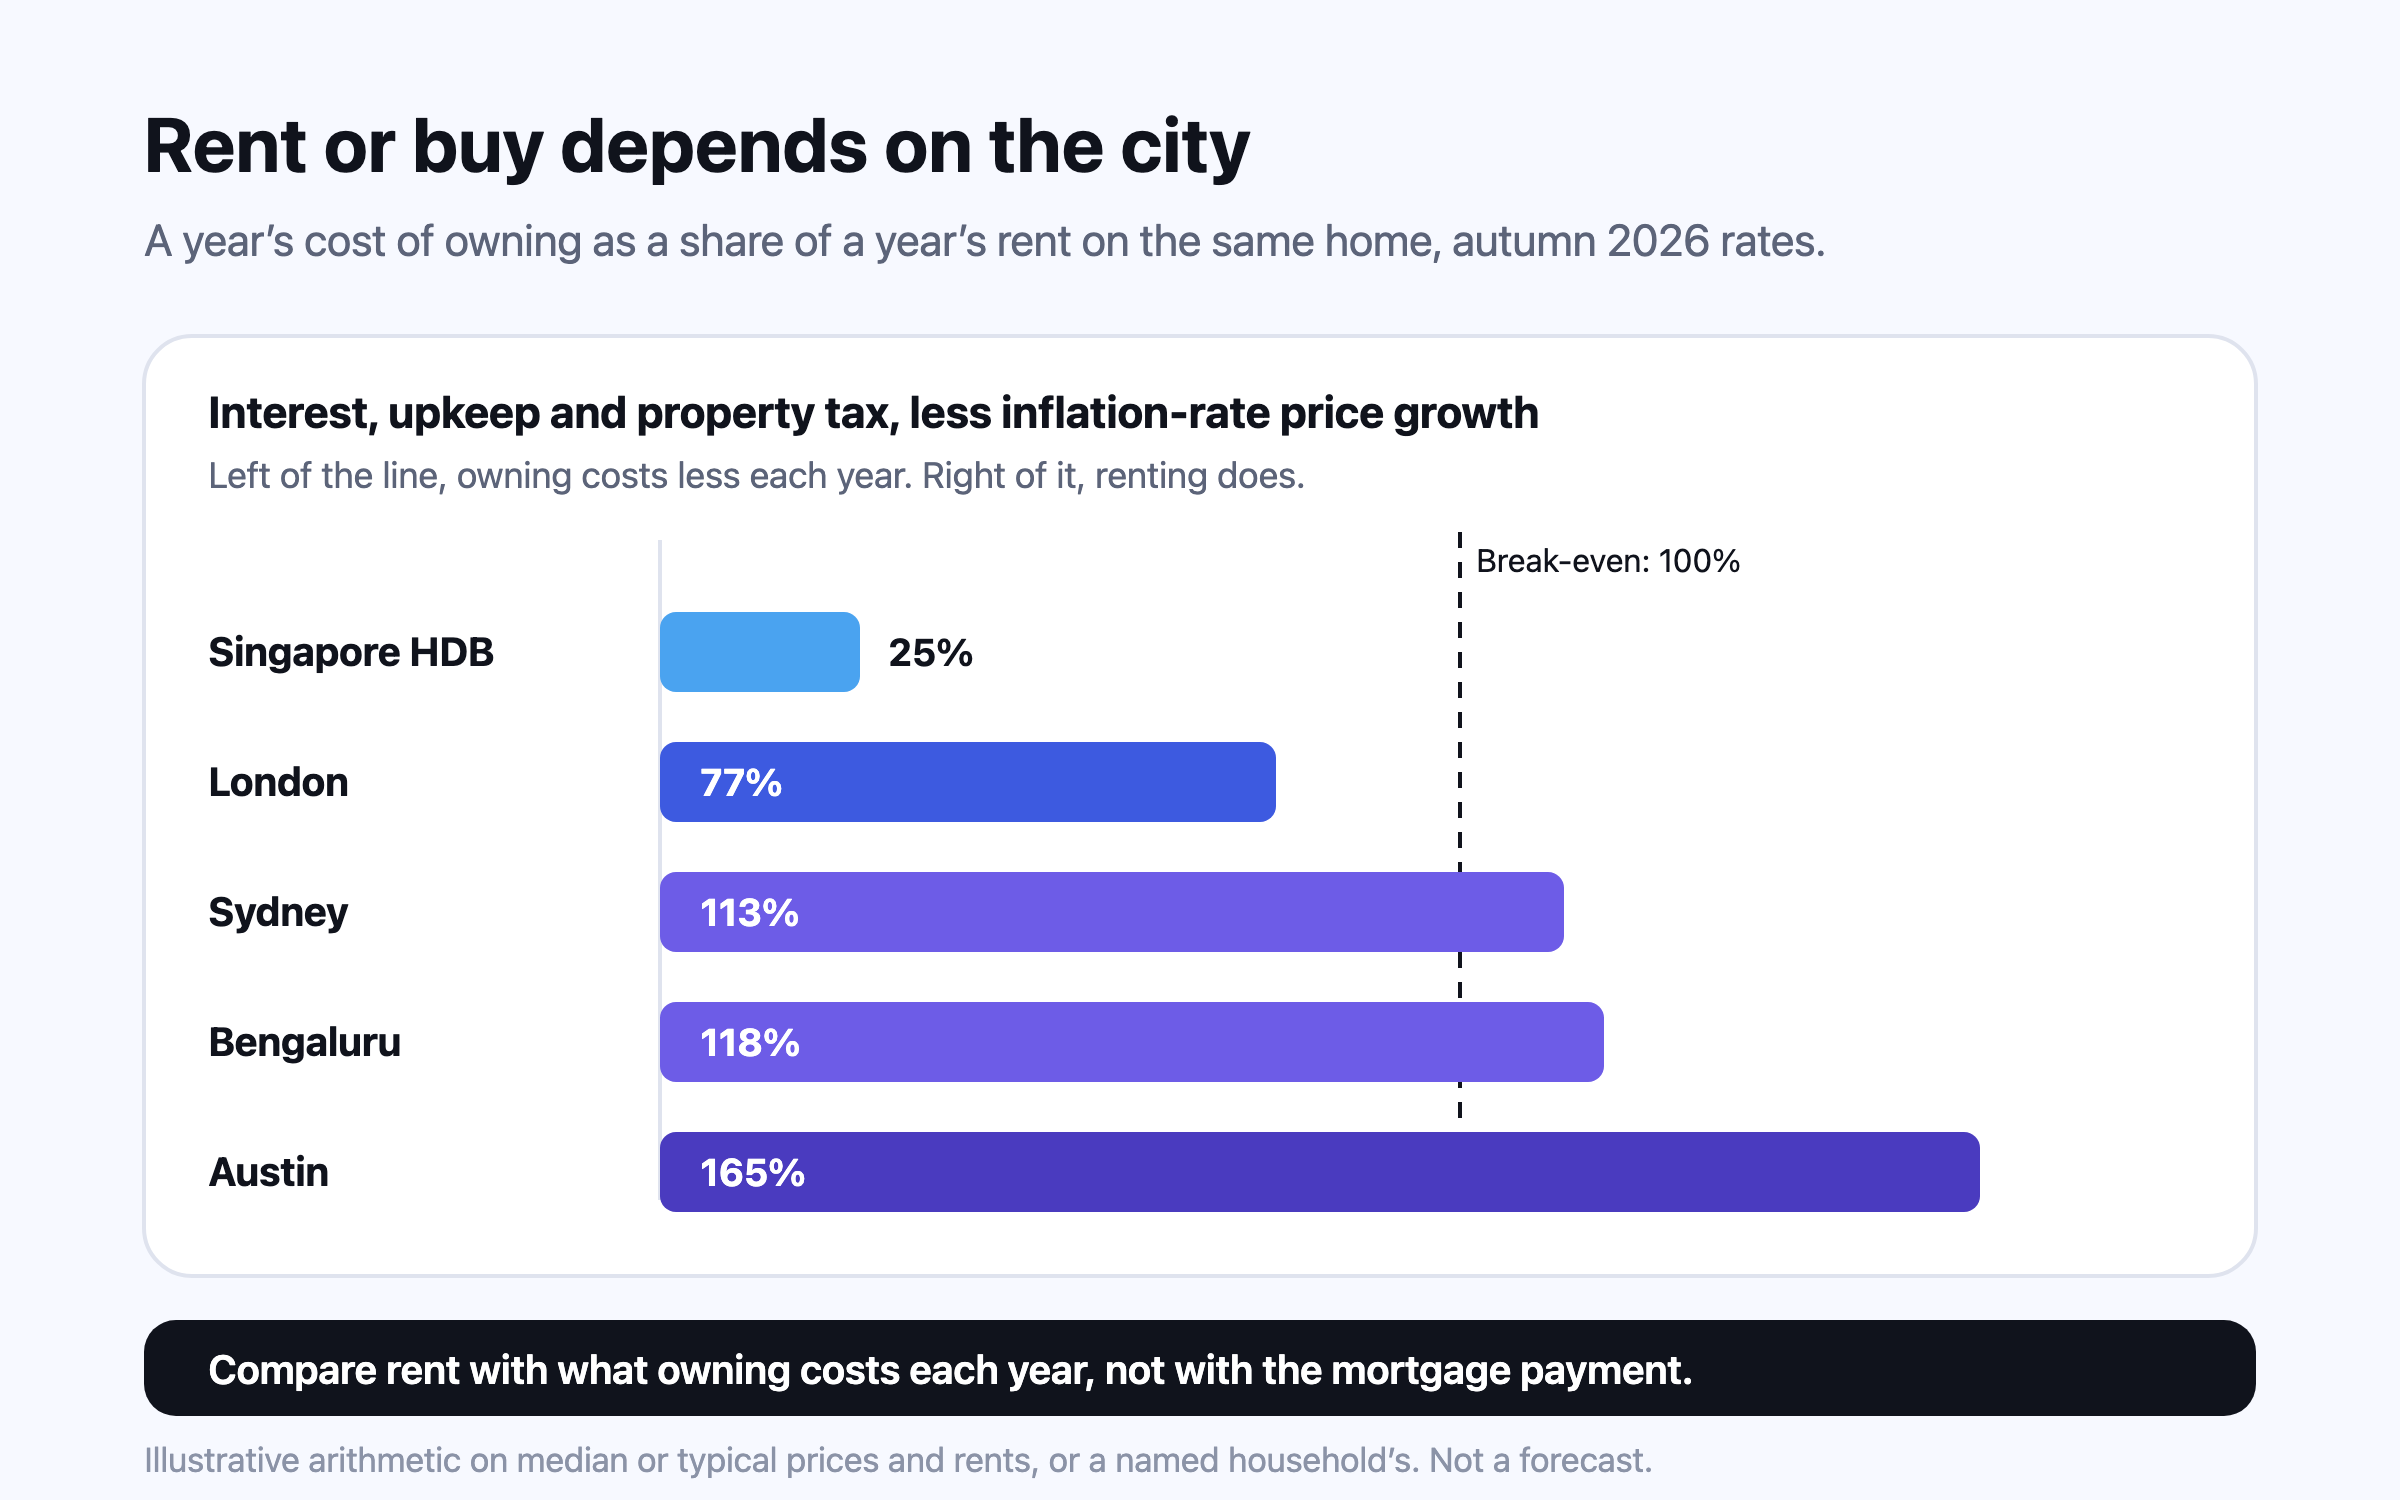
Compare rent with the unrecoverable cost of owning — interest, upkeep, property tax and the return your deposit gives up, less expected price growth — not with the mortgage payment. At autumn 2026 rates, owning the average London home costs somewhat less than renting it, an Austin home costs far more to own than to rent, and an HDB flat in Singapore costs far less. Transfer taxes then decide how long you must stay.
This is general information, not financial, tax or legal advice for your circumstances. Rules and figures change; check the official source for your country, and consult a licensed professional before making financial decisions. Projections are estimates, not predictions.