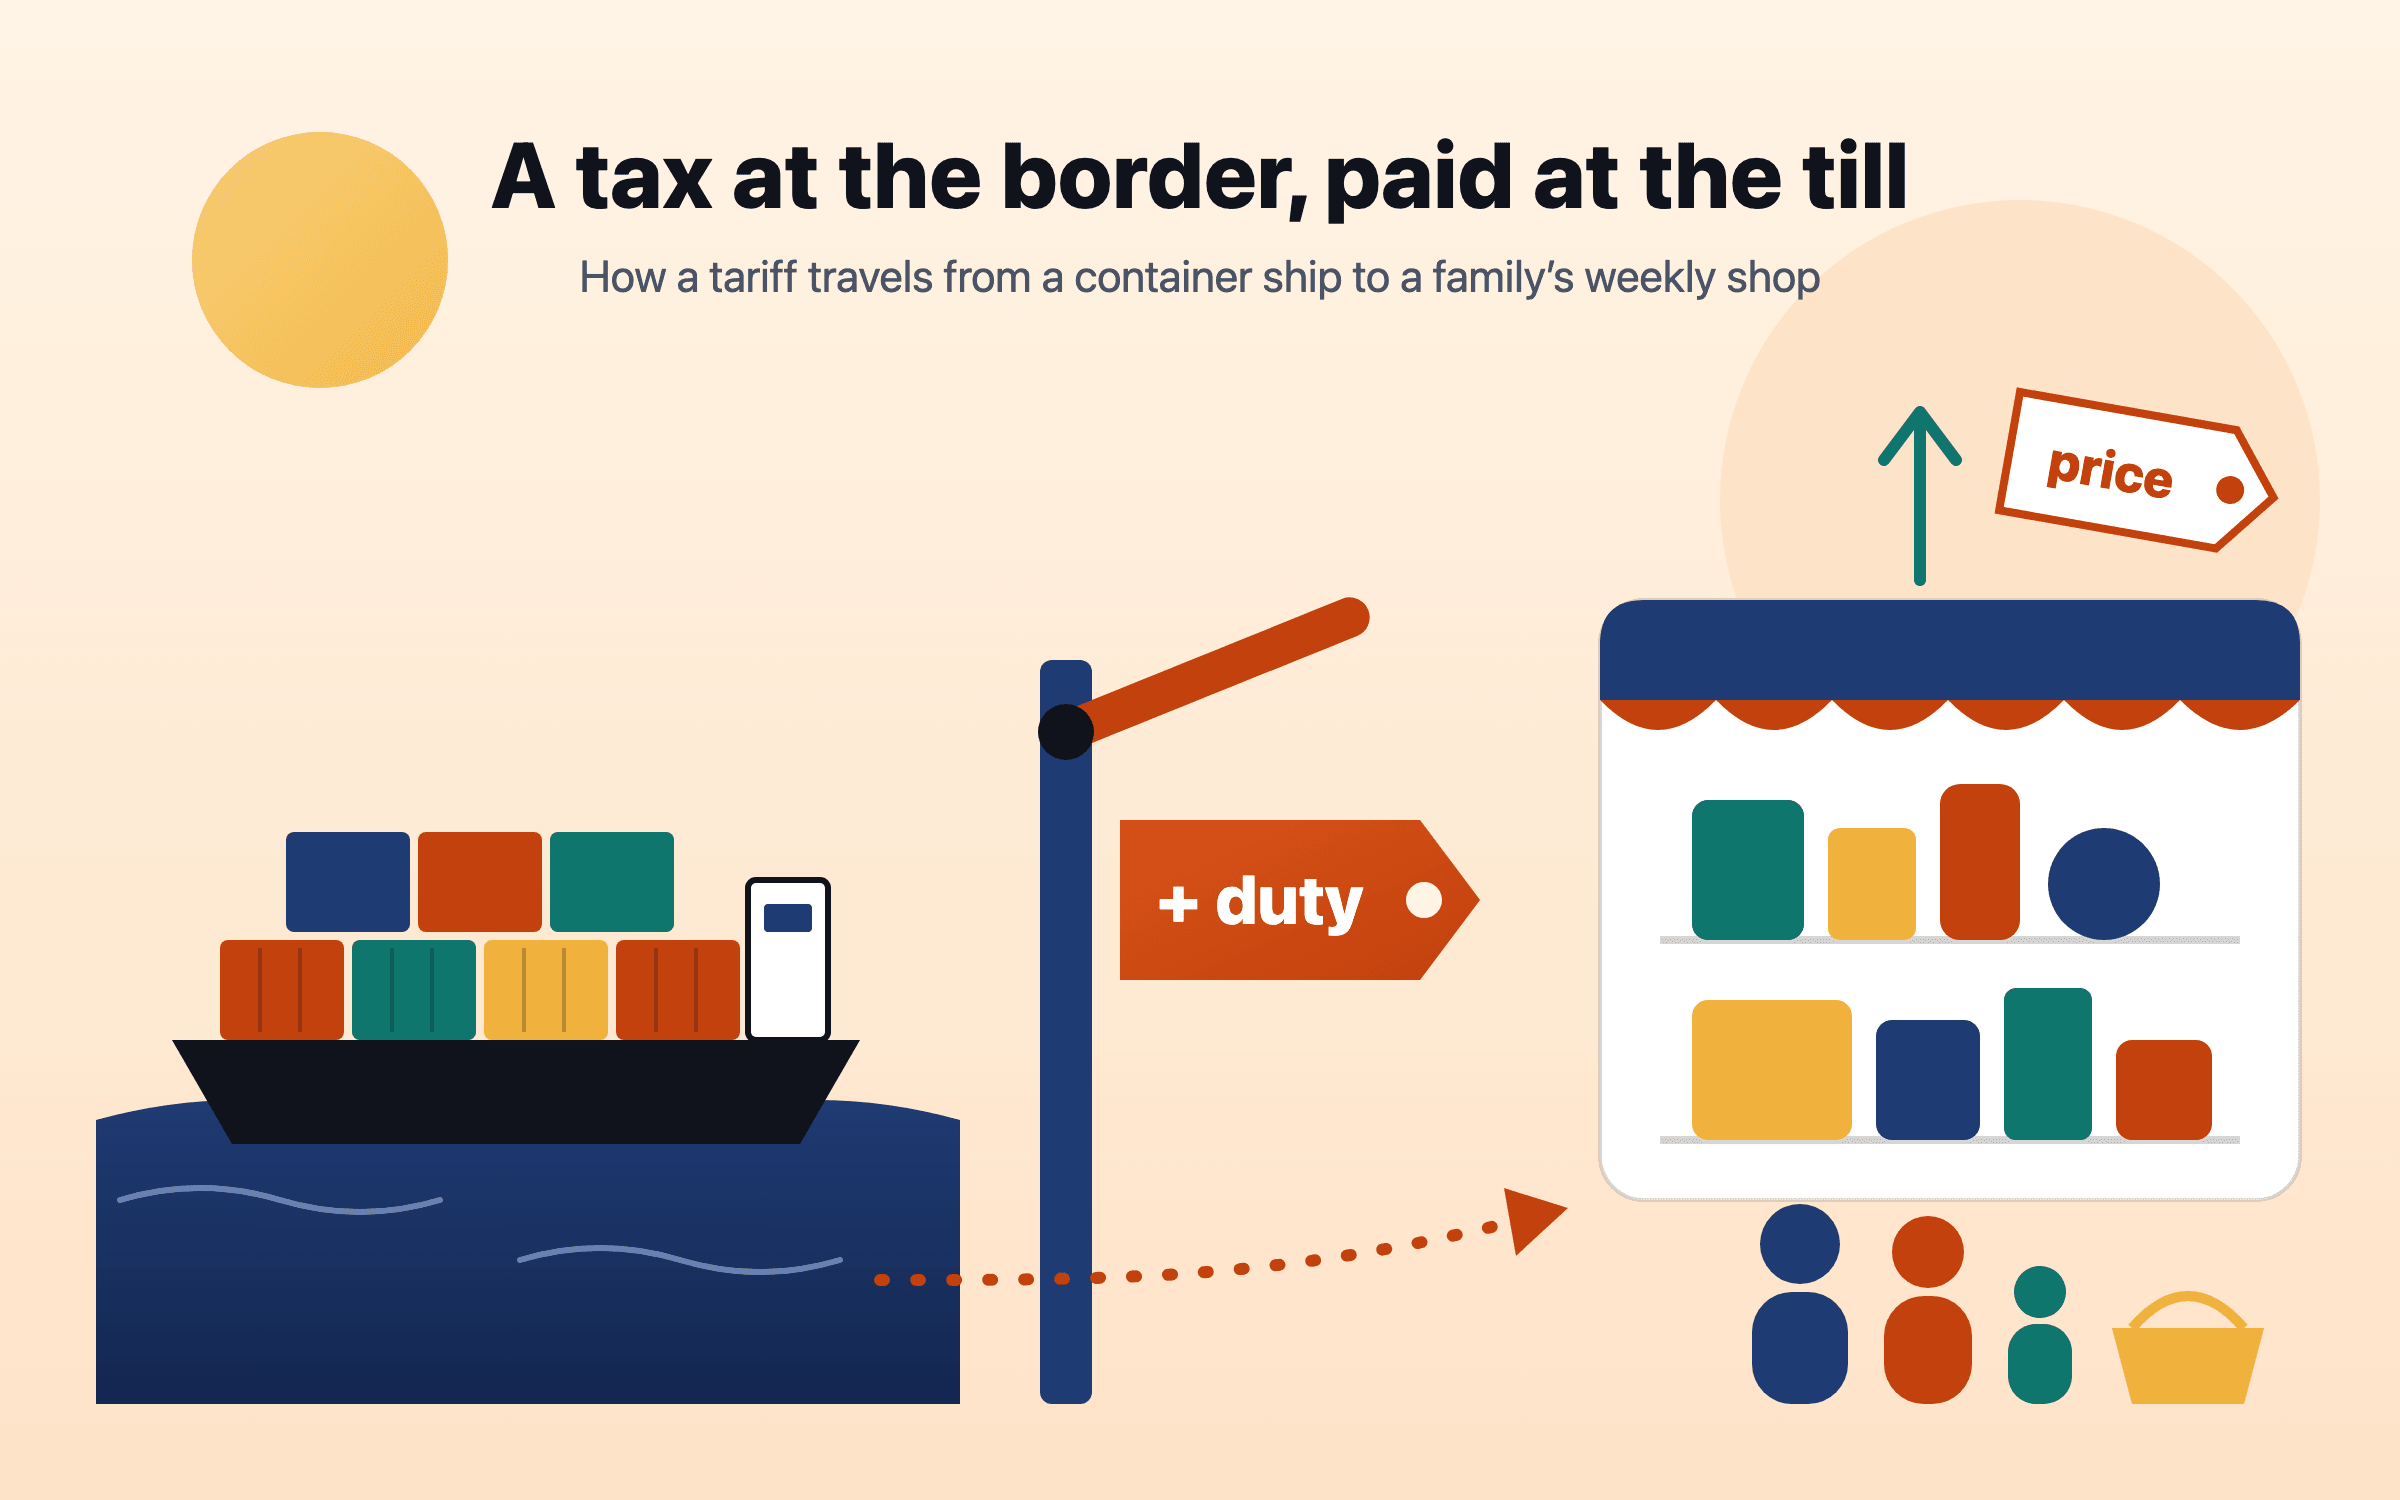
US tariffs reached their highest level since the 1930s. Here is how a tax at the border reaches a family’s prices, job, loans and savings.
US tariffs rose in 2025 to their highest average level in about ninety years, were cut back by a Supreme Court ruling in February 2026, and were rebuilt under other laws. Research finds the cost lands mostly on buyers in the importing country, spread across importers, shops and households; Yale’s Budget Lab puts it at about $1,100 a year for the average US household. Elsewhere the effect arrives through export orders, jobs, markets and interest rates. The useful response is a budget that knows which costs are rising, a cash buffer sized to your job’s exposure, and no trading on headlines.
Nivritee Research · 29 September 2026 · updated 15 October 2026 · 7 min read
A tariff is a tax on goods as they cross a border, paid by whoever imports them. For most of the past fifty years America’s were low. Then, in 2025, the US raised them on almost every trading partner, and Yale’s Budget Lab estimated that, before the court ruling below, American consumers faced an average effective tariff rate of 14.3%, the highest since 19391. On 20 February 2026 the Supreme Court ruled that the emergency-powers law used for most of them did not authorise tariffs at all2. They were replaced within days, under other laws, and in August 2026 the average statutory rate stood at 11.0%3.
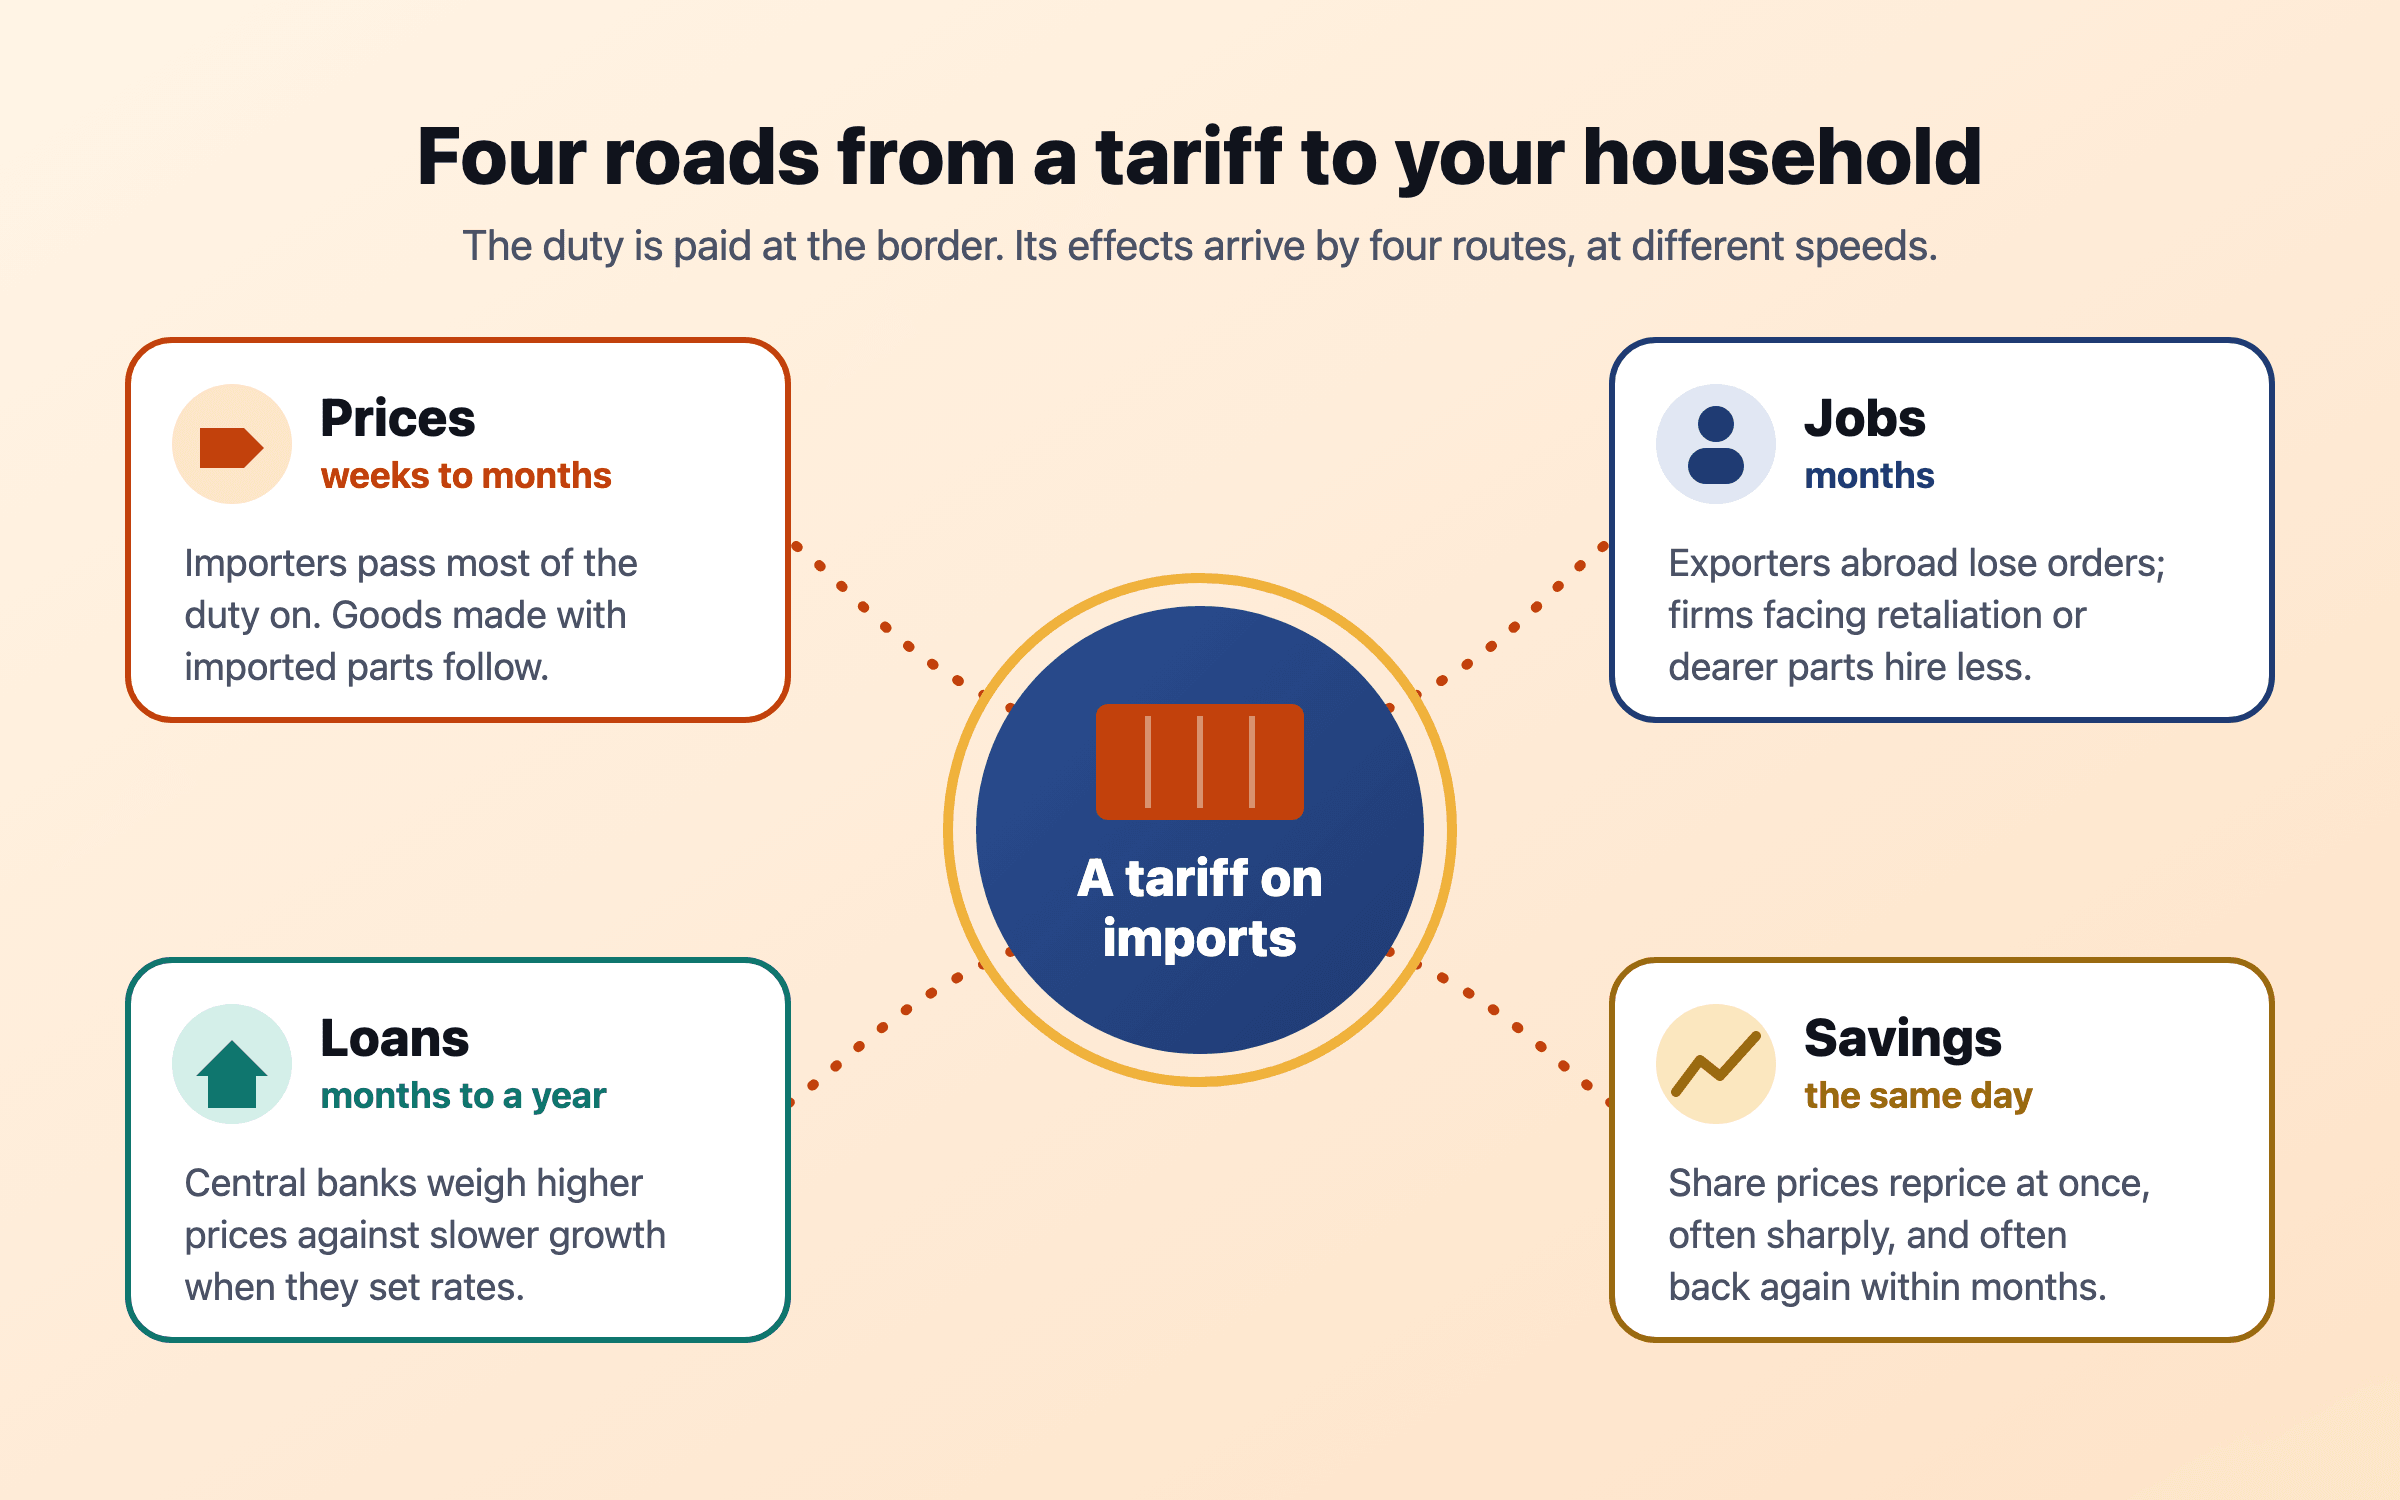
Very few households import anything themselves, yet tariffs reach almost all of them. In the US the route is prices. Elsewhere it runs through export orders and jobs, through share prices, and through what central banks do next. This article follows each route with the evidence, puts the episode beside a century of US tariff history, and ends with what a household can actually do.
Fall in the S&P 500 in the four sessions after 2 April 2025
A century of US tariffs in one line
One simple measure of how high tariffs are is the customs duty collected as a share of the value of goods imported. On Yale’s historical series it was 19.6% in 1932, after the Smoot-Hawley tariff, and fell over the decades after the Second World War as countries negotiated tariffs down: 6.0% in 1950, 3.1% in 1980, 1.4% in 20106. The 2018–19 tariffs on China lifted it to 2.9% in 2019. In 2025 it jumped to 7.7%, more than three times the 2.4% of 20246.
US customs duties as a share of goods imports, 1930 to 2025
Yale Budget Lab’s historical series, built from Historical Statistics of the United States, the Monthly Treasury Statement and BEA trade data. The years are not evenly spaced after 2010. Duties collected lag the rates announced, so 2025 understates where rates ended the year; Yale’s policy-based measure was higher. 6The figures in this chart
Duties collected, % of goods imports
1930
14.8%
1935
17.5%
1940
12.5%
1945
9.3%
1950
6.0%
1960
7.4%
1970
6.5%
1980
3.1%
1990
3.3%
2000
1.6%
2010
1.4%
2019
2.9%
2024
2.4%
2025
7.7%
The money is real. US customs duties were $194.9 billion in the fiscal year to September 2025, against $77.0 billion the year before4. After the court ruling, importers were owed refunds of duties paid under the struck-down law, and net customs receipts were negative in May, June and July 20264.
What happened, 2025 to 2026
2 April 2025. Broad “reciprocal” tariffs announced on most countries, under the International Emergency Economic Powers Act (IEEPA). A 90-day pause on the higher rates followed a week later.
August 2025. India’s rate rose to 50%: a 25% reciprocal tariff plus an extra 25% tied to its purchases of Russian oil, effective 27 August7.
February 2026. A US–India trade deal cut the reciprocal rate to 18% and removed the extra 25%8. Days later, on 20 February, the Supreme Court held that IEEPA does not authorise the President to impose tariffs2.
24 February 2026. A temporary 10% surcharge on imports for 150 days, under Section 122 of the Trade Act9.
24 July 2026. As the surcharge expired, new Section 301 tariffs took effect on 60 trading partners covering 99.4% of US imports, at 10% or 12.5%; goods already covered by sector tariffs on steel, aluminium, cars and similar were excluded10,3.
As summarised by New Zealand’s trade ministry from the US Trade Representative’s notice. Sector tariffs on steel, aluminium and cars sit outside these rates. 11,10
Where the goods come from
Section 301 tariff from 24 July 2026
Australia, New Zealand, Singapore, China
12.5% on top of the normal tariff
UK, India, Canada, Mexico, Malaysia
10% on top of the normal tariff
European Union
10% including the normal tariff
Japan, South Korea, Switzerland
12.5% including the normal tariff
The duty is paid at the border, but it reaches households by four routes, and at four speeds. Savings move first; loans move last.
Who pays: what the research finds
A tariff is charged to the importer, but the importer can pass it on. Studies of the 2018 tariffs found that foreign sellers did not cut their prices to absorb them: the duty passed completely into the prices American buyers paid for the imported goods12. The 2025 round looked different at the till. Researchers tracking daily online prices estimated that only about 20% of the tariff had reached retail prices in the first months, but that tariffs had still added about 0.7 percentage points to US consumer prices by September 2025, with imported goods rising roughly twice as fast as American-made ones13.
The two findings fit together. The duty is paid in full by somebody in the importing country; what varies is how it is split between importers, wholesalers and shops, which absorb some of it in thinner margins, and households, who get the rest in higher prices, sometimes months later as old stock runs out. The Federal Reserve’s chair said in September 2025 that tariffs were mostly being paid by the companies between the exporter and the consumer, and were adding about 0.3 to 0.4 points to core inflation14. Yale’s August 2026 estimate is that current tariffs raise the price level by about 0.7%, or about $1,100 a year for the average household3.
The effect is uneven, which is why a household budget feels it differently from the headline. In the year to September 2026, US prices for toys rose 6.64% and clothing 3.41%, against 3.74% for all items, while furniture and bedding fell 2.43%15. Much of the 2026 rise in the headline rate came from energy rather than tariffs: energy prices rose 20.4% over the same year, against 2.56% for everything except food and energy15; see oil shocks and household budgets.
Outside the US: orders, jobs and growth
For a household in India, Canada or Europe, a US tariff is a tax on what its country sells, so it arrives as fewer orders and slower hiring rather than dearer shopping. US imports from India show the pattern. They ran high early in 2025 as American buyers bought ahead of the tariffs, reaching $11.2 billion in March, then fell to $7.1 billion in November 2025 while the 50% rate applied16. After the February 2026 deal and the court ruling they recovered, to $9.2 billion in August 2026, above August 202516.
US imports of goods from India by month, 2025 against 2026
2025
2026
US Census Bureau, goods imports from India in billions of dollars, not seasonally adjusted. Early 2025 was inflated by buying ahead of the tariffs; August 2026, after the rate fell, was higher than August 2025. 16The figures in this chart
2025
2026
Jan
$8.1bn
$7.9bn
Feb
$8.4bn
$6.8bn
Mar
$11.2bn
$8.4bn
Apr
$10.0bn
$8.3bn
May
$9.4bn
$9.1bn
Jun
$9.1bn
$8.9bn
Jul
$9.2bn
$9.6bn
Aug
$7.9bn
$9.2bn
For the world as a whole, the IMF cut its 2025 growth forecast to 2.8% in April 2025, saying the US effective tariff rate had surged past levels reached during the Great Depression17. By July 2026, with a war weighing on energy importers on top of the trade shock, it expected 3.0% growth in 202618. Retaliation added its own layer: Canada put 25% tariffs on two lists of US goods in March 2025, worth about C$30 billion and C$29.8 billion, and removed most of its counter-tariffs from 1 September 2025, keeping those on steel, aluminium and cars19.
The jobs effect is concentrated, not general. An illustrative couple in Tiruppur where one partner works for a garment exporter selling to American brands faces a different risk from a couple in Pune where both work in domestic services, even though both live in the country whose goods sales to the US fell by more than a third between March and November 202516. If essential spending is ₹80,000 a month, six months of it is ₹4.8 lakh and nine months ₹7.2 lakh; a household whose income depends on exports has a reason to hold the larger figure while the rules keep changing.
Savings: what April 2025 taught
Markets react to tariff news in hours. The S&P 500 closed at 5,670.97 on 2 April 2025, the day the reciprocal tariffs were announced, and at 4,982.77 on 8 April: a fall of 12.1% in four trading sessions, and 18.9% below its February record5. On 9 April the higher rates were paused and the index rose 9.5% in one day. It closed at a new record, 6,173.07, on 27 June 20255.
Anybody who sold in the panic of 7 or 8 April sold near the bottom and missed the best day of the year. That is the usual pattern, not a lucky exception: the worst days and the best days tend to arrive close together, which is why selling after bad news and waiting for calm so often means buying back higher. There is more on this in recessions, jobs and markets and what to do when the market crashes.
Loans: why rates stayed higher
Central banks have to decide whether a tariff is a one-off jump in prices, which they can look through, or the start of something more persistent. In September 2025 the Fed cut its policy rate to 4–4.25%, calling a one-time shift in the price level a reasonable base case14. A year later, saying inflation remained elevated, it raised rates by a quarter point to 3.75–4%20. For borrowers anywhere rates follow the Fed’s lead, that means floating-rate loans priced higher for longer than many expected in 2025; interest rates and your money explains how that reaches a mortgage or a deposit.
What a household can do
Find where your budget is exposed. Imported goods (electronics, clothes, toys, car parts) move most, and not all at once. A budget kept by category shows which lines have risen, and those are the ones worth shopping around for.
Size the cash buffer to your job, not to the average. If your employer exports to the US, or depends on imported parts, hold more months of essentials than a household in a sheltered job. See how big an emergency fund should be.
Do not trade on headlines. Tariff announcements have been made, paused, struck down and replaced within months. A plan decided before the news is more reliable than a decision made during it.
Stay diversified across countries. A portfolio spread over several markets depends less on any one trade relationship; see global diversification over 125 years.
Test the plan against higher inflation for longer. Tariffs and energy together have kept prices rising faster than central banks want. A plan that still works if inflation runs a few points higher for several years is one that does not need the news to go well.
How Nivritee helps
This explains how tariffs reach household finances, using published data and research to October 2026. It does not forecast trade policy or recommend any investment. This is information, not financial advice.
Questions people ask
Who actually pays for tariffs?
Buyers in the importing country, not the exporting country. Studies of the 2018 tariffs found full pass-through to US import prices12; in 2025 importers and shops absorbed part of the cost at first and households paid the rest over time13.
How much do tariffs cost the average household?
Yale’s Budget Lab estimated in August 2026 that US tariffs raise prices by about 0.7%, about $1,100 a year for the average household3.
What did the Supreme Court decide about tariffs?
On 20 February 2026 it held that the International Emergency Economic Powers Act does not authorise the President to impose tariffs2. The tariffs were replaced by a temporary surcharge and then by Section 301 tariffs from July 20269,10.
What US tariff does India face now?
Since 24 July 2026, Indian goods face a 10% Section 301 tariff on top of the normal US tariff, with steel, aluminium and cars under separate sector tariffs11. The 50% rate of late 2025 ended in February 20268.
Should I sell shares when tariffs are announced?
History argues against it. The S&P 500 fell 12.1% in four sessions after 2 April 2025, rose 9.5% on 9 April and reached a new record by 27 June5.
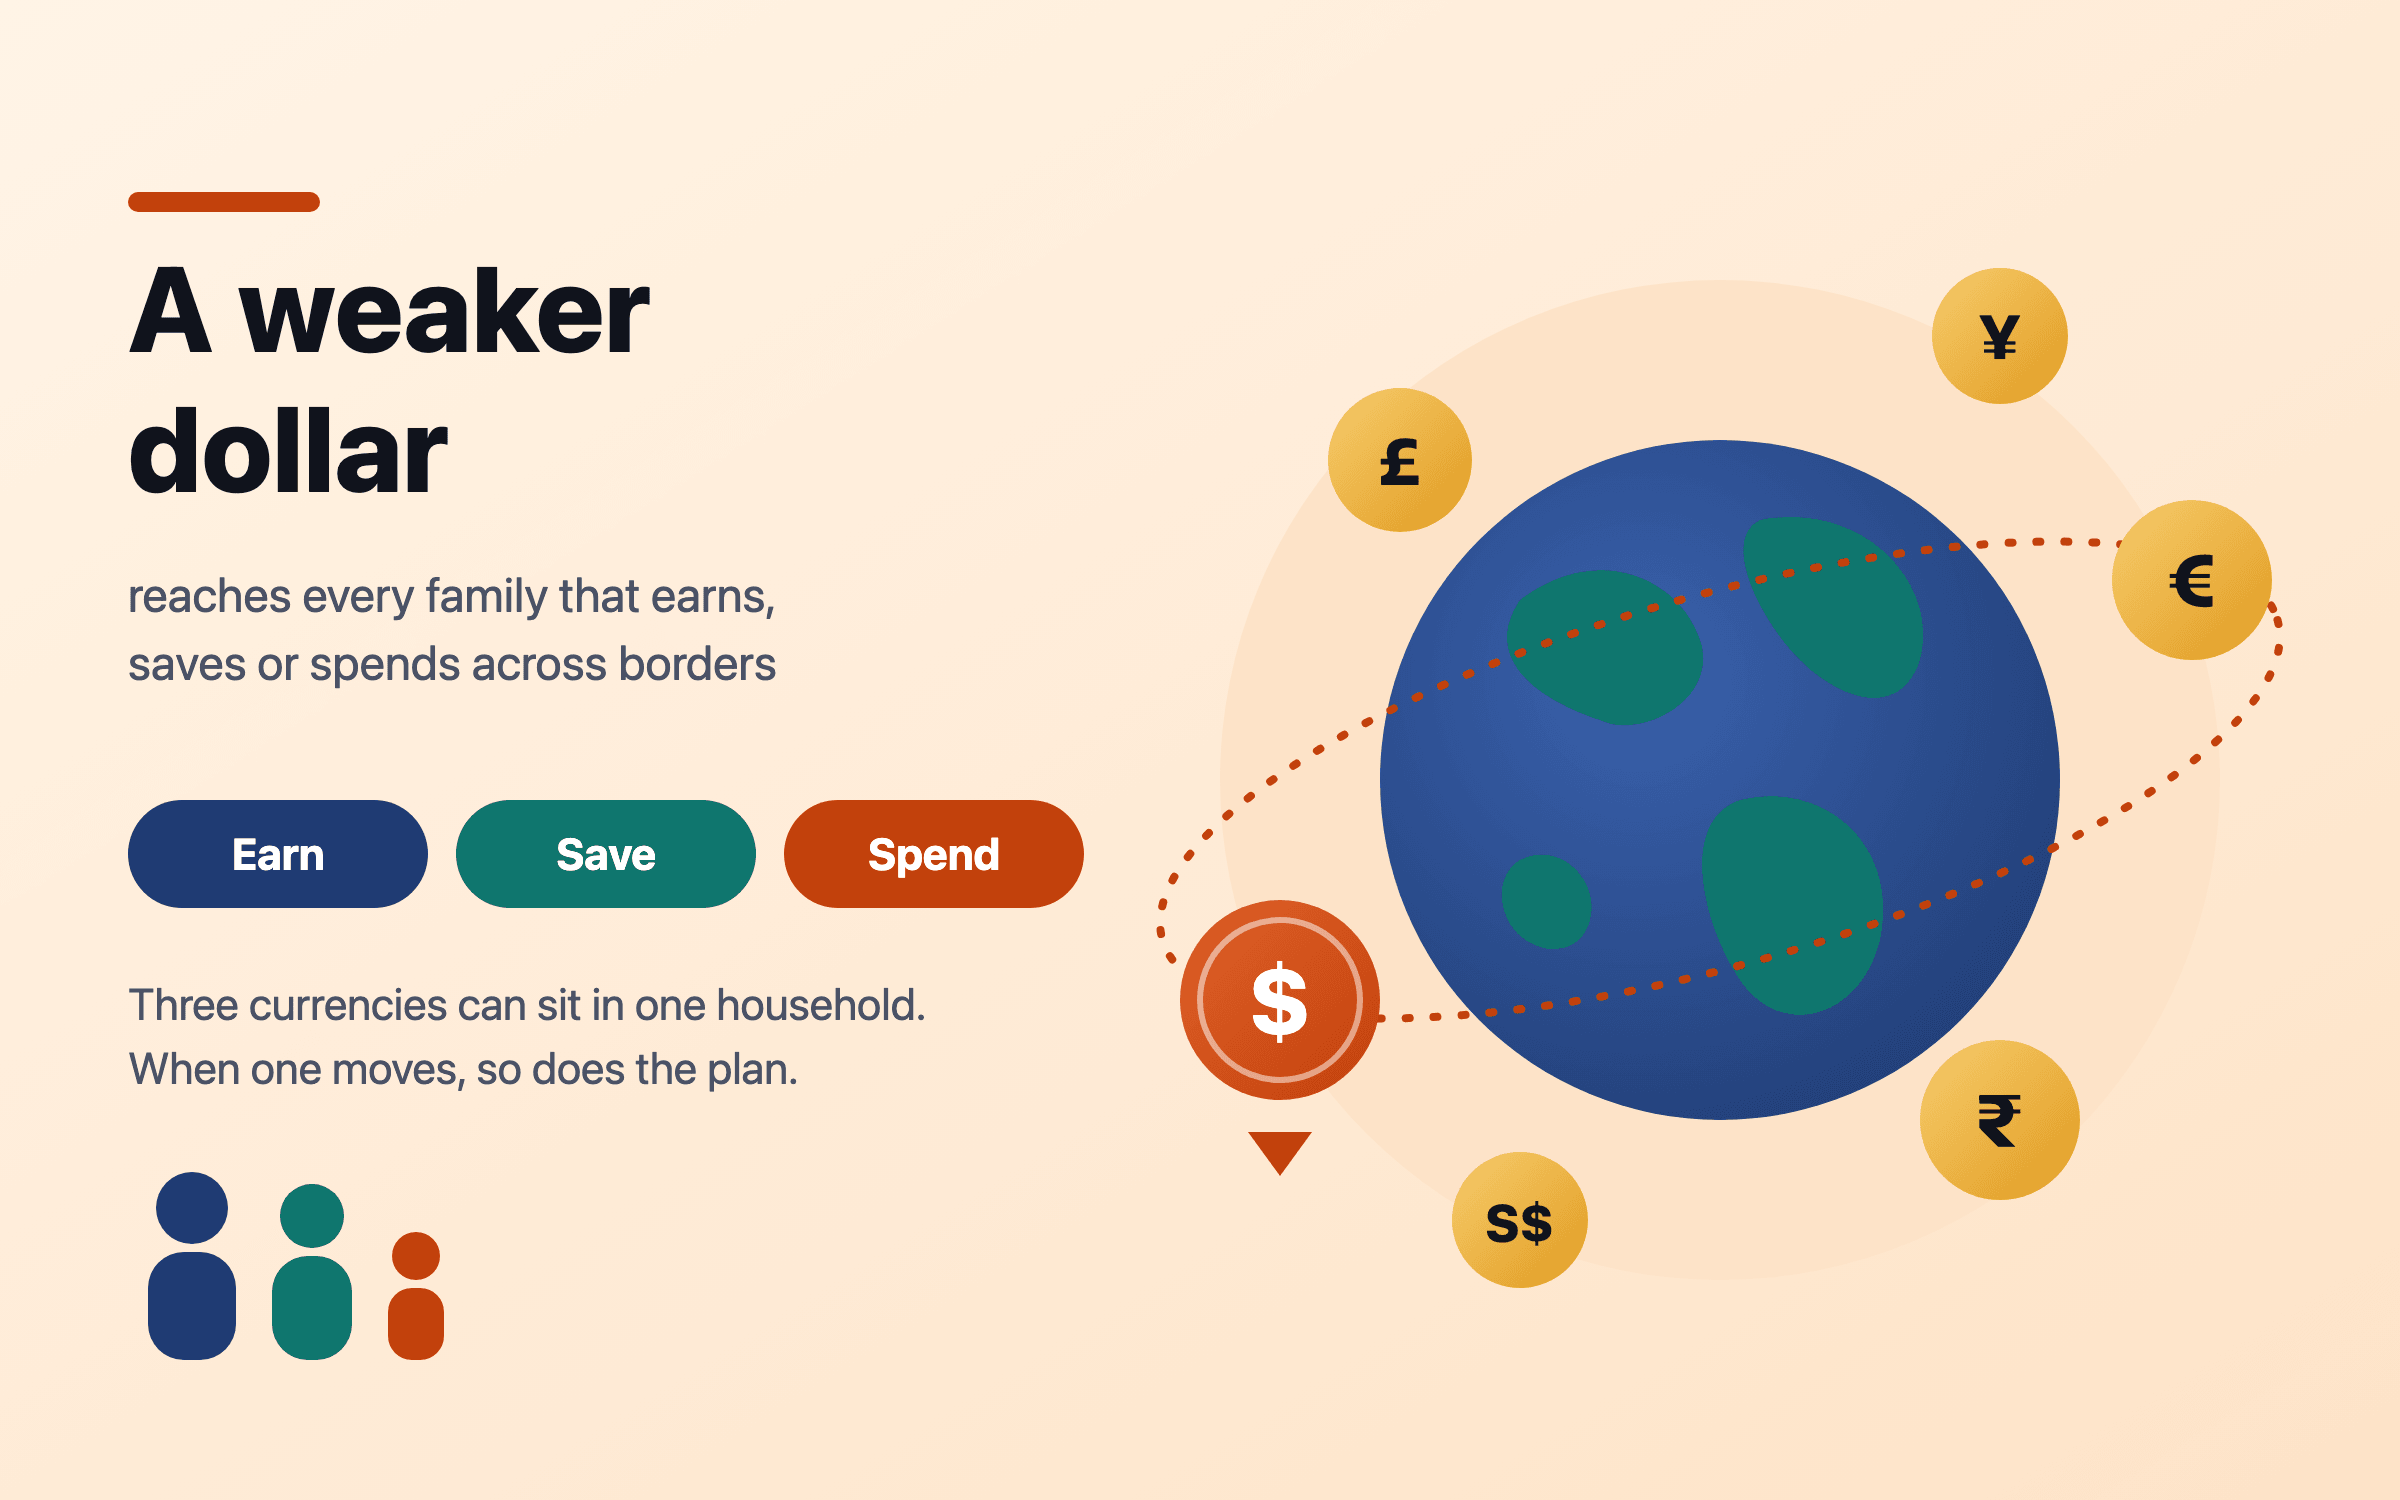
The US dollar index fell 10.8% in the first half of 2025, its worst start to a year since 1973, and the Fed’s broad dollar index ended 2025 down 7.4%. In 2026 the dollar steadied, and the rupee fell to record lows near 97 as oil surged. The same S&P 500 returned 16.4% in dollars in 2025, 2.7% in euros and 22.2% in rupees. What matters for a family is not which way the dollar moves but whether its savings are in the currency it will spend.
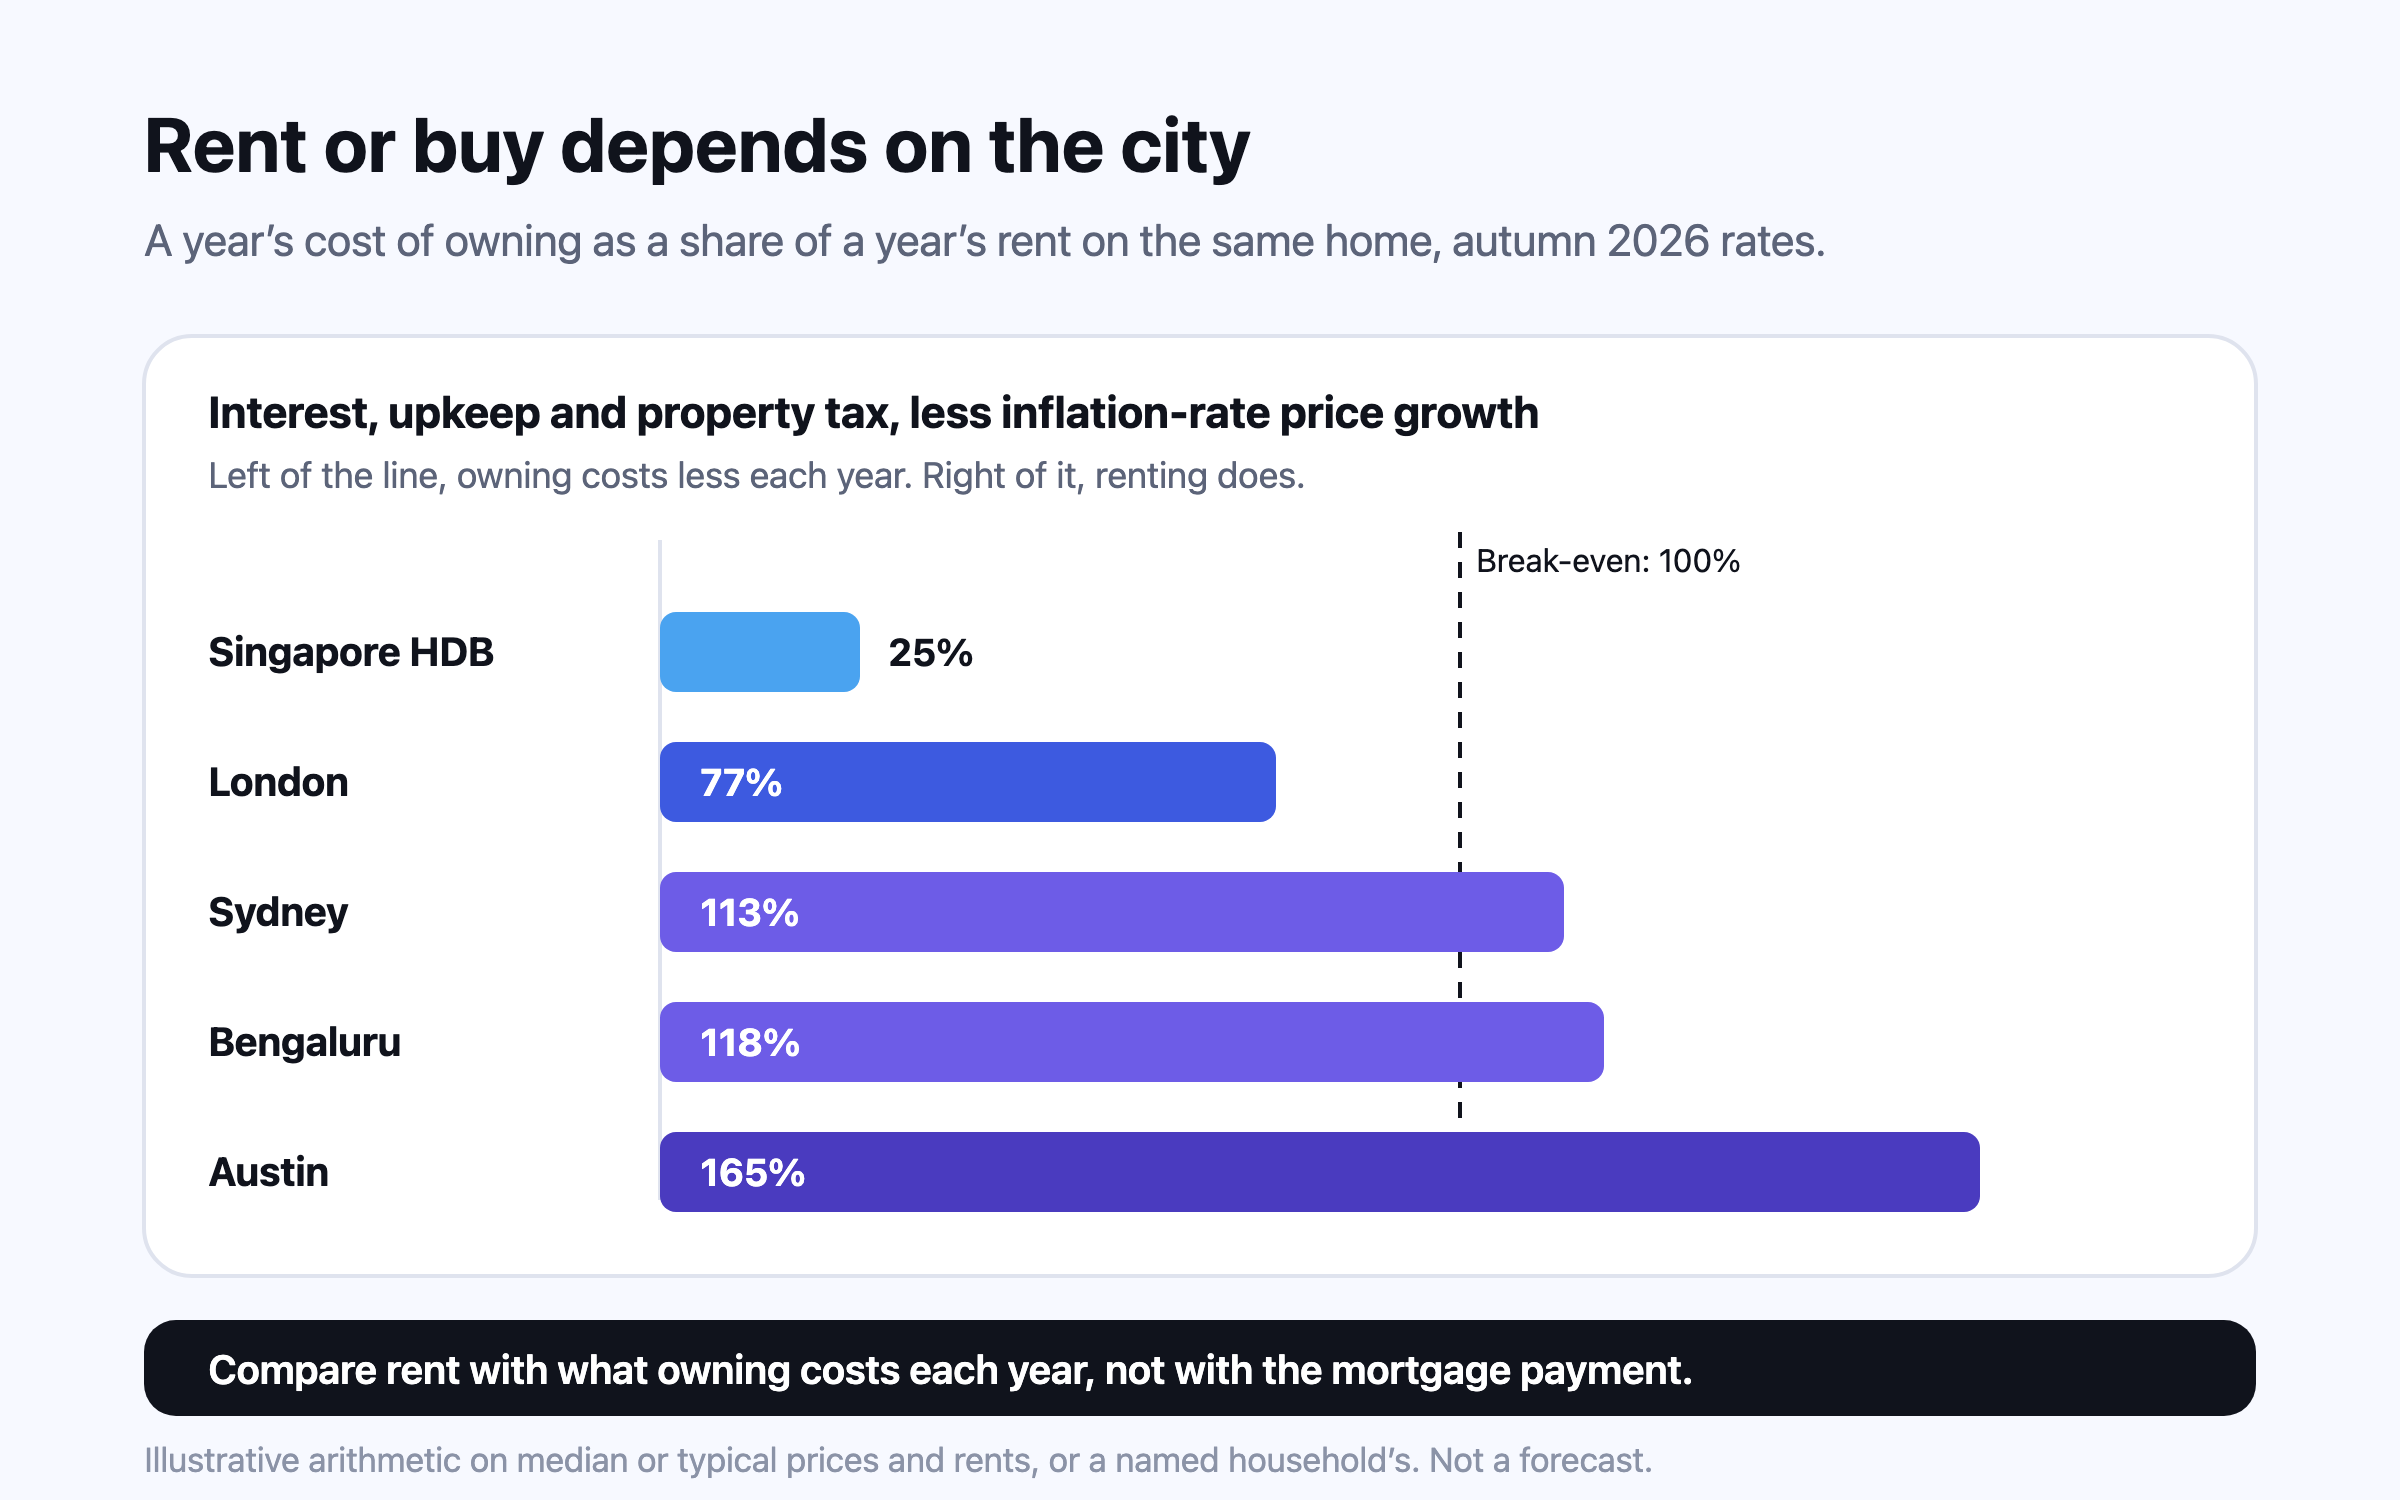
Compare rent with the unrecoverable cost of owning — interest, upkeep, property tax and the return your deposit gives up, less expected price growth — not with the mortgage payment. At autumn 2026 rates, owning the average London home costs somewhat less than renting it, an Austin home costs far more to own than to rent, and an HDB flat in Singapore costs far less. Transfer taxes then decide how long you must stay.
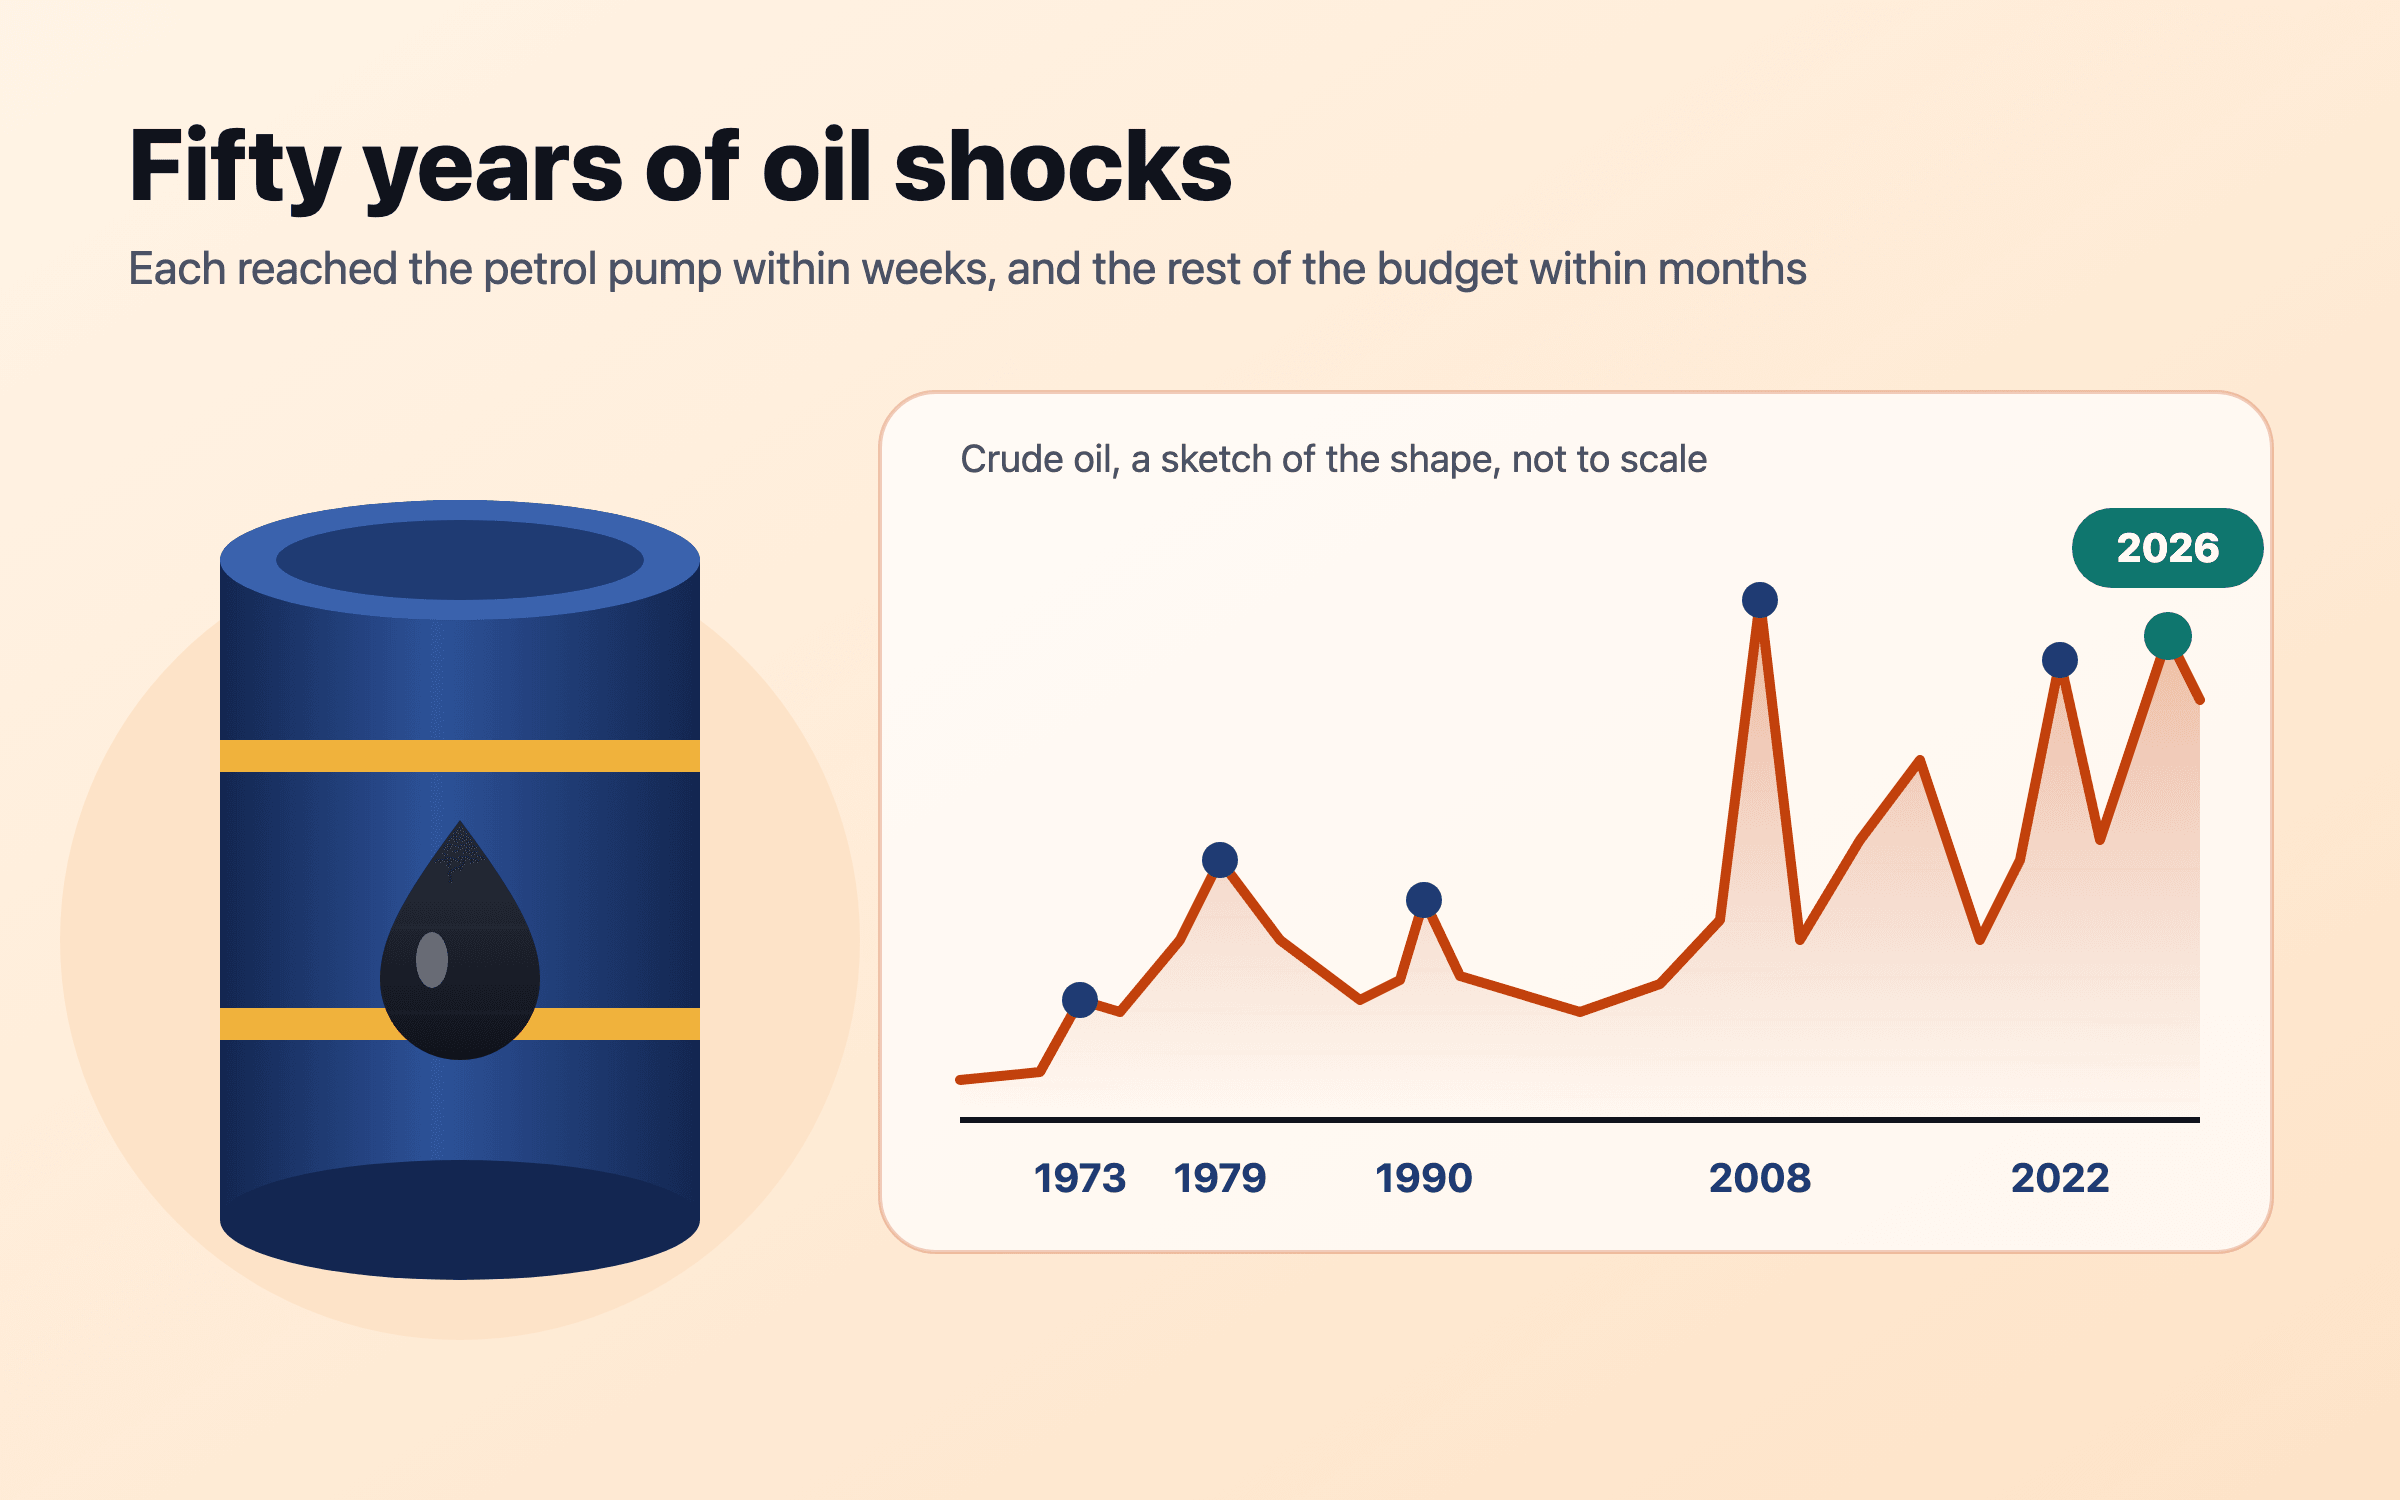
When conflict closed the Strait of Hormuz in 2026, Brent crude rose from $71 to a daily high of $138 within six weeks. Oil reaches a household in three rounds: at the pump within weeks, through transport and food over months, and through wages and interest rates over a year or more. The IMF’s rule of thumb is that each 10% rise adds about 0.4 points to global inflation. Importers such as India, Japan and most of Europe feel it most; the household response is a budget that separates fuel from everything else, a buffer, and a plan tested against inflation that stays higher for longer.
This is general information, not financial, tax or legal advice for your circumstances. Rules and figures change; check the official source for your country, and consult a licensed professional before making financial decisions. Projections are estimates, not predictions.