Oil has shocked household budgets five times in fifty years, and 2026 is the sixth. Here is how a dearer barrel reaches your prices, loans and plan.
When conflict closed the Strait of Hormuz in 2026, Brent crude rose from $71 to a daily high of $138 within six weeks. Oil reaches a household in three rounds: at the pump within weeks, through transport and food over months, and through wages and interest rates over a year or more. The IMF’s rule of thumb is that each 10% rise adds about 0.4 points to global inflation. Importers such as India, Japan and most of Europe feel it most; the household response is a budget that separates fuel from everything else, a buffer, and a plan tested against inflation that stays higher for longer.
Nivritee Research · 5 September 2026 · updated 15 October 2026 · 6 min read
On 28 February 2026 military action began in the Middle East and shipping through the Strait of Hormuz, which carries nearly 20% of the world’s oil, effectively stopped. Brent crude, the main international benchmark, rose from $71 a barrel on 27 February to $104 on 9 March1, and reached $138.21 on 7 April2. It fell as low as $69 on 2 July, after the United States and Iran signed an agreement in June to end the conflict3, then rose again with renewed attacks on tankers and on Saudi Arabia’s East-West pipeline, averaging $114 in September4.
Households felt it fast. US petrol prices were 34.2% higher in September 2026 than a year earlier, and energy as a whole 20.4%5. Euro-area energy prices were up 18.8%6. This article sets the 2026 shock beside the five before it, follows a dearer barrel from the oil field to a family’s bills and loans, explains why some countries are hit far harder than others, and ends with what a household can do about it.
Rise in US consumer energy prices in the year to September 2026
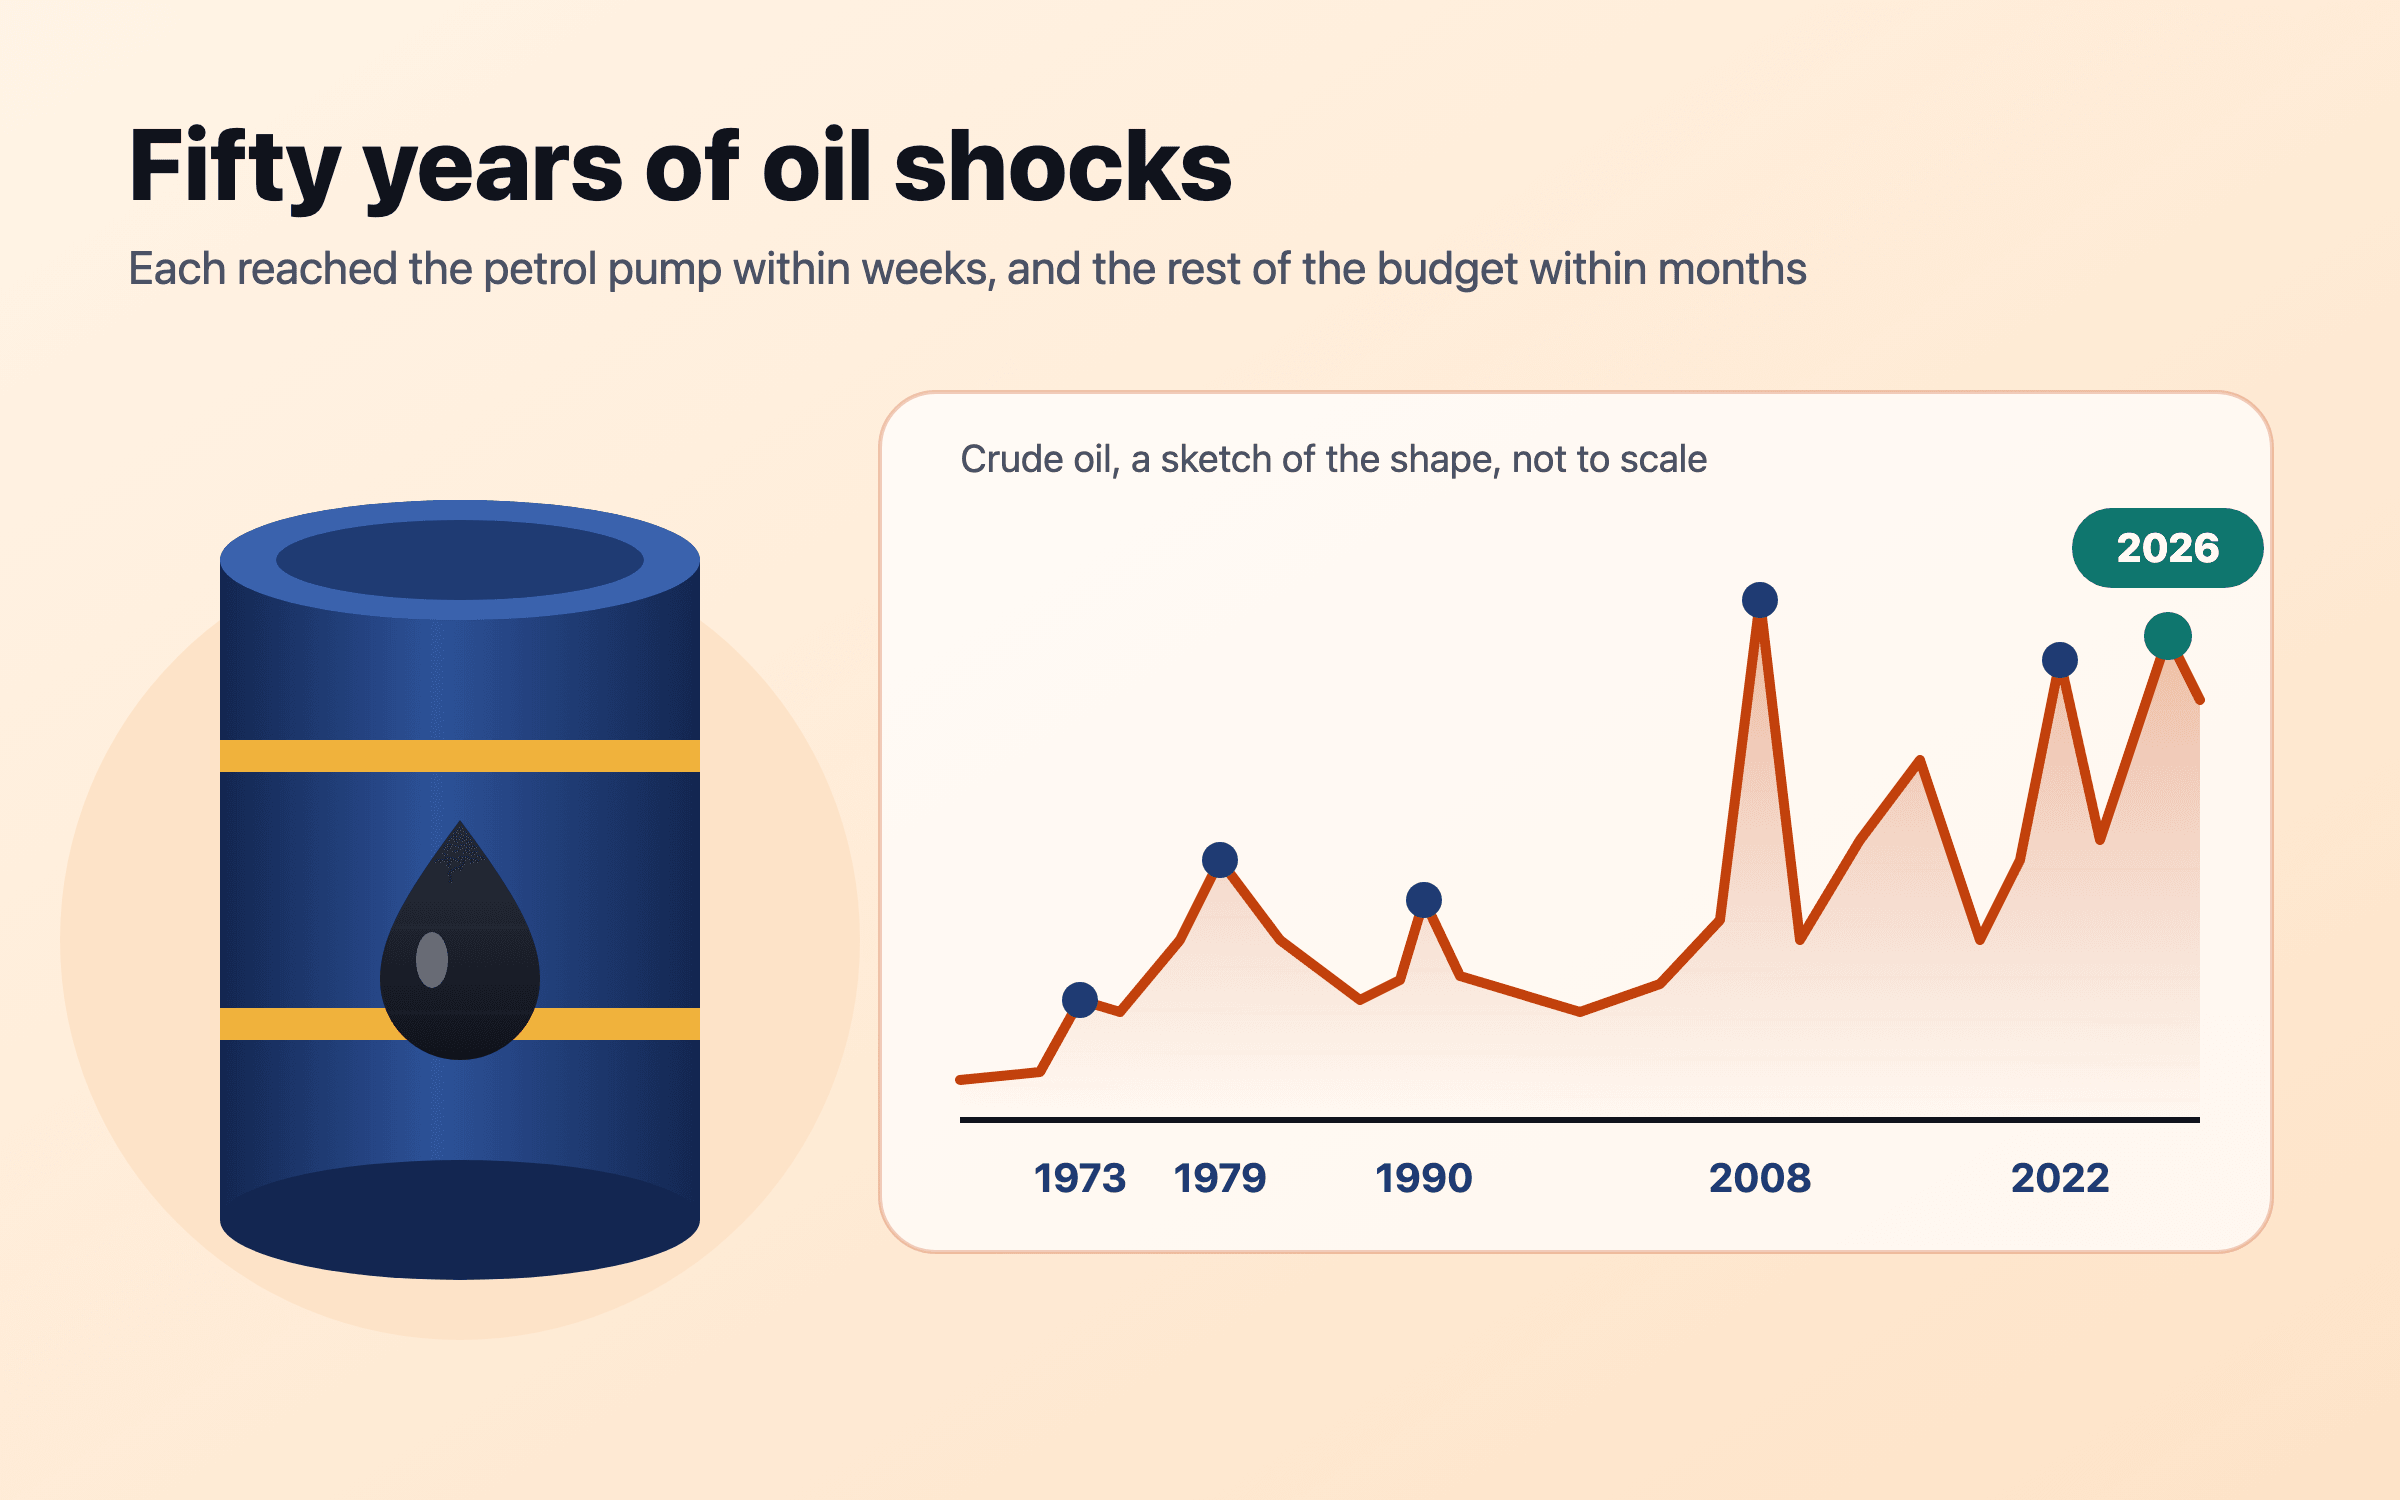
Fifty years of oil shocks
1973–74, the embargo. Arab oil producers cut supplies to countries backing Israel in the October war. The price of oil roughly quadrupled, from $2.90 a barrel before the embargo to $11.65 in January 19749.
1979–80, the Iranian revolution. Iran’s output fell by 4.8 million barrels a day, about 7% of world production, and the price more than doubled between April 1979 and April 198010.
1990, Iraq invades Kuwait. Brent averaged $17.17 in July 1990 and $36.02 in October11. The spike lasted months, not years.
2008, the demand boom. Brent reached a daily high of $143.95 on 3 July 20082, then collapsed to a December average of $39.95 as the financial crisis hit11.
2022, Russia invades Ukraine. Brent hit $133.18 on 8 March 20222 and averaged $122.71 in June11.
2026, the Gulf. The closure of the Strait of Hormuz, the $138.21 peak on 7 April, and a second surge in September2,4.
In money of the day, oil went from about $2 a barrel in 1972 to about $100 in 2022. Adjusted for inflation the story is less one-way: in constant 2010 dollars the 1980 average was $58.1, against $85.0 in 2022 and a high of $101.6 in 2012, and 2025’s average, $59.5, was about where 1980 stood12. The shocks are spikes on top of a price that rises with everything else.
Brent crude oil, yearly average price per barrel, 1972 to 2025
In US dollars of the day
In constant 2010 US dollars
World Bank commodity price data, yearly averages; the years are not evenly spaced. After inflation, 2025’s average was about where 1980’s stood. The 2026 shock is not shown as a full year: Brent averaged $93.27 from January to September on EIA’s monthly data. 12,11The figures in this chart
In US dollars of the day
In constant 2010 US dollars
1972
$1.8
$6.8
1974
$11.0
$29.2
1979
$32.1
$54.2
1980
$37.9
$58.1
1986
$14.8
$21.5
1990
$23.7
$28.6
1998
$12.7
$15.5
2003
$28.9
$36.2
2008
$97.6
$94.9
2011
$110.9
$99.9
2016
$44.0
$46.8
2020
$42.3
$43.2
2022
$99.8
$85.0
2025
$69.0
$59.5
Measured from the month before each shock to its peak month, the jumps differ more than the headlines suggest. Brent rose about 110% in 1990, 44% in 2008, and 65% both in 2022 and in 202611. The 1973 embargo, measured on the posted price, was a rise of about 302%9.
How far oil rose in each shock, from before it began to its peak
Monthly Brent averages from the EIA for 1990 onwards; the 1973–74 figure compares the posted price before the embargo with January 1974, so it is not measured the same way. The later shocks are smaller in percentage terms but start from much higher prices. 11,9The figures in this chart
Rise in the oil price
1973–74 embargo (posted price)
302%
1990: July to October
110%
2008: January to July
44%
2022: December 2021 to June
65%
2026: February to April
65%
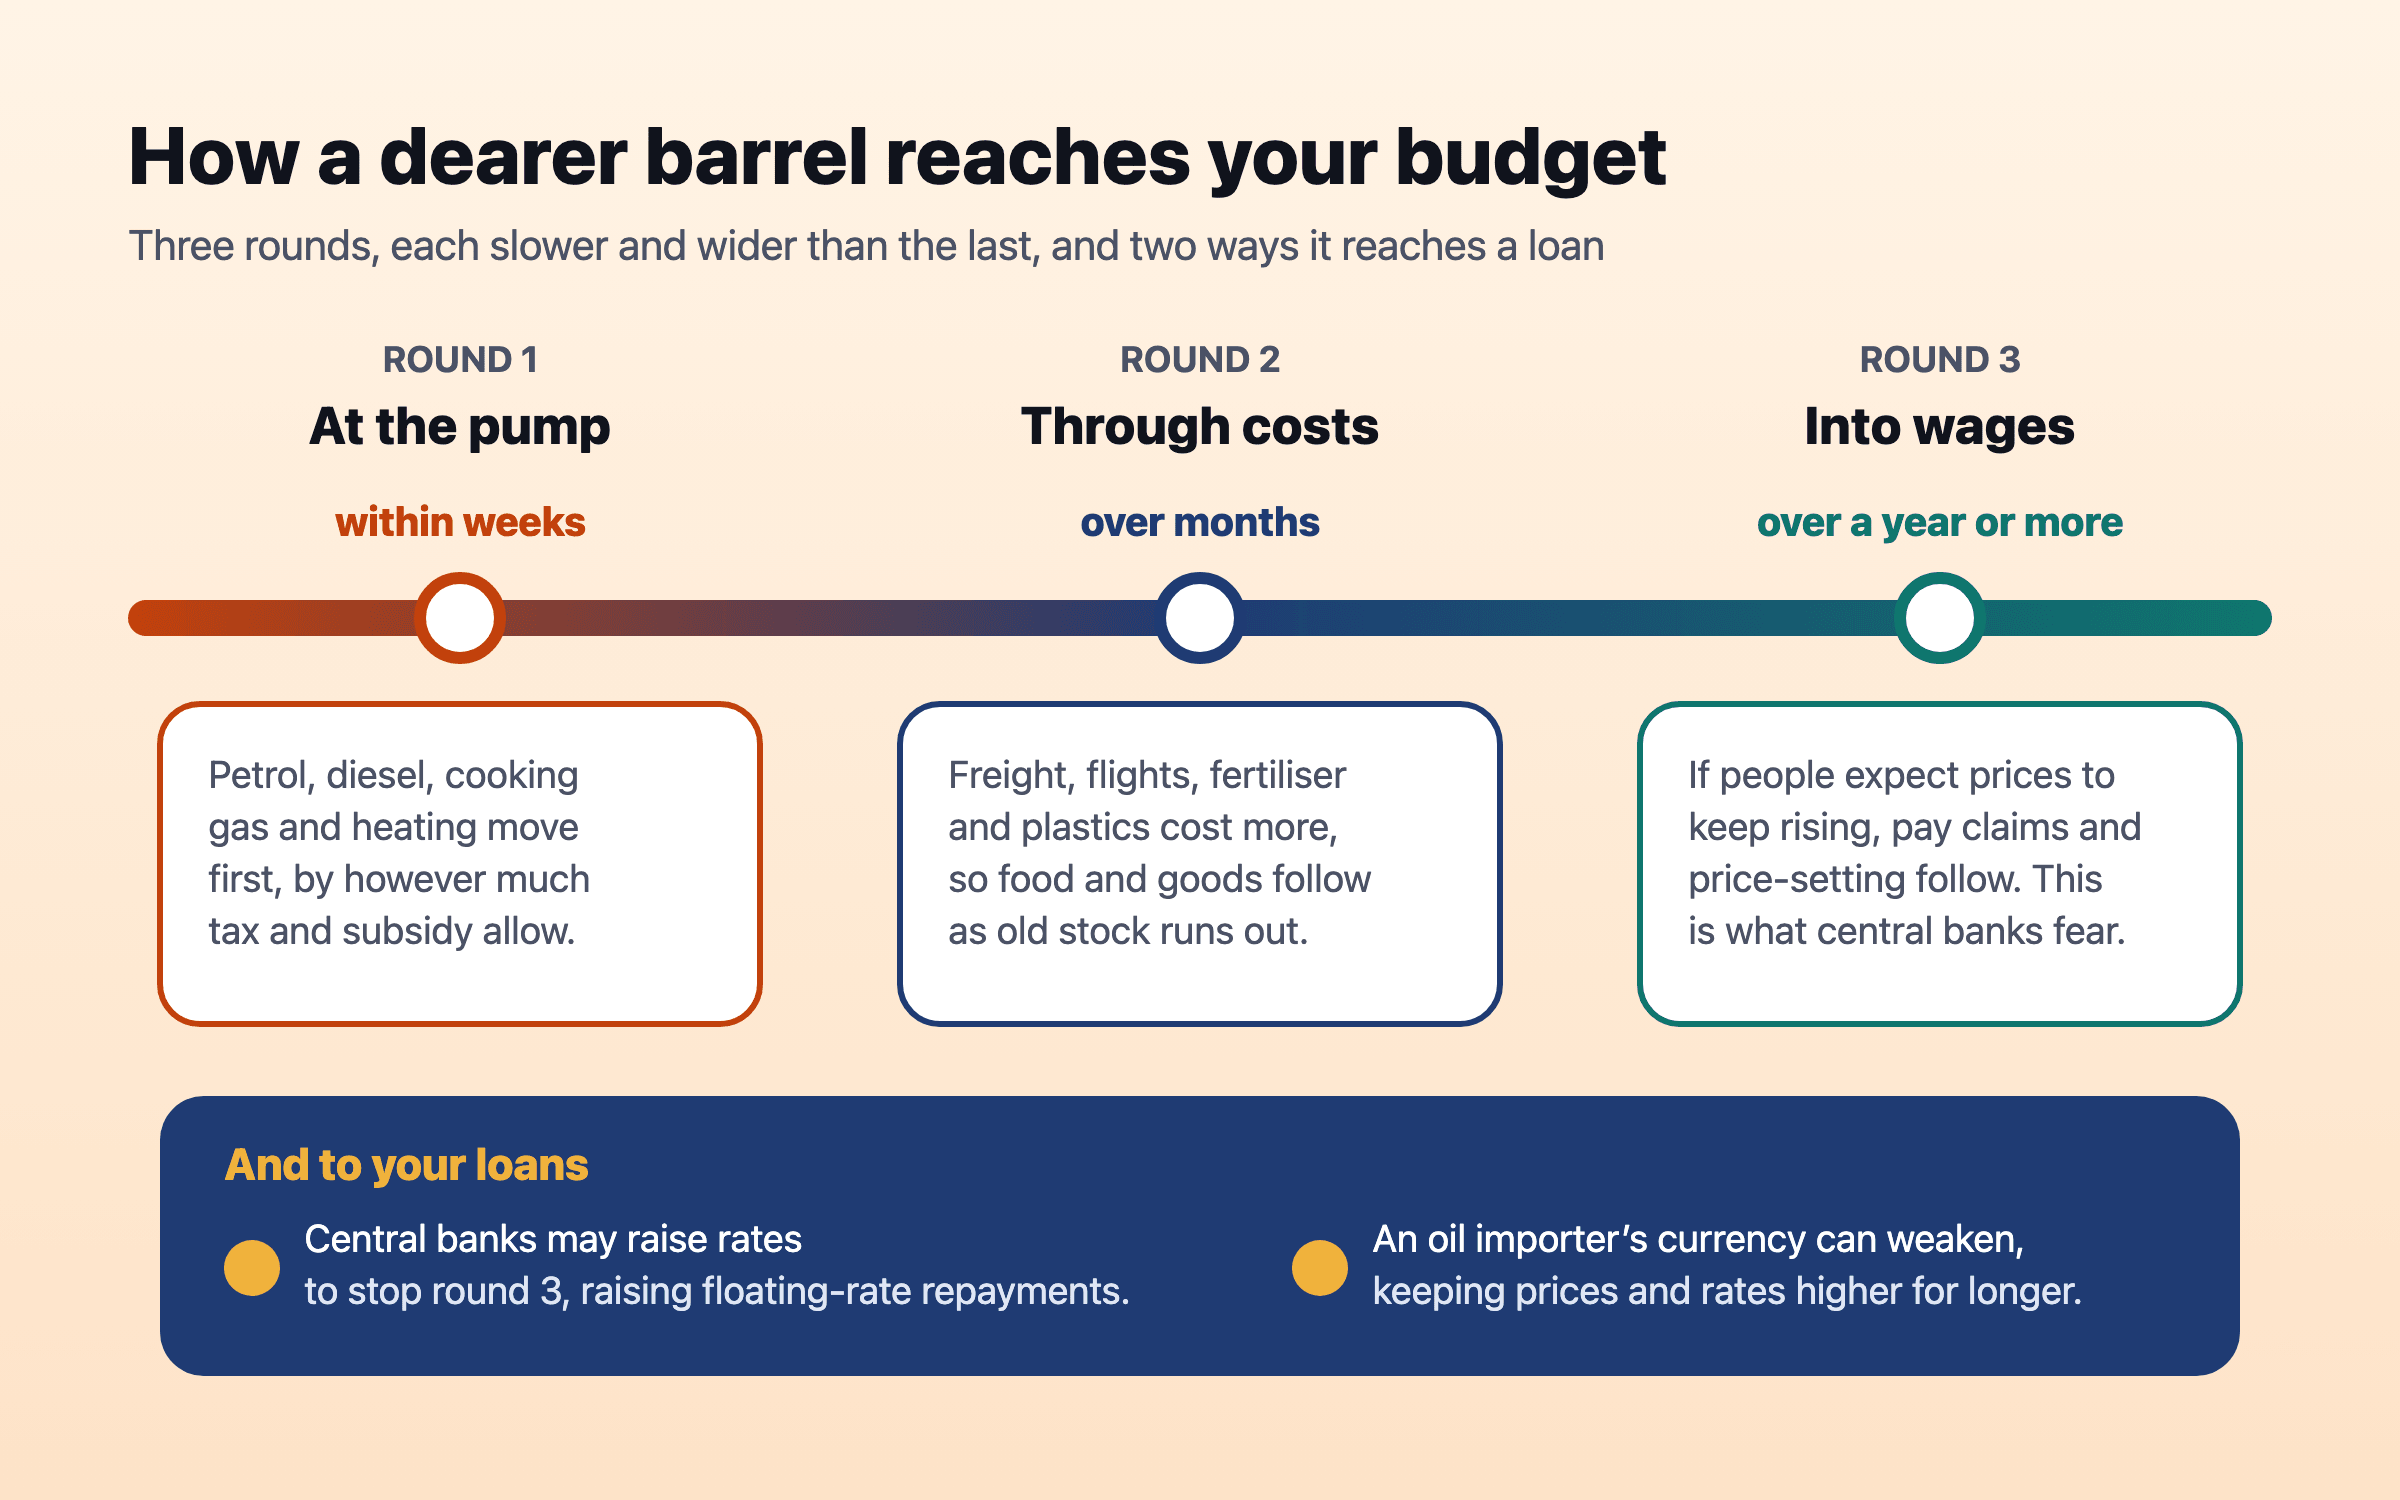
How a dearer barrel reaches your budget
Each round is slower and wider than the last. The third is the one central banks act to stop, which is how an oil shock reaches a loan.
Round one: the pump. Crude was 51.4% of the US price of a gallon of petrol in 2025; refining, distribution and taxes made up the rest13. Where taxes are a larger share, a crude rise moves the pump price by less in percentage terms. In Delhi on 1 September 2026 a litre of petrol cost ₹102.12, of which state VAT alone was ₹16.598. Some governments also cut duties or subsidise fuel in a shock, which delays the pass-through rather than cancelling it.
Round two: everything that moves. Diesel, jet fuel, fertiliser and plastics all rise, so freight, flights and food follow over the following months as old stock is sold through. Energy is 7.418% of the US consumer price basket and petrol alone 3.853%14, but its effect is larger than its weight because it is a cost inside almost every other item. The IMF’s rule of thumb is that each 10% rise in oil that lasts through most of a year adds about 0.4 percentage points to global headline inflation and takes 0.1–0.2% off world output7.
Round three: wages and expectations. If people come to expect prices to keep rising, pay claims and price-setting follow, and a one-off jump turns into lasting inflation. That is what happened in the 1970s and what central banks act to prevent. US consumer prices were 3.7% higher in September 2026 than a year before5; euro-area inflation was 3.8%6.
Importers and exporters feel it differently
India met 88.7% of its crude oil needs from imports in 2025–26 and spent $123.4 billion on them8. In April to August 2026 the crude import bill was $74.8 billion against $50.4 billion a year earlier, about 48% more, on slightly lower volumes8. The Indian basket of crude averaged $90.19 a barrel in August 2026, against $69.11 a year earlier8, and Brent rose by another $23 in September4. A larger import bill also weighs on the rupee, which makes the next shipment dearer again; this is the second line in the diagram above. Japan and most of Europe, which produce little oil of their own, sit in a similar position.
Malaysia sits in between: it produces oil and gas but its households pay for fuel. Bank Negara Malaysia kept its policy rate at 2.75% in September 2026, with headline inflation averaging 1.8% in the first seven months, but said inflation was expected to stay elevated as energy costs passed through to consumer prices with a lag15.
Exporters such as the Gulf states, Norway and Canada earn more when oil rises, which supports government budgets and, in Canada and Norway, often the currency. For an Indian family working in Dubai the effect is mixed: the Gulf economy may be stronger, but money sent home buys a costlier tank of petrol in India, and a conflict in the region can threaten the job itself. See money across countries for how currency and location interact in a plan.
Why oil shocks reach your loans
Central banks cannot make oil cheaper, but they can try to stop round three. In 1979–81 the Federal Reserve under Paul Volcker raised its policy rate from 11% to a peak of 19% in 1981, and the US went into its most severe recession since the Great Depression10. In July 2008, with oil near its peak, the European Central Bank raised its main rate to 4.25%16, weeks before the financial crisis forced it into reverse.
In 2026 the pattern repeated, more gently. The ECB raised its deposit rate from 2.00% to 2.25% from 17 June and to 2.50% from 16 September16. The Federal Reserve raised its target range by a quarter point to 3.75–4.00% in September17. The Reserve Bank of India raised its repo rate by 25 basis points to 5.50% on 7 October, moving to a stance of “calibrated tightening”, and projected inflation of 5.2% for 2026–2718. For a household with a floating-rate home loan, an oil shock can therefore arrive twice: at the pump, and months later in the repayment. Interest rates and your money explains how a rate change reaches a mortgage, an EMI or a deposit.
What a household can do
Separate fuel from everything else. Fuel and utilities move first and most; food and transport follow. A budget that keeps these on their own lines shows the shock as it arrives instead of as a vague squeeze.
Do not extrapolate the price. Brent fell from $138.21 in April 2026 to as low as $69 on 2 July, then rose again2,3,4. Long-term decisions, such as a car or a heating system, are better made on what you expect over years than on this month’s price.
Check your loans. Know which of your borrowings are floating and what a quarter- or half-point rise would add to the payment. If rates rise, that is the line that changes next.
Keep the buffer topped up. An oil shock can cost a job in an exposed industry, airlines and transport among them, as well as raise bills. Months of essential spending in cash is what lets you wait rather than sell; see how big an emergency fund should be.
Test the plan against inflation that stays higher. Prices do not fall back after a shock; they rise more slowly from the new level, as the inflation of 2021 to 2026 showed. A plan that still works if inflation runs several points higher for some years needs no forecast of oil.
How Nivritee helps
This explains how oil shocks reach household finances, using published data to October 2026. It does not forecast oil prices or recommend any investment. This is information, not financial advice.
Questions people ask
How do oil prices affect inflation?
Directly through fuel and heating, then through transport, food and goods. The IMF’s rule of thumb is that a lasting 10% rise in oil adds about 0.4 percentage points to global headline inflation7.
Why did oil prices rise in 2026?
Military action in the Middle East from 28 February effectively closed the Strait of Hormuz, which carries nearly 20% of global oil supply1. Brent peaked at $138.21 on 7 April and surged again in September after pipeline attacks2,4.
What was the highest oil price ever?
On EIA’s daily Brent spot series the high is $143.95 on 3 July 20082. The 2026 daily high, $138.21 on 7 April, came close2. Adjusted for inflation, the highest yearly average on the World Bank’s series is 2012’s, $101.6 in 2010 dollars, against $94.9 for 2008 and $58.1 for 198012.
How much oil does India import?
India met 88.7% of its crude oil needs from imports in 2025–26, at a cost of $123.4 billion8.
Do interest rates go up when oil prices rise?
Often, if central banks fear lasting inflation. In 2026 the ECB, the Federal Reserve and the Reserve Bank of India all raised rates as energy prices pushed inflation up16,17,18.
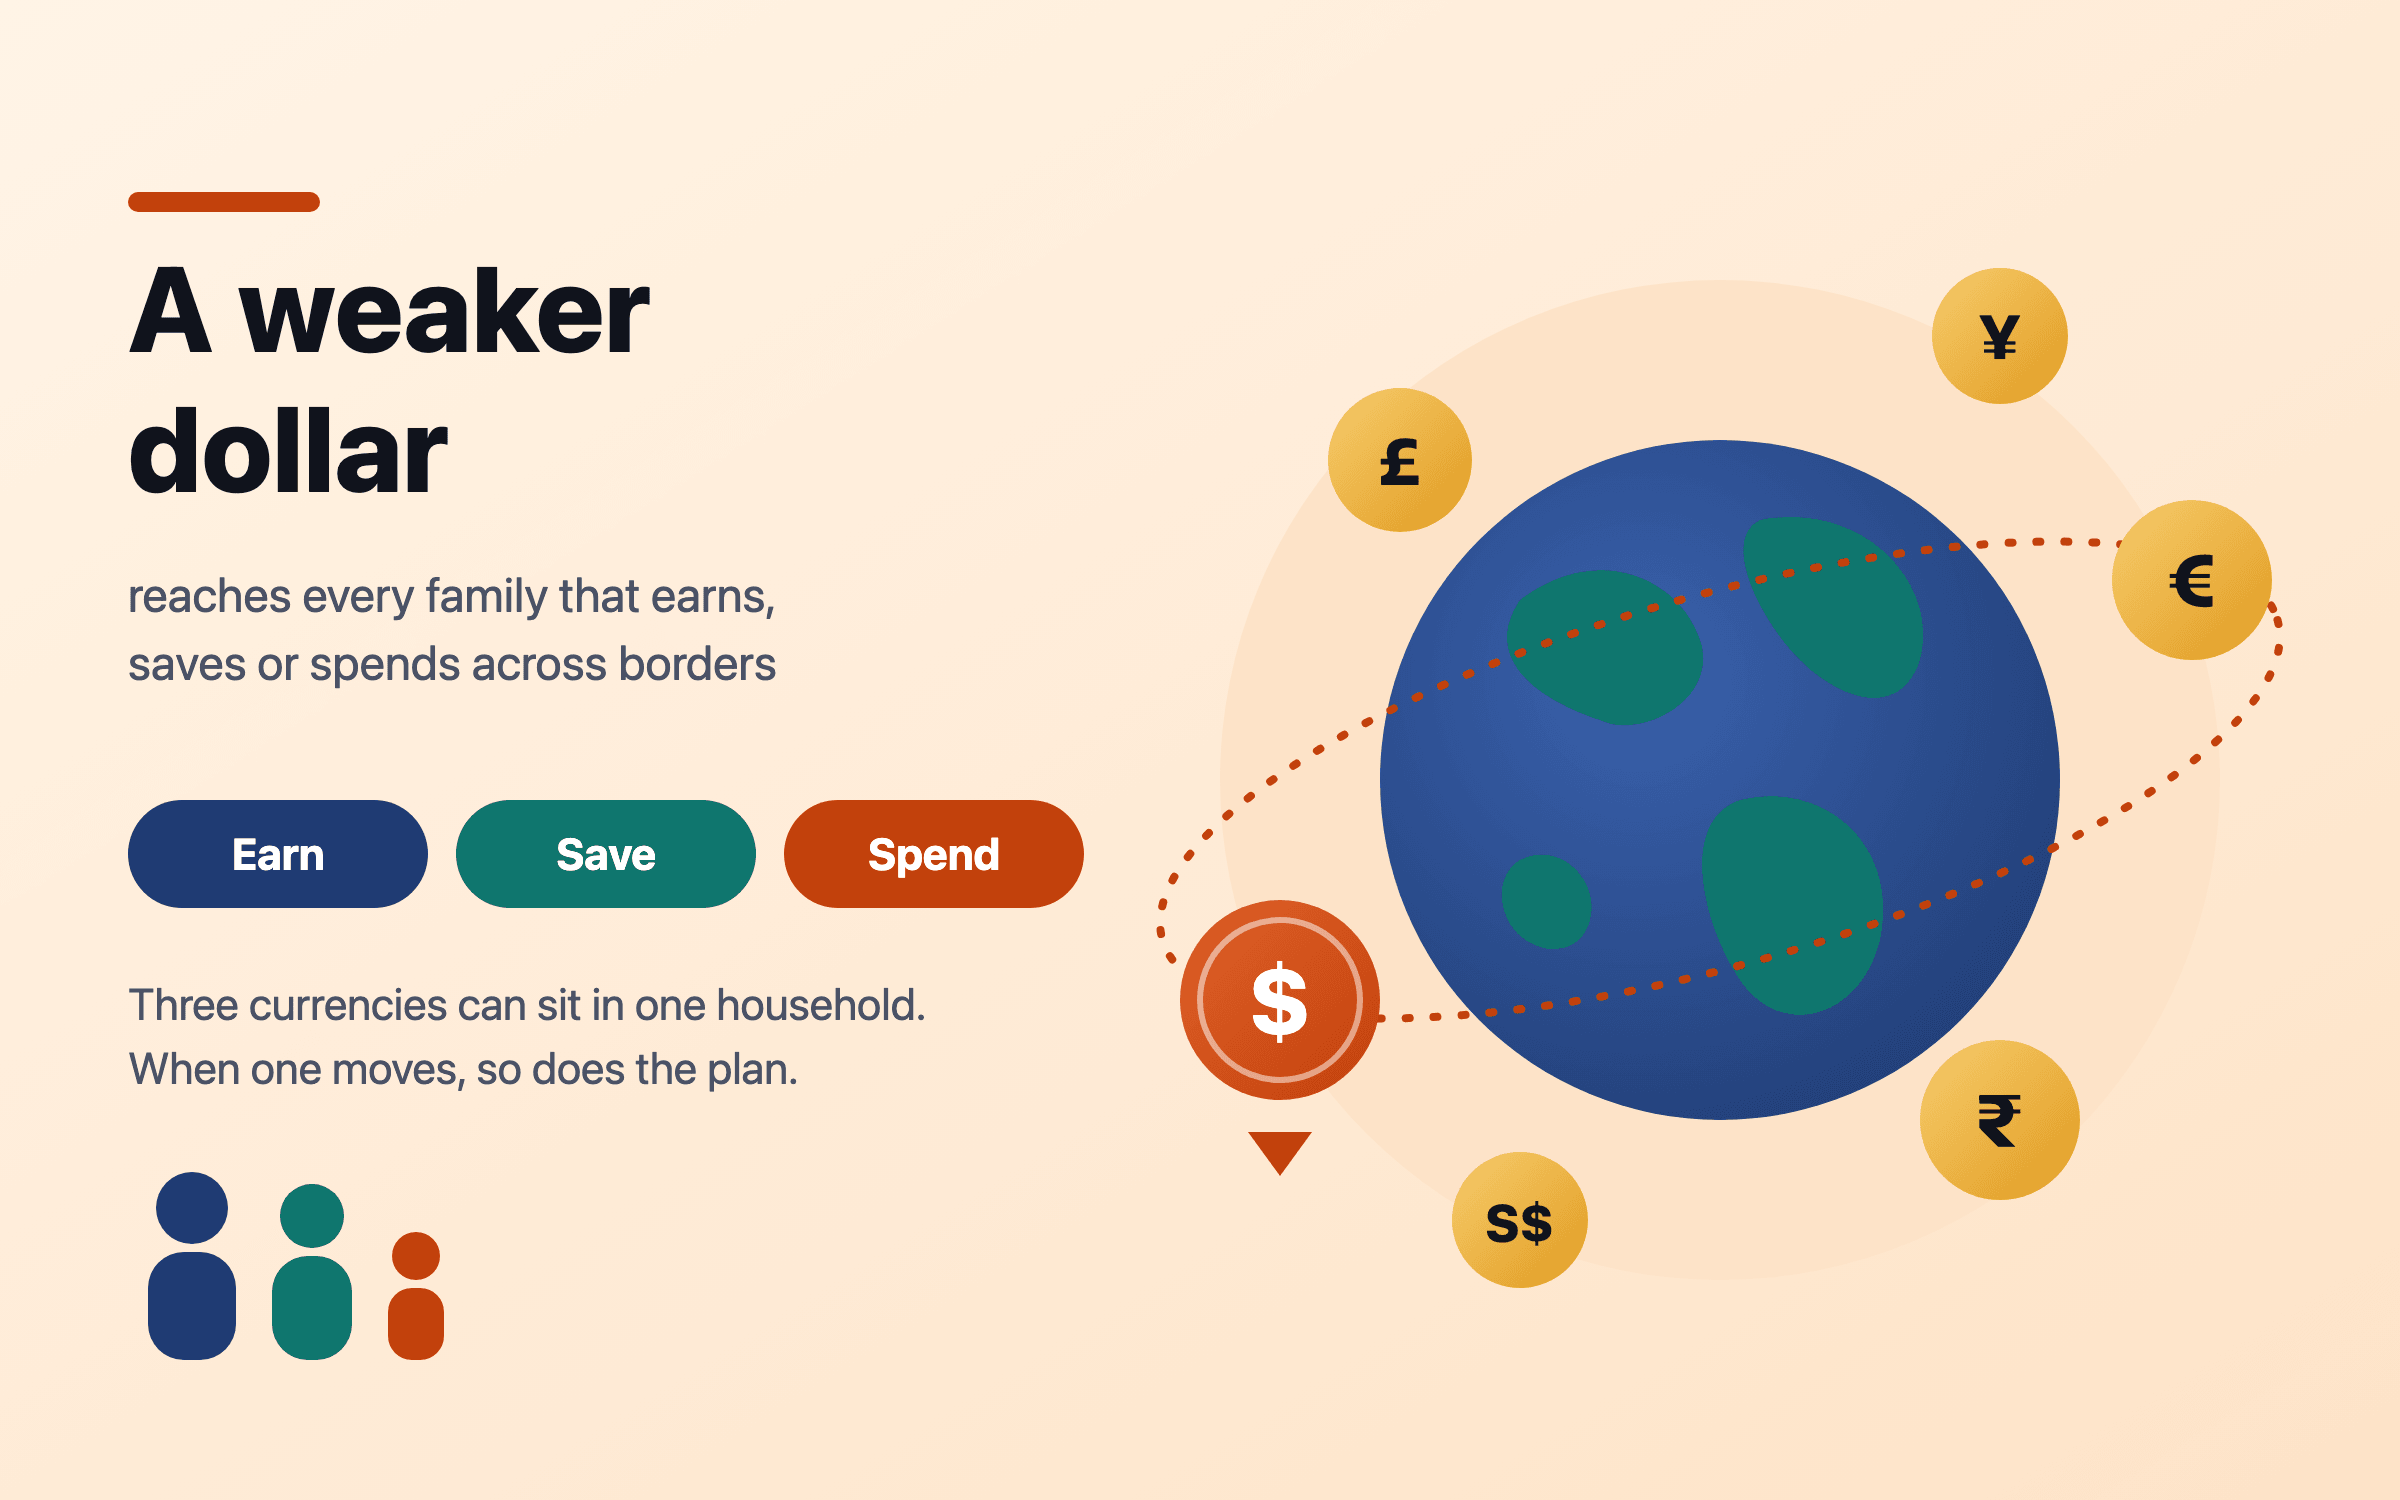
The US dollar index fell 10.8% in the first half of 2025, its worst start to a year since 1973, and the Fed’s broad dollar index ended 2025 down 7.4%. In 2026 the dollar steadied, and the rupee fell to record lows near 97 as oil surged. The same S&P 500 returned 16.4% in dollars in 2025, 2.7% in euros and 22.2% in rupees. What matters for a family is not which way the dollar moves but whether its savings are in the currency it will spend.
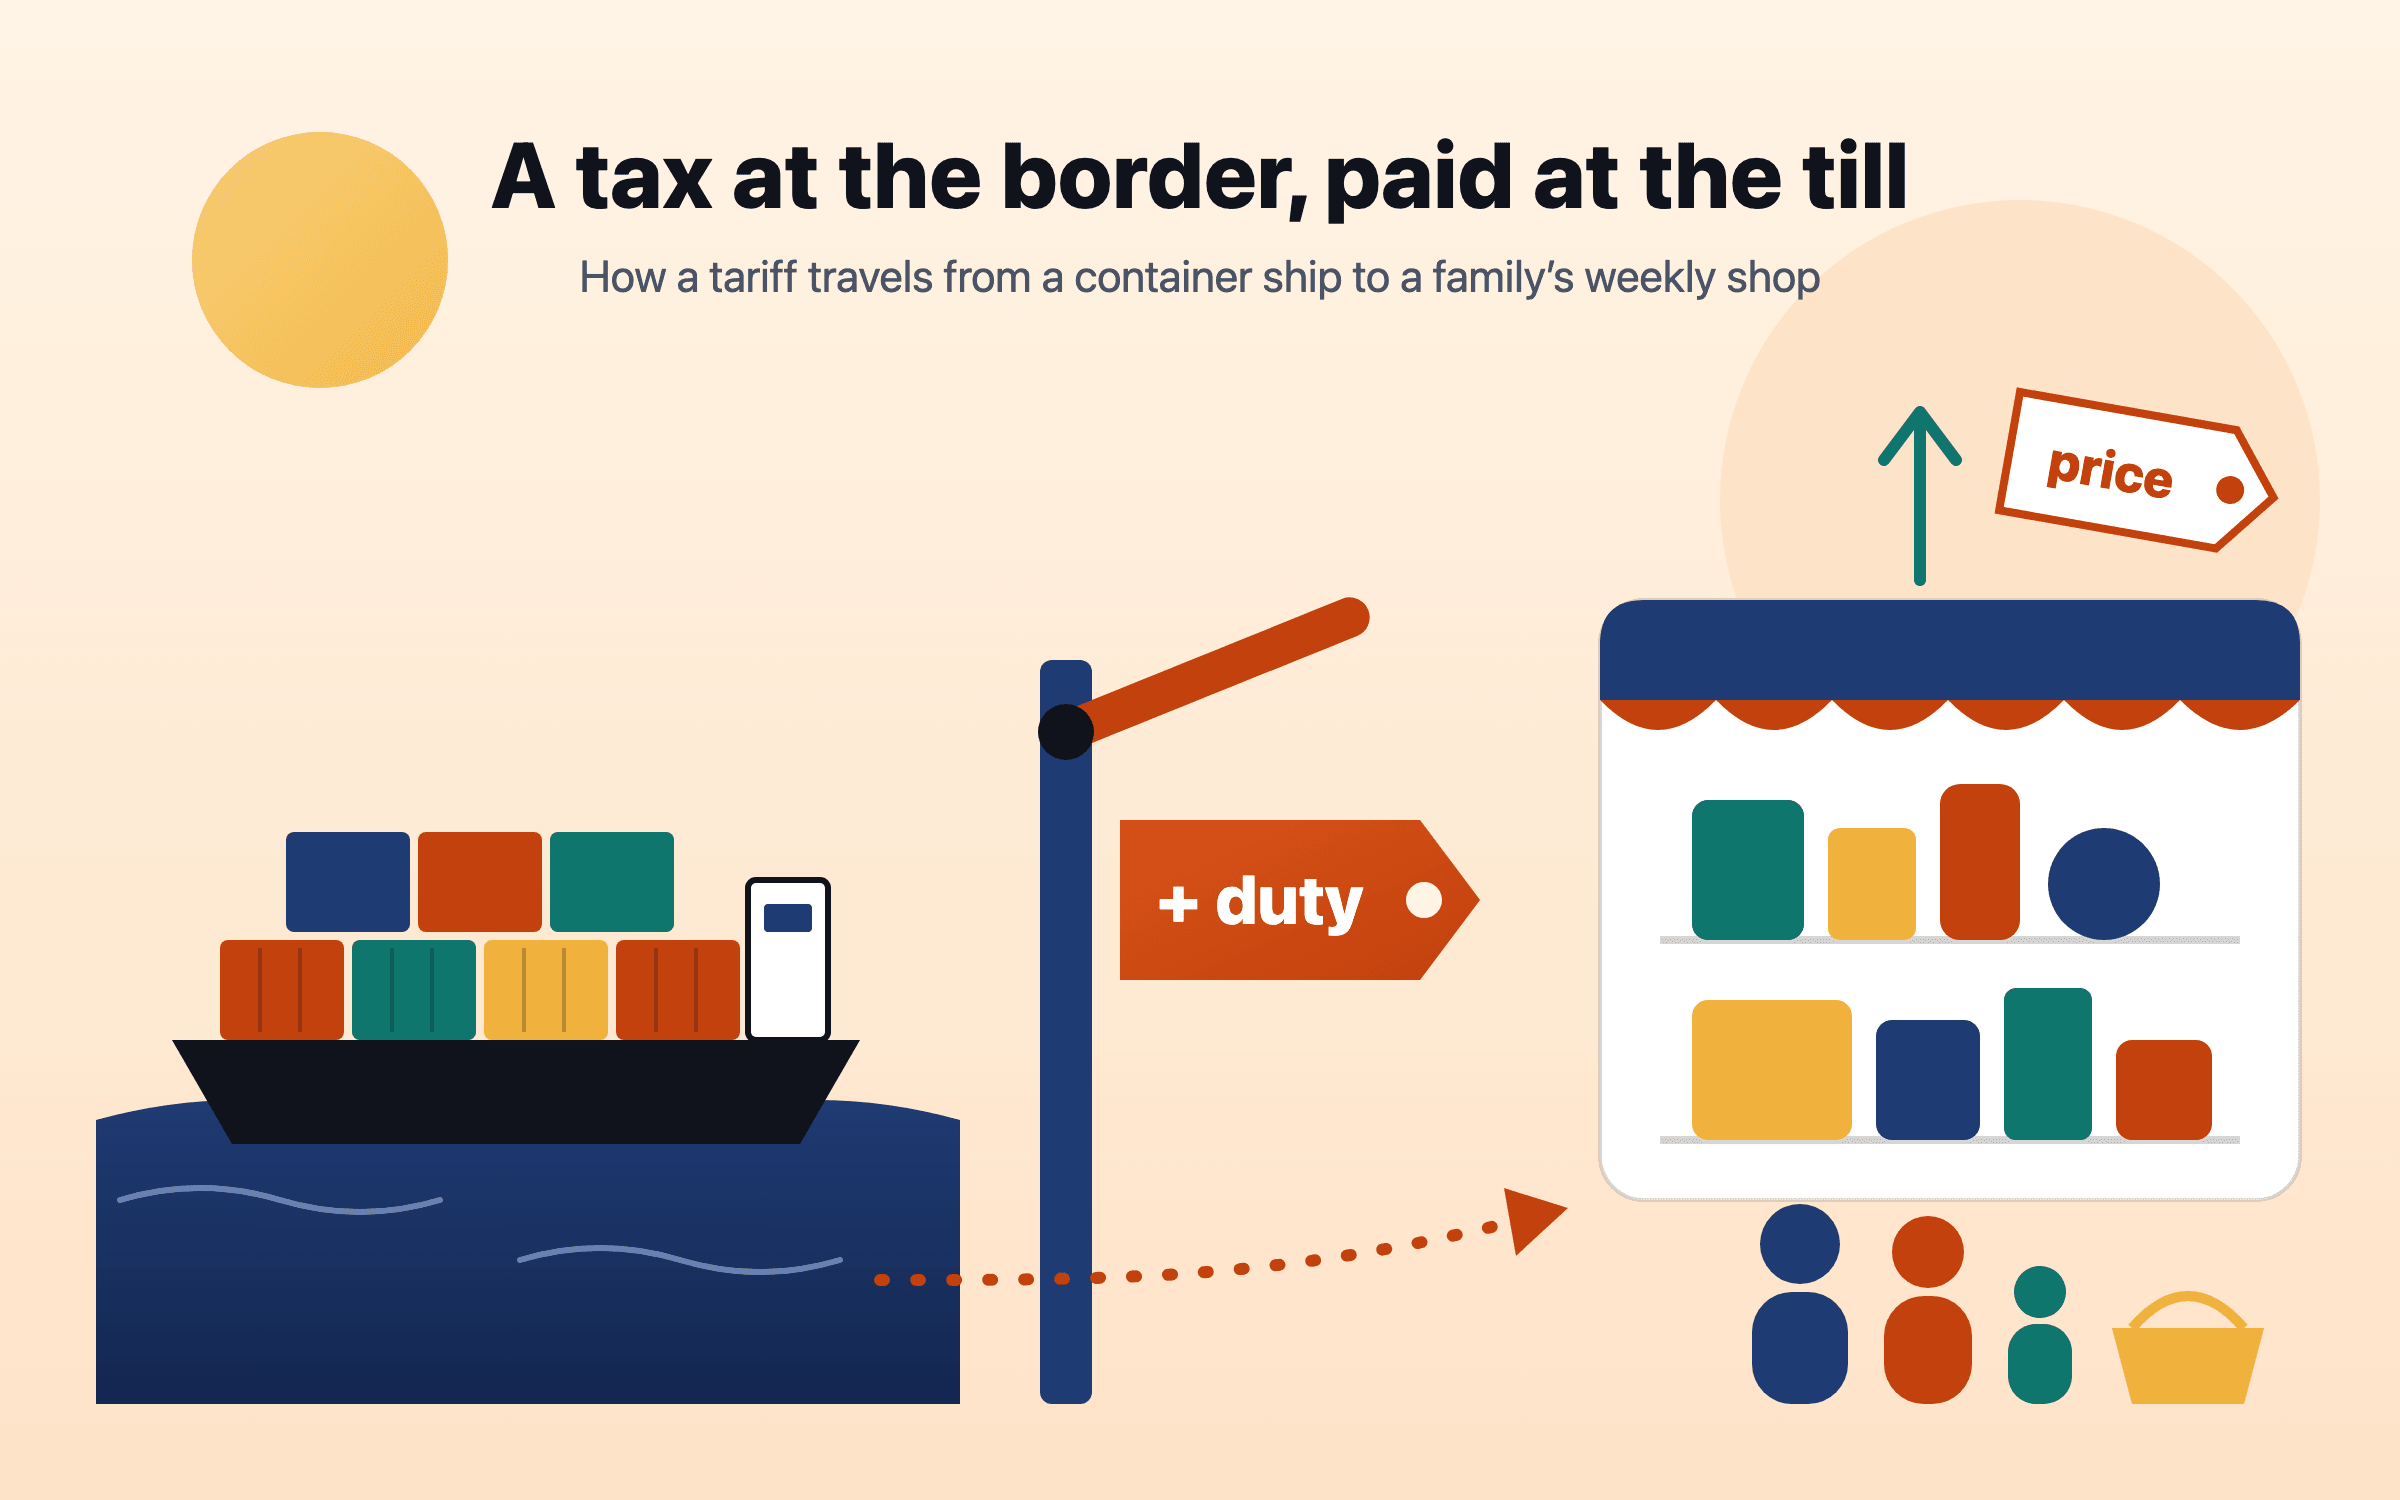
US tariffs rose in 2025 to their highest average level in about ninety years, were cut back by a Supreme Court ruling in February 2026, and were rebuilt under other laws. Research finds the cost lands mostly on buyers in the importing country, spread across importers, shops and households; Yale’s Budget Lab puts it at about $1,100 a year for the average US household. Elsewhere the effect arrives through export orders, jobs, markets and interest rates. The useful response is a budget that knows which costs are rising, a cash buffer sized to your job’s exposure, and no trading on headlines.
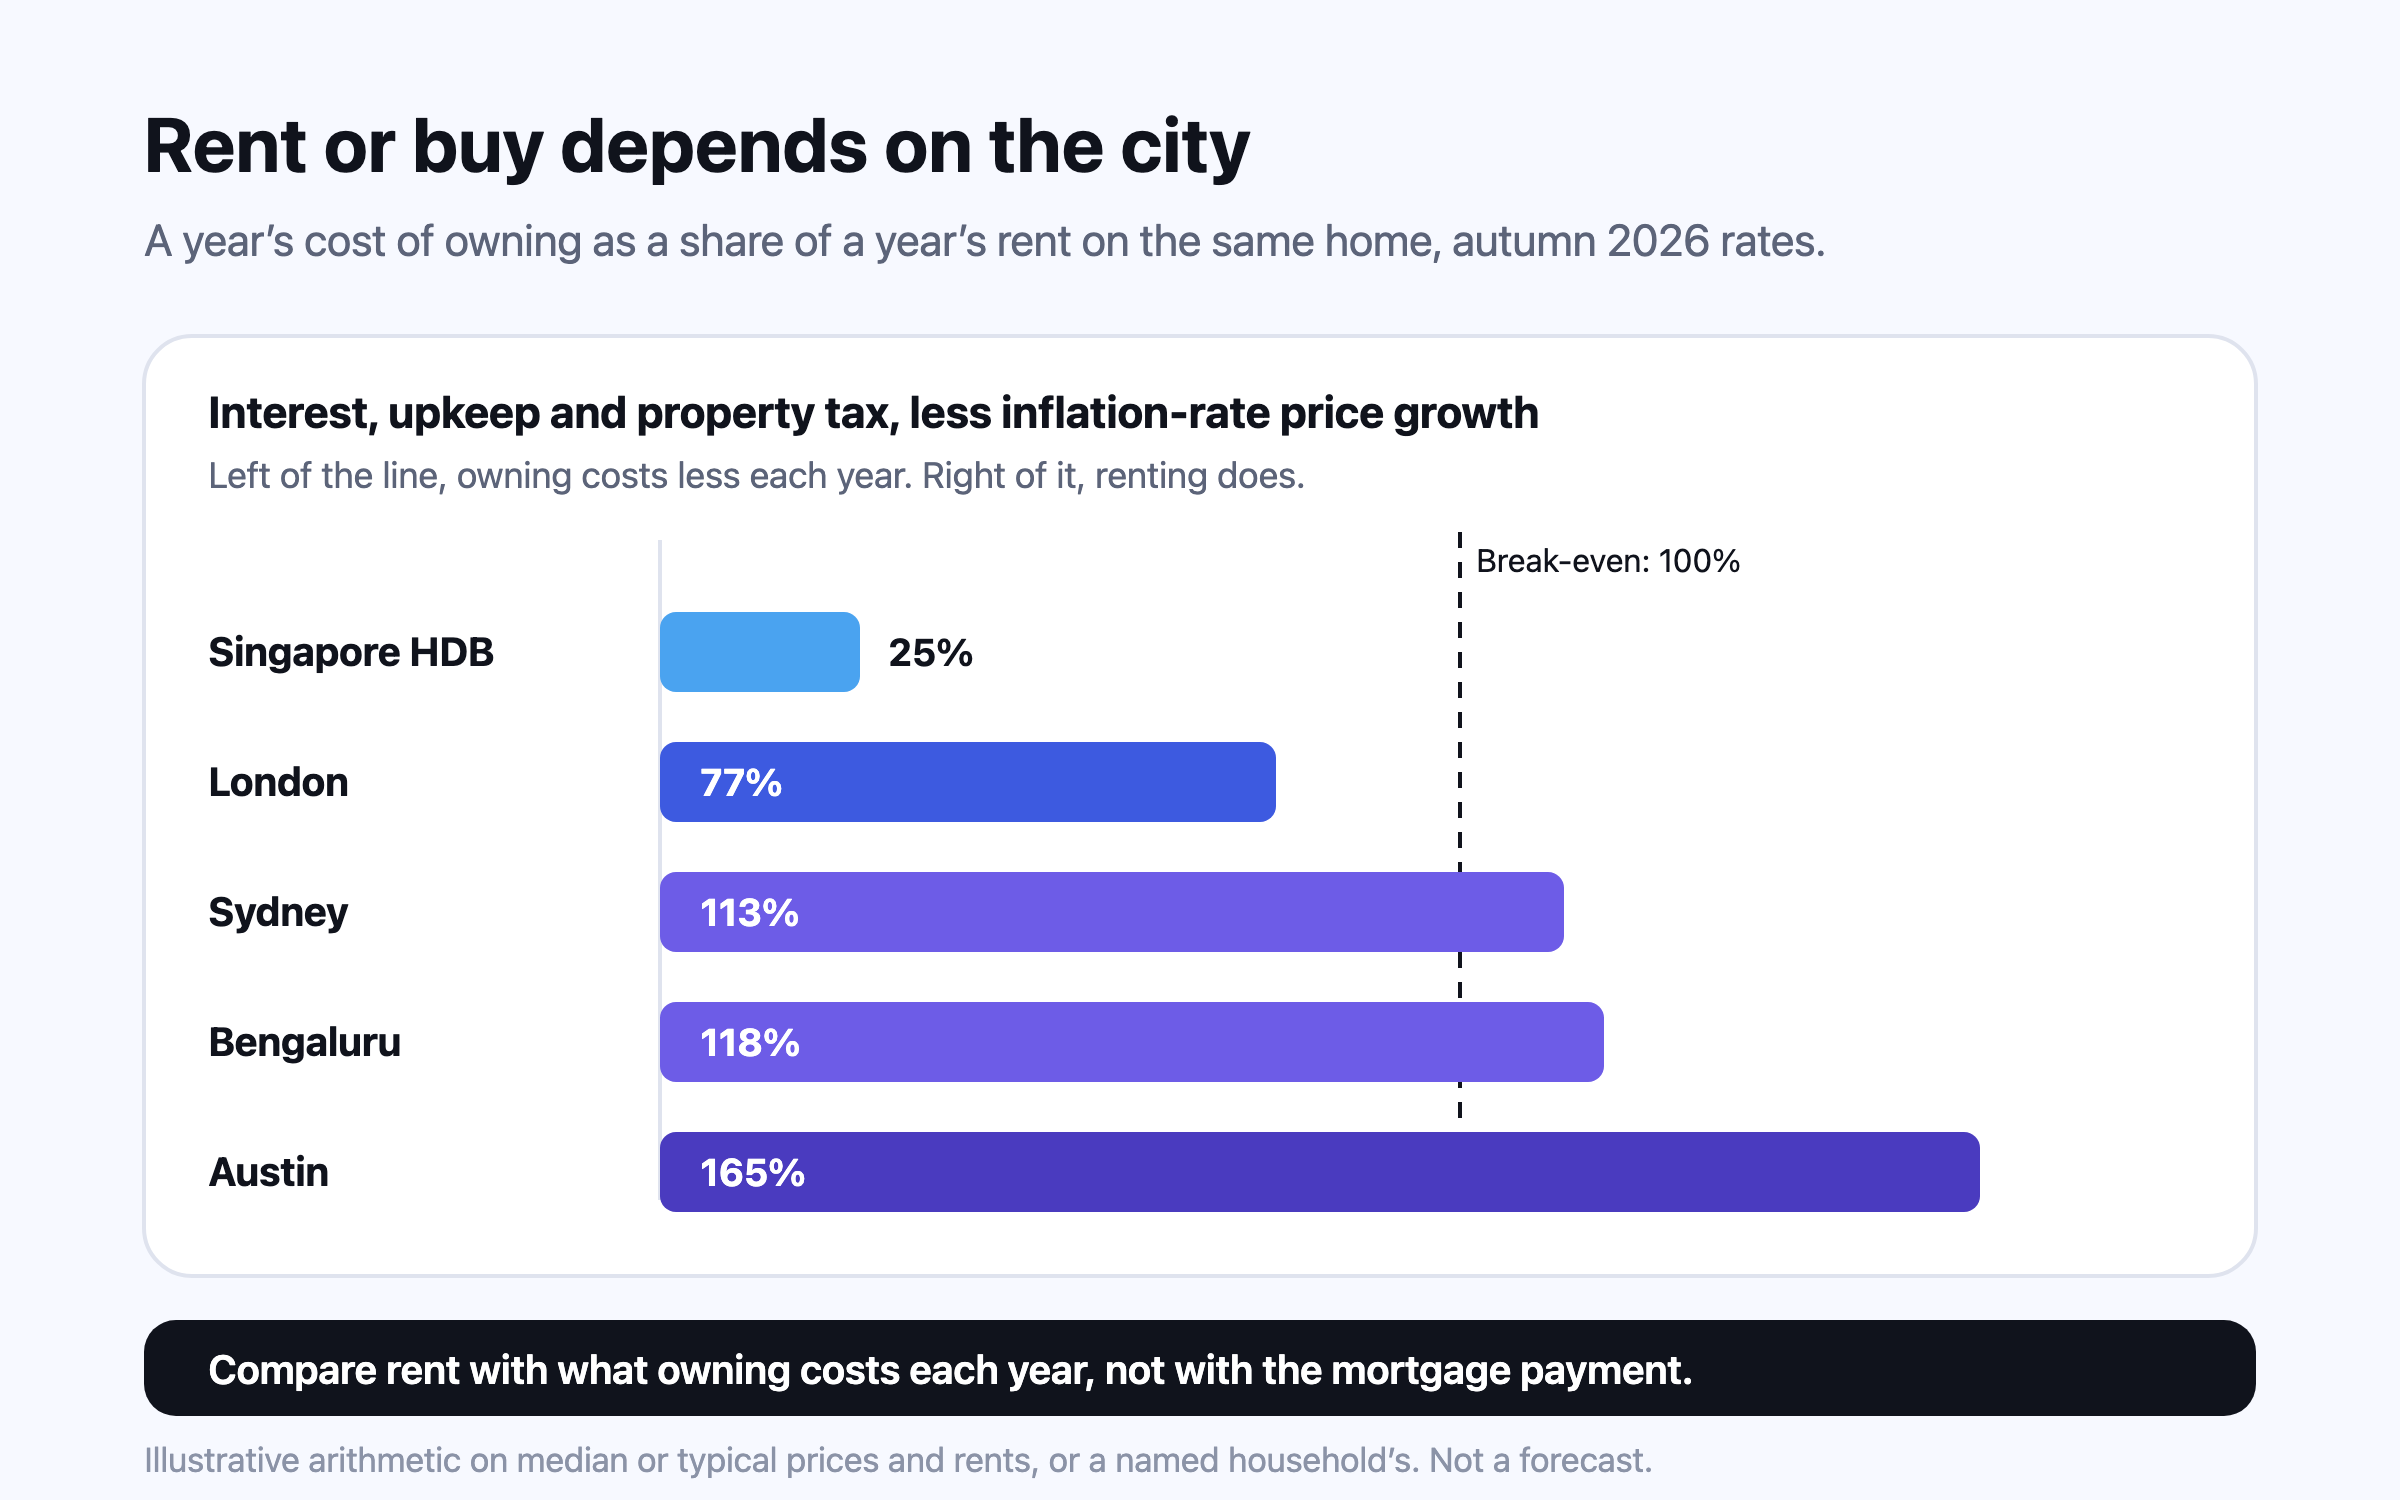
Compare rent with the unrecoverable cost of owning — interest, upkeep, property tax and the return your deposit gives up, less expected price growth — not with the mortgage payment. At autumn 2026 rates, owning the average London home costs somewhat less than renting it, an Austin home costs far more to own than to rent, and an HDB flat in Singapore costs far less. Transfer taxes then decide how long you must stay.
This is general information, not financial, tax or legal advice for your circumstances. Rules and figures change; check the official source for your country, and consult a licensed professional before making financial decisions. Projections are estimates, not predictions.