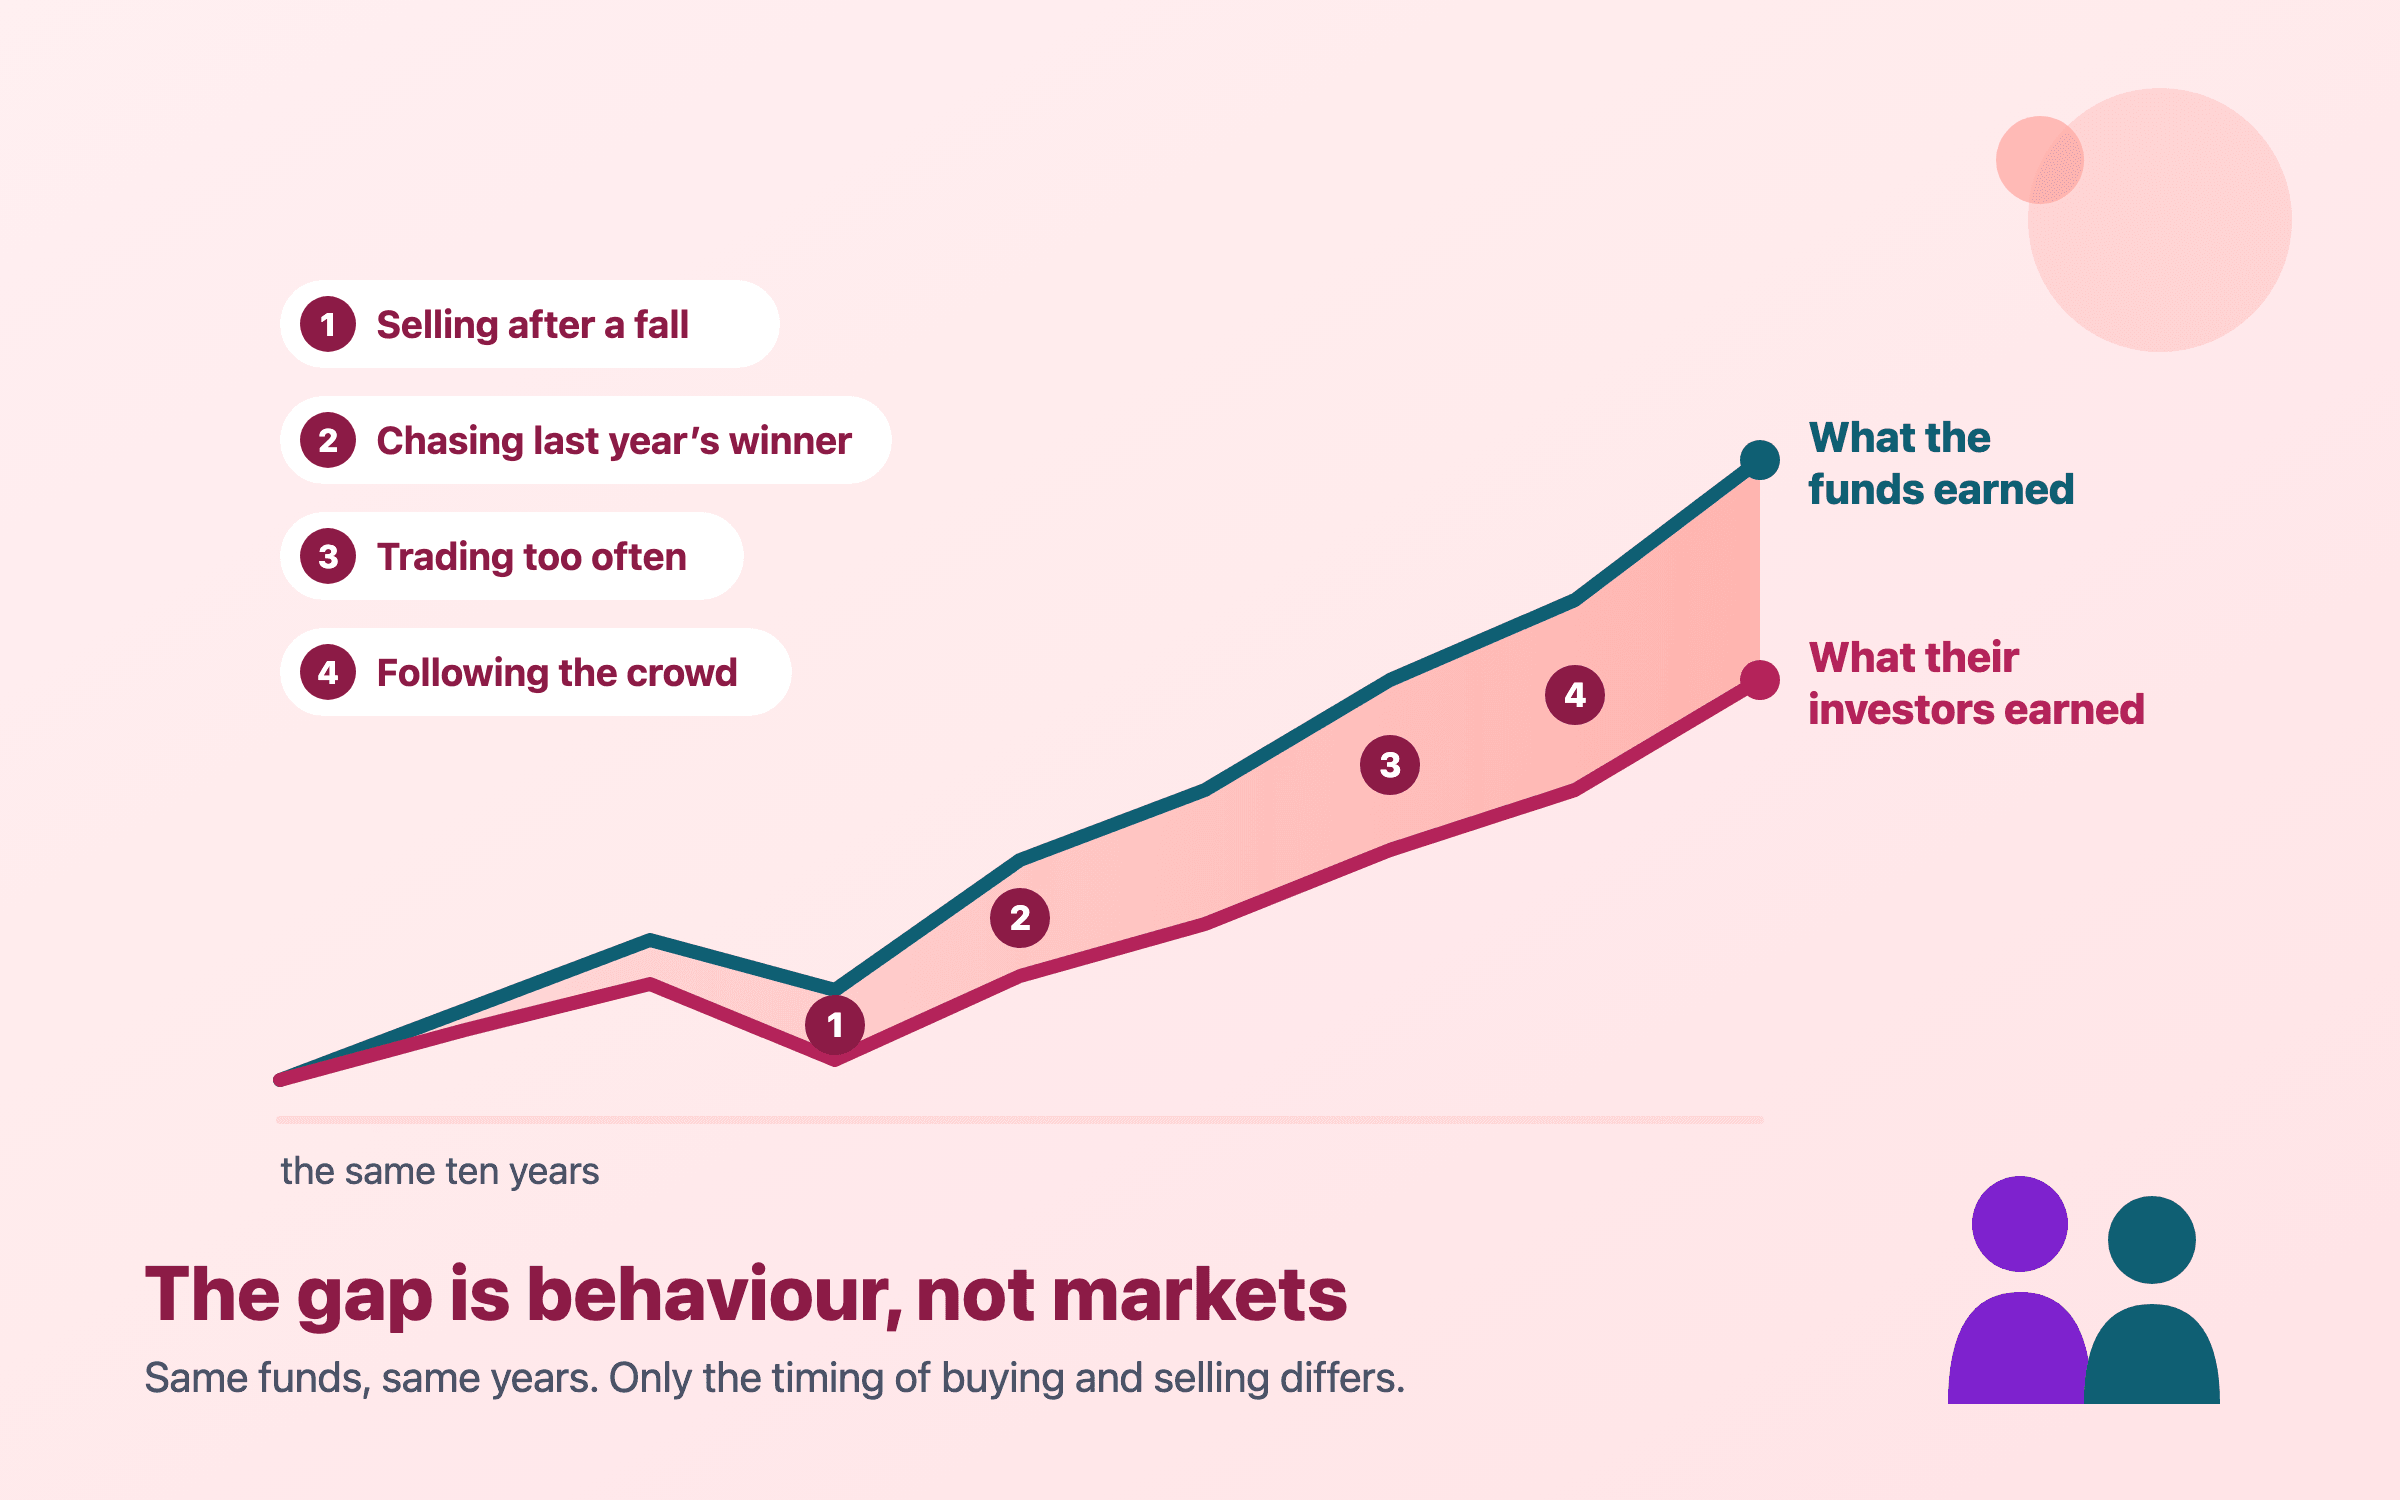
Funds earn one return and the people in them earn a lower one. Most of the difference is behaviour — and a household can write rules that protect it from its own instincts.
Investors in US funds earned 8.7% a year over the ten years to 2025 while the funds themselves returned 9.9%. The gap comes from when people buy and sell, driven by a handful of well-studied biases. Each has a simple counter-measure, and couples can turn those into shared rules that make the costly decision harder to take alone.
Nivritee Research · 9 July 2026 · updated 15 October 2026 · 7 min read
Two people can own the same fund for the same ten years and end with very different results. The fund reports one return; each investor earns their own, depending on when they put money in and took it out. Across a whole market the difference is large and remarkably steady, and most of it comes from a short list of mental habits that psychologists and economists have measured for half a century.
This article measures the gap, then takes the biases one at a time: what each is, how it shows up in an ordinary household, and one concrete counter-measure. It ends with rules a couple can agree to protect each other from their worst days.
The behaviour gap, measured
Morningstar’s annual Mind the Gap study compares two returns for the same US mutual funds and ETFs: the funds’ own total return, as if a single sum had been invested and left alone, and the dollar-weighted return their investors actually earned. Over the ten years to the end of 2025 investors earned 8.7% a year against 9.9% for the funds — a gap of about 1.2 percentage points a year, roughly 12% of the funds’ return. In money, Morningstar estimates those timing effects at around $3.8 trillion over the decade.1
What US fund investors earned against what their funds returned, a year, over the ten years to 2025
Investors’ return
Funds’ total return
In every group investors earned less than the funds they owned. The gap was narrowest in US equity and all-in-one allocation funds and wider in sector and international funds, where buying and selling at the wrong moment is easier. 1The figures in this chart
Investors’ return
Funds’ total return
Allocation
7.8%
8.4%
US equity
12.8%
13.3%
International equity
7.8%
8.9%
Sector equity
9.4%
10.6%
Taxable bond
1.9%
3.0%
All funds
8.7%
9.9%
The detail is telling. ETF investors earned 9.5% against their funds’ 11.2%, a wider gap than in traditional funds, which fits the idea that a product you can sell in a second is one you are more likely to sell.1 The size of the gap is debated — some researchers argue it overstates what bad timing costs, and our article on common investing mistakes sets out both sides — but nobody finds that investors in aggregate earn more than their funds.
The investor’s chief problem — and even his worst enemy — is likely to be himself.
— Benjamin Graham, as quoted by Brad Barber and Terrance Odean2
Loss aversion: a fall hurts about twice as much
Daniel Kahneman and Amos Tversky’s prospect theory starts from an observation about people, not markets: losses loom larger than equal gains. A 2024 meta-analysis of 607 estimates from 150 studies put the average loss-aversion coefficient at 1.955 — a loss weighs roughly twice as much as a gain of the same size.3
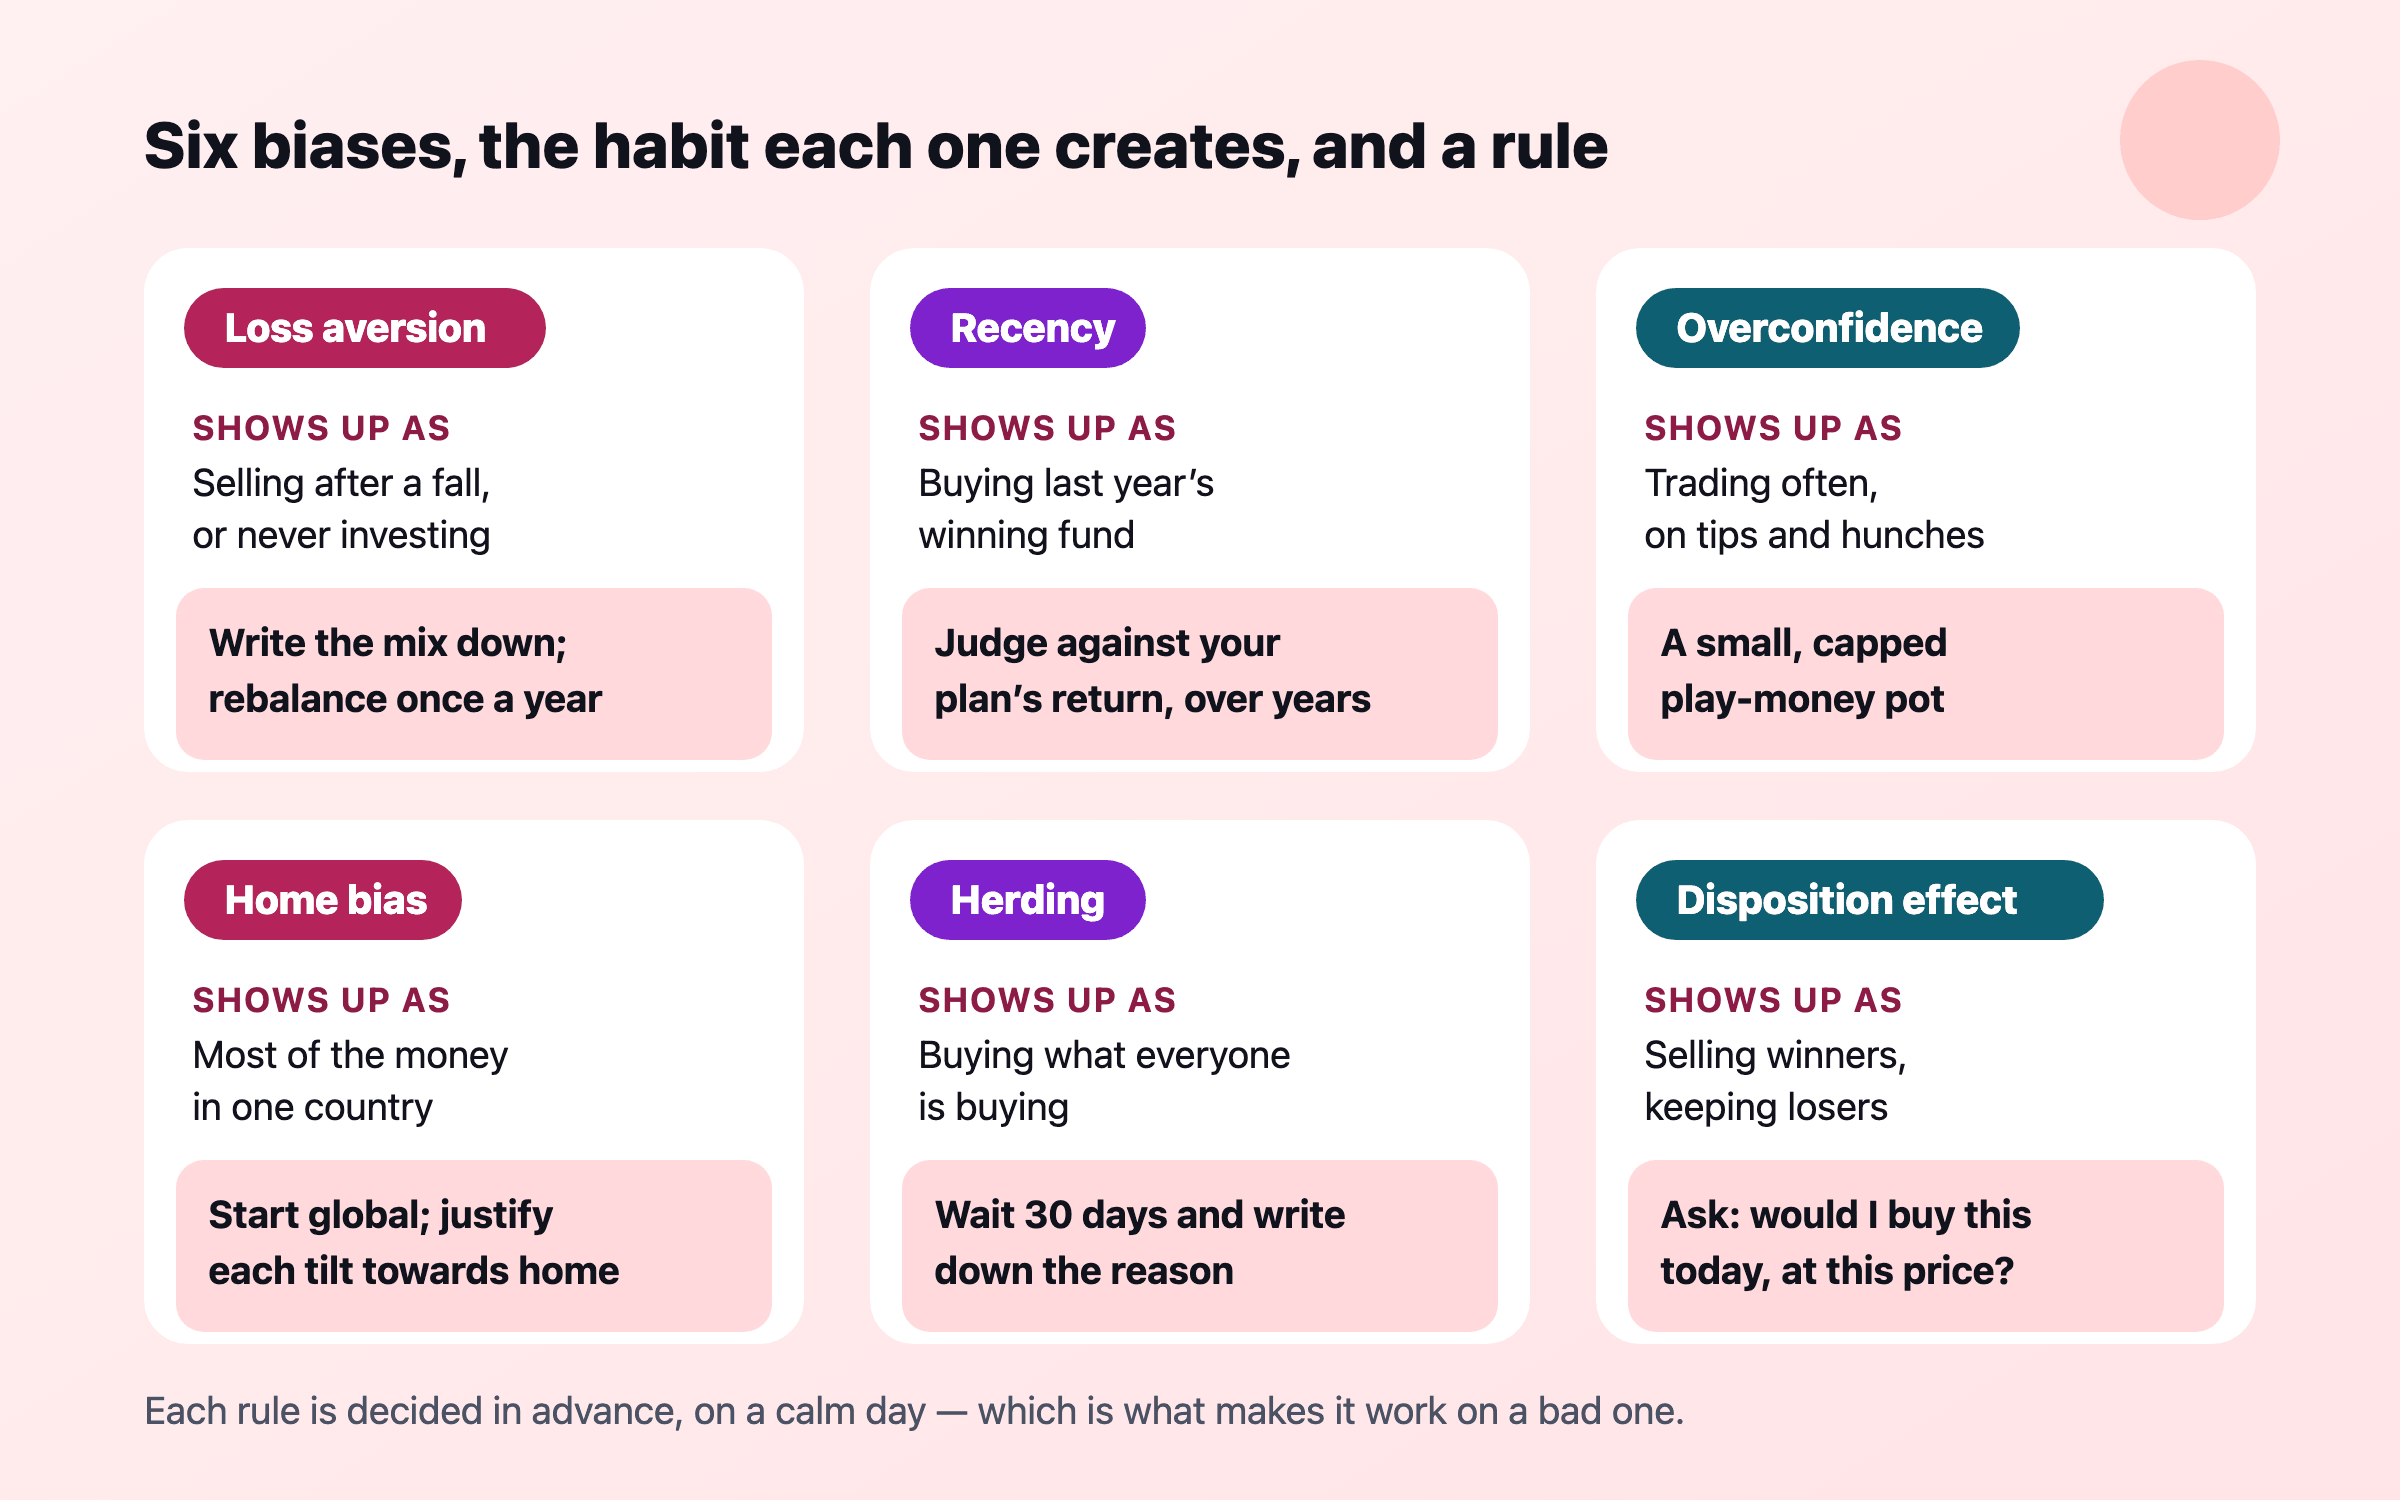
How it shows up: selling after a fall to stop the pain, then waiting for a “safer” moment to buy back — usually after prices have recovered. Or never investing at all and holding years of spending in a savings account.
Counter-measure: decide the mix of shares, bonds and cash in a calm month and write it down, with a rule for rebalancing back to it once a year or when it drifts far. A fall then means buying, not selling. Look at the portfolio less often: the less often you look, the fewer losses you see.
Recency: last year feels like next year
Robin Greenwood and Andrei Shleifer compared six different measures of investors’ expectations, drawn from surveys, from 1963 to 2011. All six moved together, all rose after markets had done well — and all were strongly negatively correlated with model-based estimates of the returns markets would actually deliver.4 People expect most when prices are already high, and least when they are low.
How it shows up: buying last year’s best fund, a sector everyone is talking about, or property after a long boom; switching out of a fund after one poor year.
Counter-measure: judge every holding against the return your plan assumes, over at least three to five years, not against last year’s winner. Write the reason for each purchase on the day you make it, and reread it before you sell.
Overconfidence: trading is hazardous to your wealth
Brad Barber and Terrance Odean studied 66,465 households at a US discount broker from 1991 to 1996. The average household turned over 75% of its portfolio a year and earned 16.4% a year, while the market returned 17.9%. The fifth of households that traded most earned 11.4%.2 A follow-up study of more than 35,000 households found that men traded 45% more than women, and that trading cut men’s net returns by 2.65 percentage points a year against 1.72 for women.5
Yearly return of US households trading shares directly, 1991–96, against the market
The more a household traded, the further it fell behind. The most active traders gave up 6.5 percentage points a year against simply holding the market. 2The figures in this chart
Annual return
The market
17.9%
The average household
16.4%
The most active fifth of households
11.4%
The same habit is visible today in derivatives. India’s market regulator found that nearly 91% of individual traders in equity futures and options made a net loss in the 2024–25 financial year, as in the year before.6
How it shows up: frequent switching, short-term trades on tips, options bought as lottery tickets, a belief that this time you can see what the market cannot.
Counter-measure: cap any “play money” at a small, fixed amount, kept apart from the plan, and measure your own return honestly — after costs, against a simple index fund — once a year.
Home bias: what feels familiar feels safe
Investors everywhere hold far more of their own country’s shares than its weight in the world. Canadians kept about 50% of their equities at home in 2024, roughly 18 times Canada’s 2.7% share of global markets.7 Vanguard found that, in each developed market it studied, volatility fell most with between 35% and 55% of equities held abroad.8
How it shows up: a portfolio of familiar local names, a large holding in your own employer’s shares — so that one company pays your salary and holds your savings — or, for families who will live in another country, savings in a currency they will never spend.
Counter-measure: start from a global index fund and justify each tilt towards home in writing. Our article on home bias and currency risk covers how to think about it when you earn in one country and will live in another.
Herding: buying what everyone else is buying
The newest example is in Morningstar’s own data. When US spot bitcoin ETFs launched in January 2024, money poured in. Through the end of 2025 the average dollar in them gained about 22% a year, nearly 14 percentage points a year less than the ETFs themselves; by the end of June 2026, after a downturn and redemptions that locked in losses, Morningstar estimated the average dollar had lost around 5.8% a year.1 The products were not the problem. The timing of the crowd was.
How it shows up: a theme on every front page, a fund a colleague has doubled their money in, a sense of missing out.
Counter-measure: a cooling-off rule. Anything new waits 30 days and is written down with a reason and a size limit before it is bought. Most enthusiasms do not survive the month.
The disposition effect: selling winners, keeping losers
Terrance Odean examined trading records for 10,000 accounts at a US discount broker and found a strong preference for selling shares that had risen over shares that had fallen. Rebalancing and trading costs did not explain it, the shares people kept went on to do no better than the ones they sold, and in taxable accounts the habit lowered after-tax returns — except in December, when investors did sell losers for the tax loss.9
How it shows up: waiting for a fallen holding to “get back to what I paid” before selling it, while taking profits early on the ones that work.
Counter-measure: ask of every holding: if I had this money in cash today, would I buy this? What you paid is a fact about the past; it is not information about the future.
Mental accounting: money with labels
Richard Thaler described how people sort money into mental accounts with their own rules — salary, bonus, gifts, “safe” money and “play” money — and treat a unit of currency differently depending on its label. Used deliberately, labels help households save, as how to save more shows. Used without noticing, they cost money: a bonus treated as free to gamble, a deposit earning little while a card balance charges far more, a fallen holding kept because selling would “make the loss real”.
Counter-measure: keep one household balance sheet, so every pot is seen against every debt. If a labelled pot is earning less than a debt costs, the label is costing you the difference.
Each bias has a symptom you can spot and a rule that blocks it. The rules work because they are decided in advance, on a calm day.
Rules couples can use to protect each other
A couple has an advantage a single investor lacks: a second person who is not having the same bad day. Biases are hard to see in yourself and easy to see in someone else. The trick is to agree the rules in advance, so that stopping a decision is following a rule rather than criticising a partner.
Write a one-page investment policy together: the mix you hold, why, and when you rebalance. Both sign it. Revisit it once a year, never in a falling market.
Agree a threshold above which any purchase or sale needs both of you — a fixed amount or a share of the portfolio. Below it, each acts alone.
Build in a wait. Any change to the plan’s mix waits two days and one conversation.
Keep a small personal allowance each for ideas the other does not share, so a hunch never has to be argued over, and it never touches the plan.
Swap roles in a crash. Whoever is calmer that month makes the call to rebalance, by the written rule.
Look together, not daily. The monthly money date is the time to read the figures; an app opened ten times a day in a crash is a machine for loss aversion.
None of this needs agreement on everything. How couples can talk about money covers the conversation itself; the rules here are what keep a frightening week from becoming a permanent decision.
How Nivritee helps
Questions people ask
What is the behaviour gap in investing?
It is the difference between what a fund returns and what its investors earn, caused by when they buy and sell. Morningstar estimates US fund investors earned 8.7% a year over the ten years to 2025 against 9.9% for their funds.1
What is loss aversion?
The tendency to feel a loss more strongly than a gain of the same size. A 2024 meta-analysis of 607 estimates put the average loss-aversion coefficient at about 1.96, so a loss weighs roughly twice as much as an equal gain.3
Does trading more lead to lower returns?
In the best-known study, yes: among 66,465 US households from 1991 to 1996, the most active fifth earned 11.4% a year against 17.9% for the market.2
What is the disposition effect?
The habit of selling investments that have risen while holding on to ones that have fallen. Terrance Odean’s study of 10,000 brokerage accounts found it was not justified by later performance and lowered after-tax returns.9
How can couples avoid emotional investing decisions?
Agree rules on a calm day: a written mix and rebalancing date, a threshold above which both must agree, a waiting period before any change, and a small personal allowance each for ideas the other does not share.
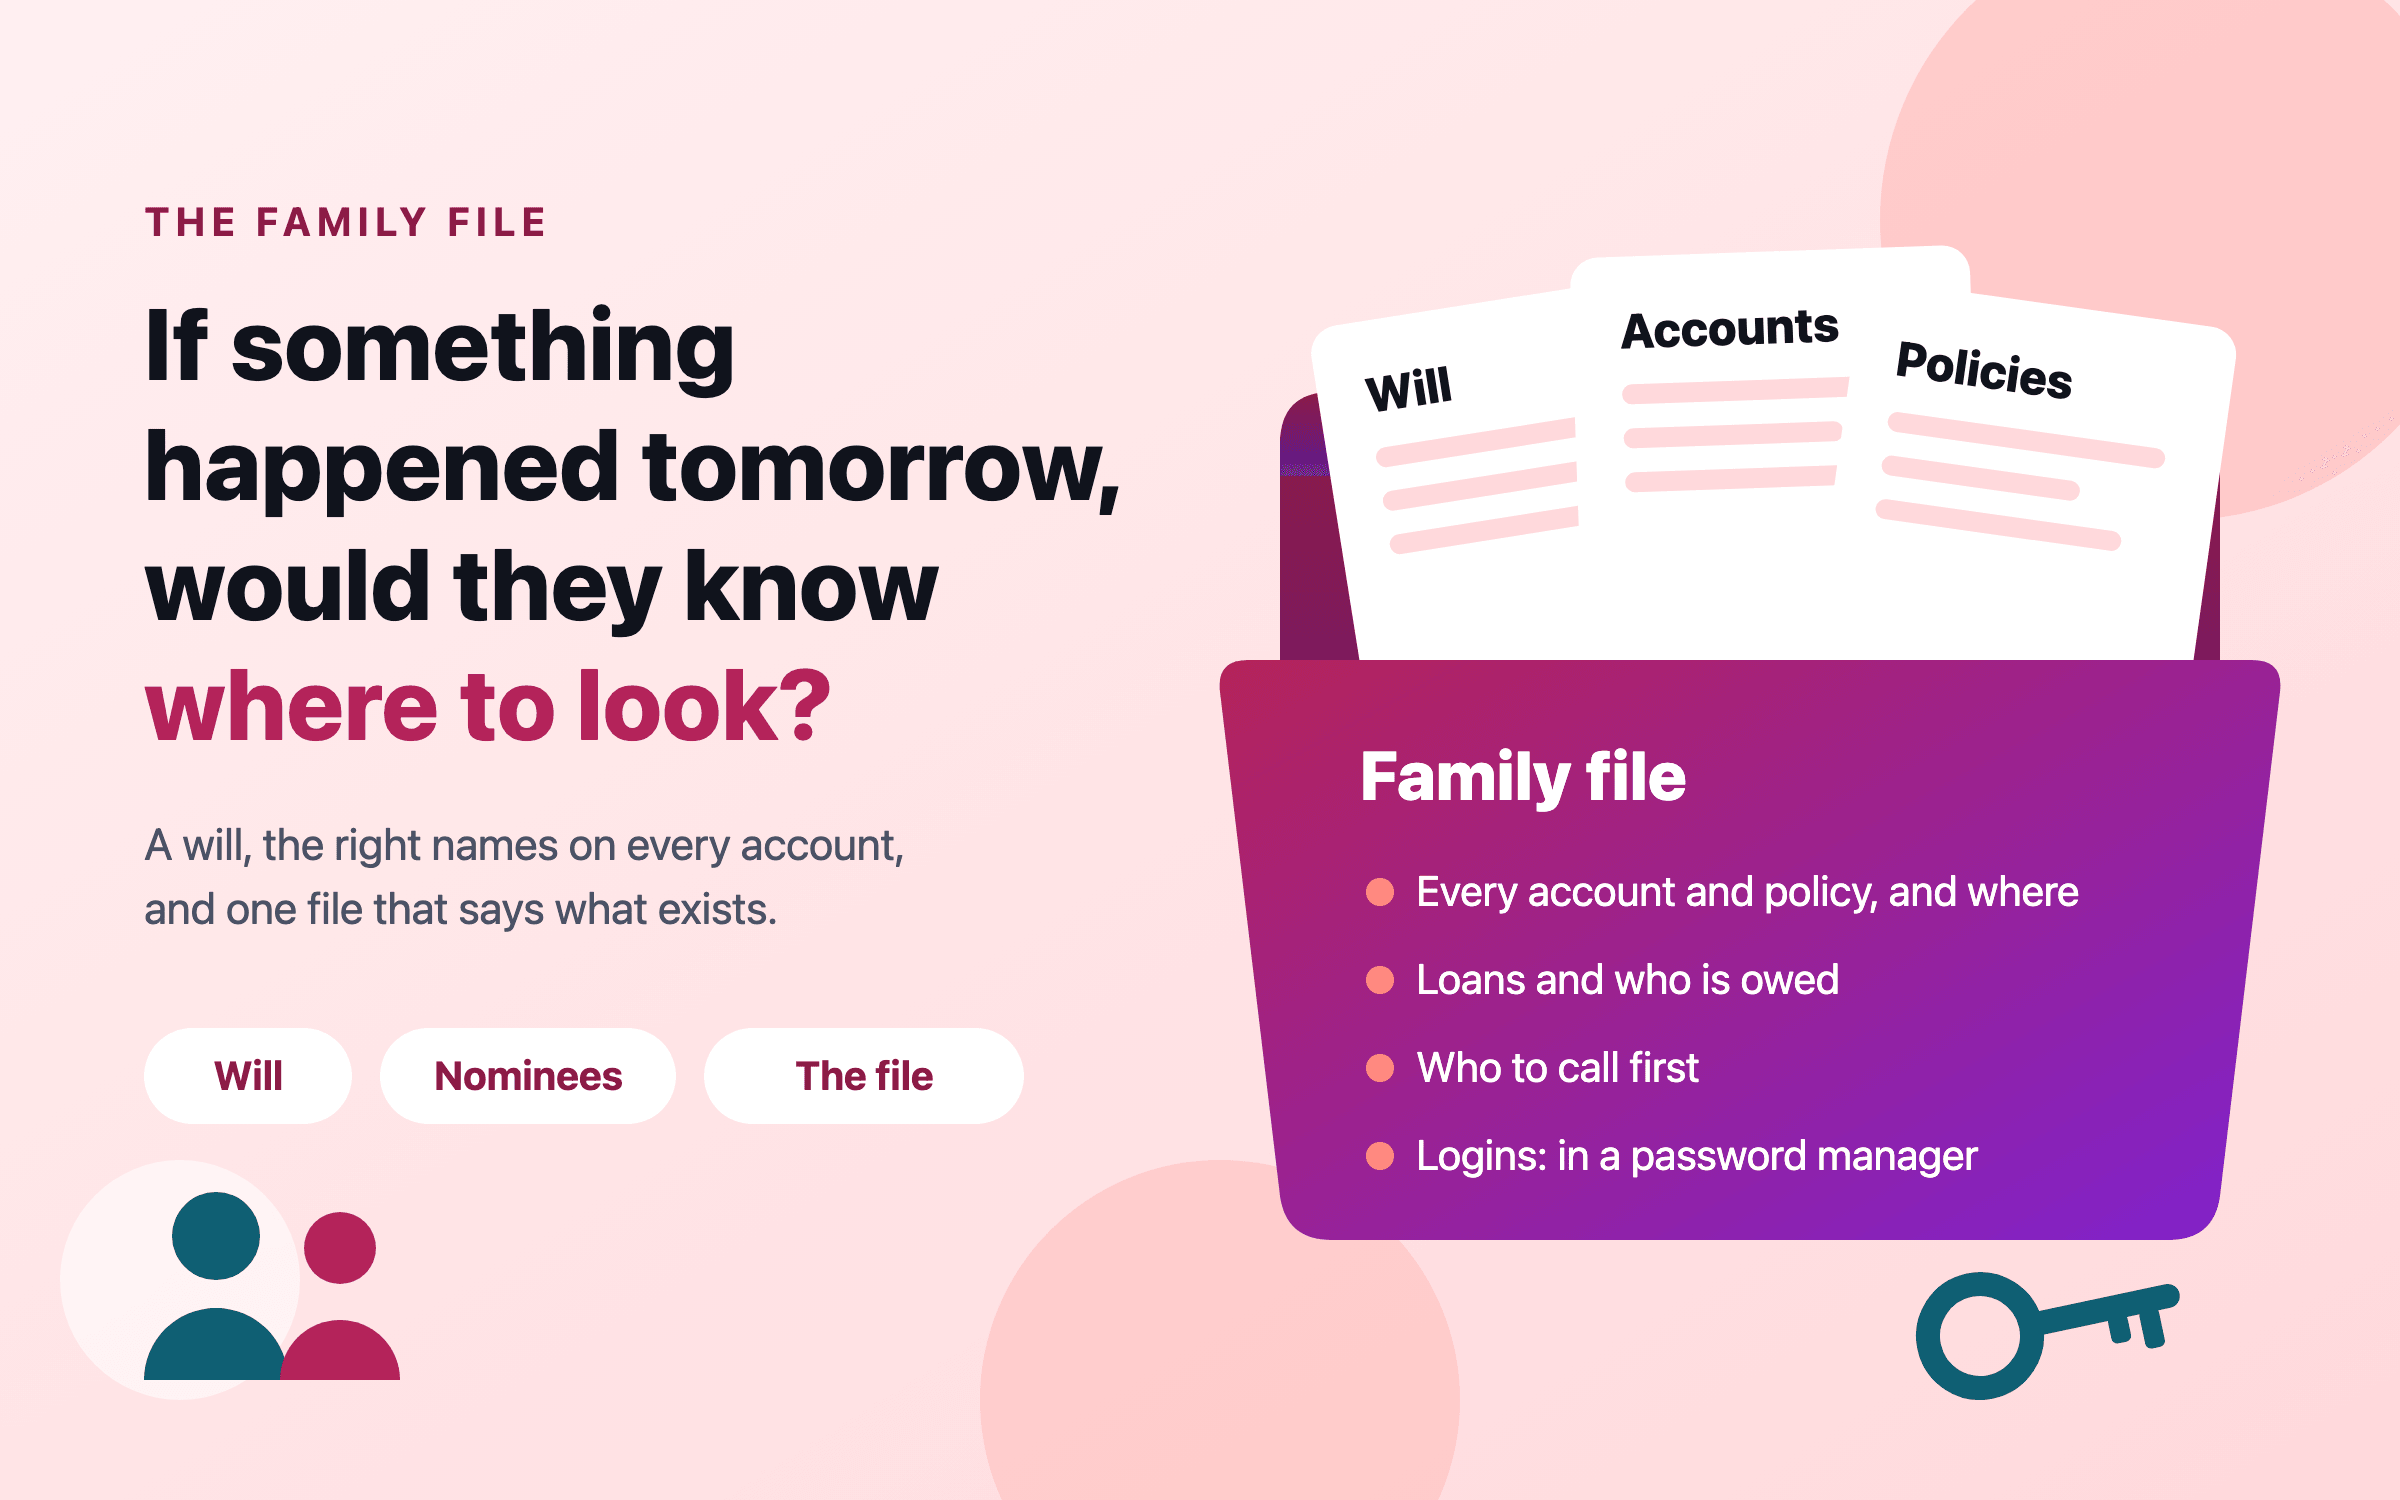
In the US, the UK, Canada, Singapore and Australia, roughly half of adults have no will. Money then moves by three routes: joint ownership, a name on the account, or a will — and where there is no will, a fixed legal order that may not match your wishes. Families with assets in more than one country need a plan for each, and everyone needs a family file that says what exists and where.
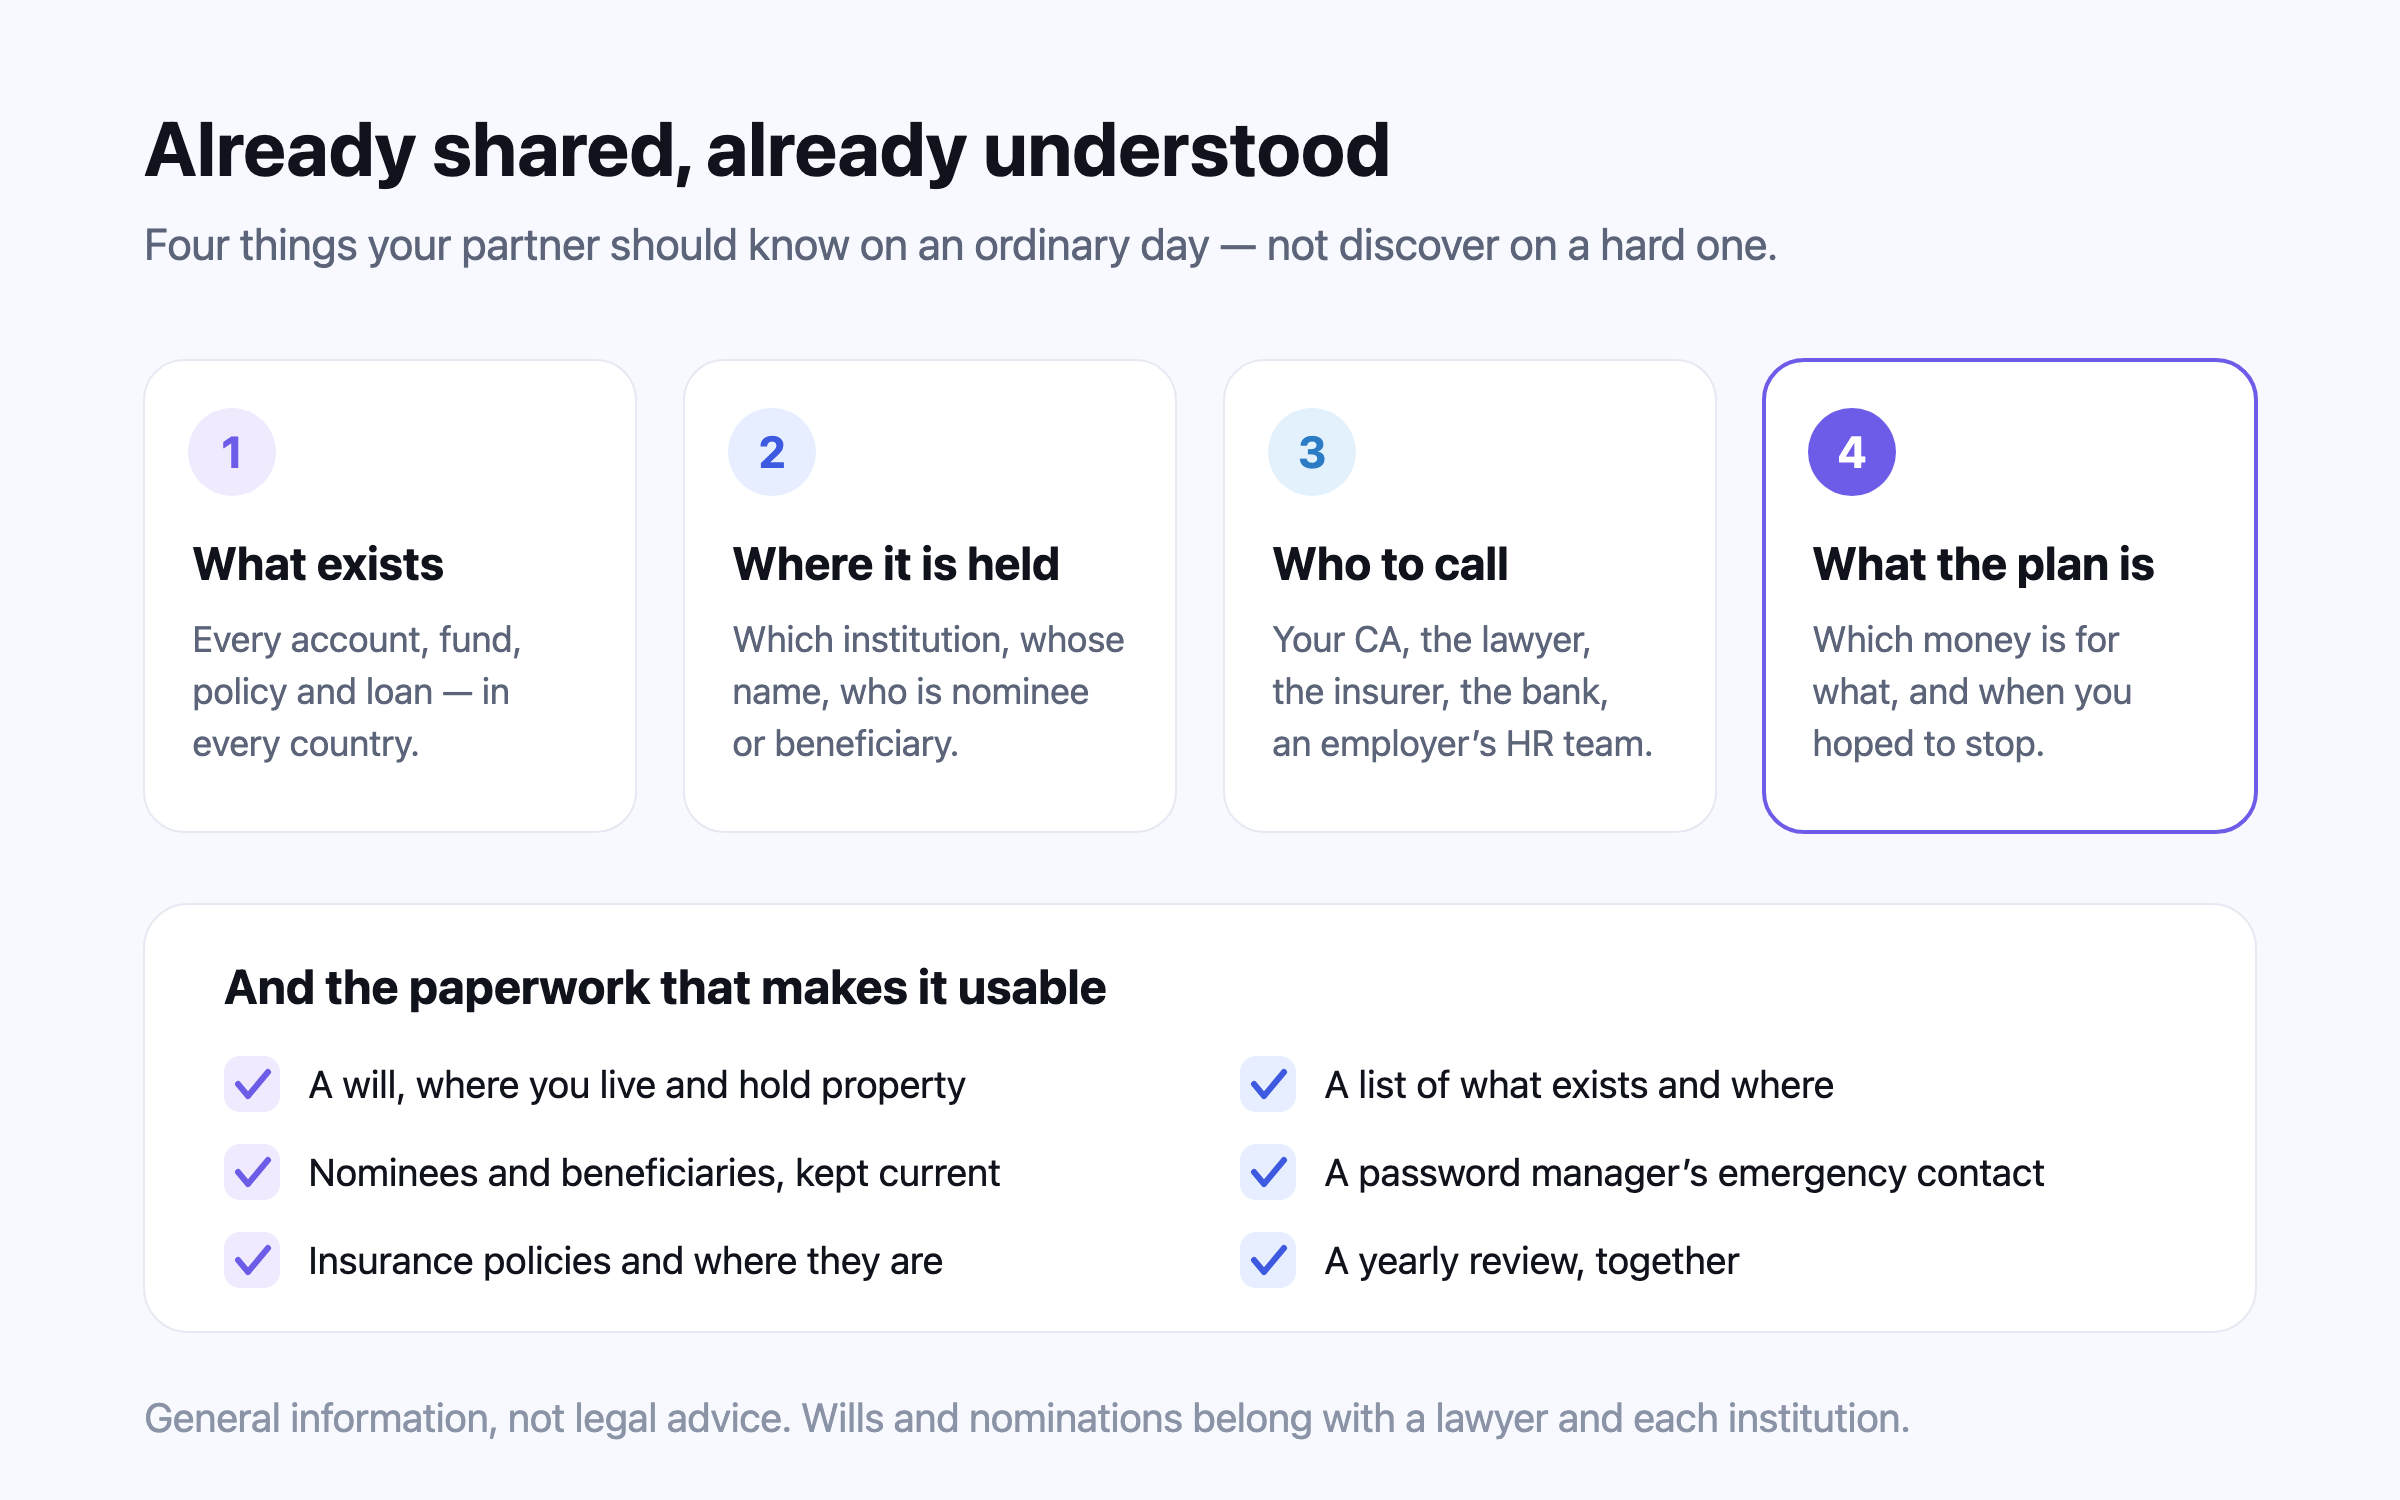
In most households one person knows where everything is. Readiness means your partner knows four things too — what you own and owe, where each is held, who to call, and what the plan is — plus the paperwork that makes it usable: a will, up-to-date nominations or beneficiaries, insurance details and a way into the accounts. The easiest time to share all of it is now, when nothing is wrong.
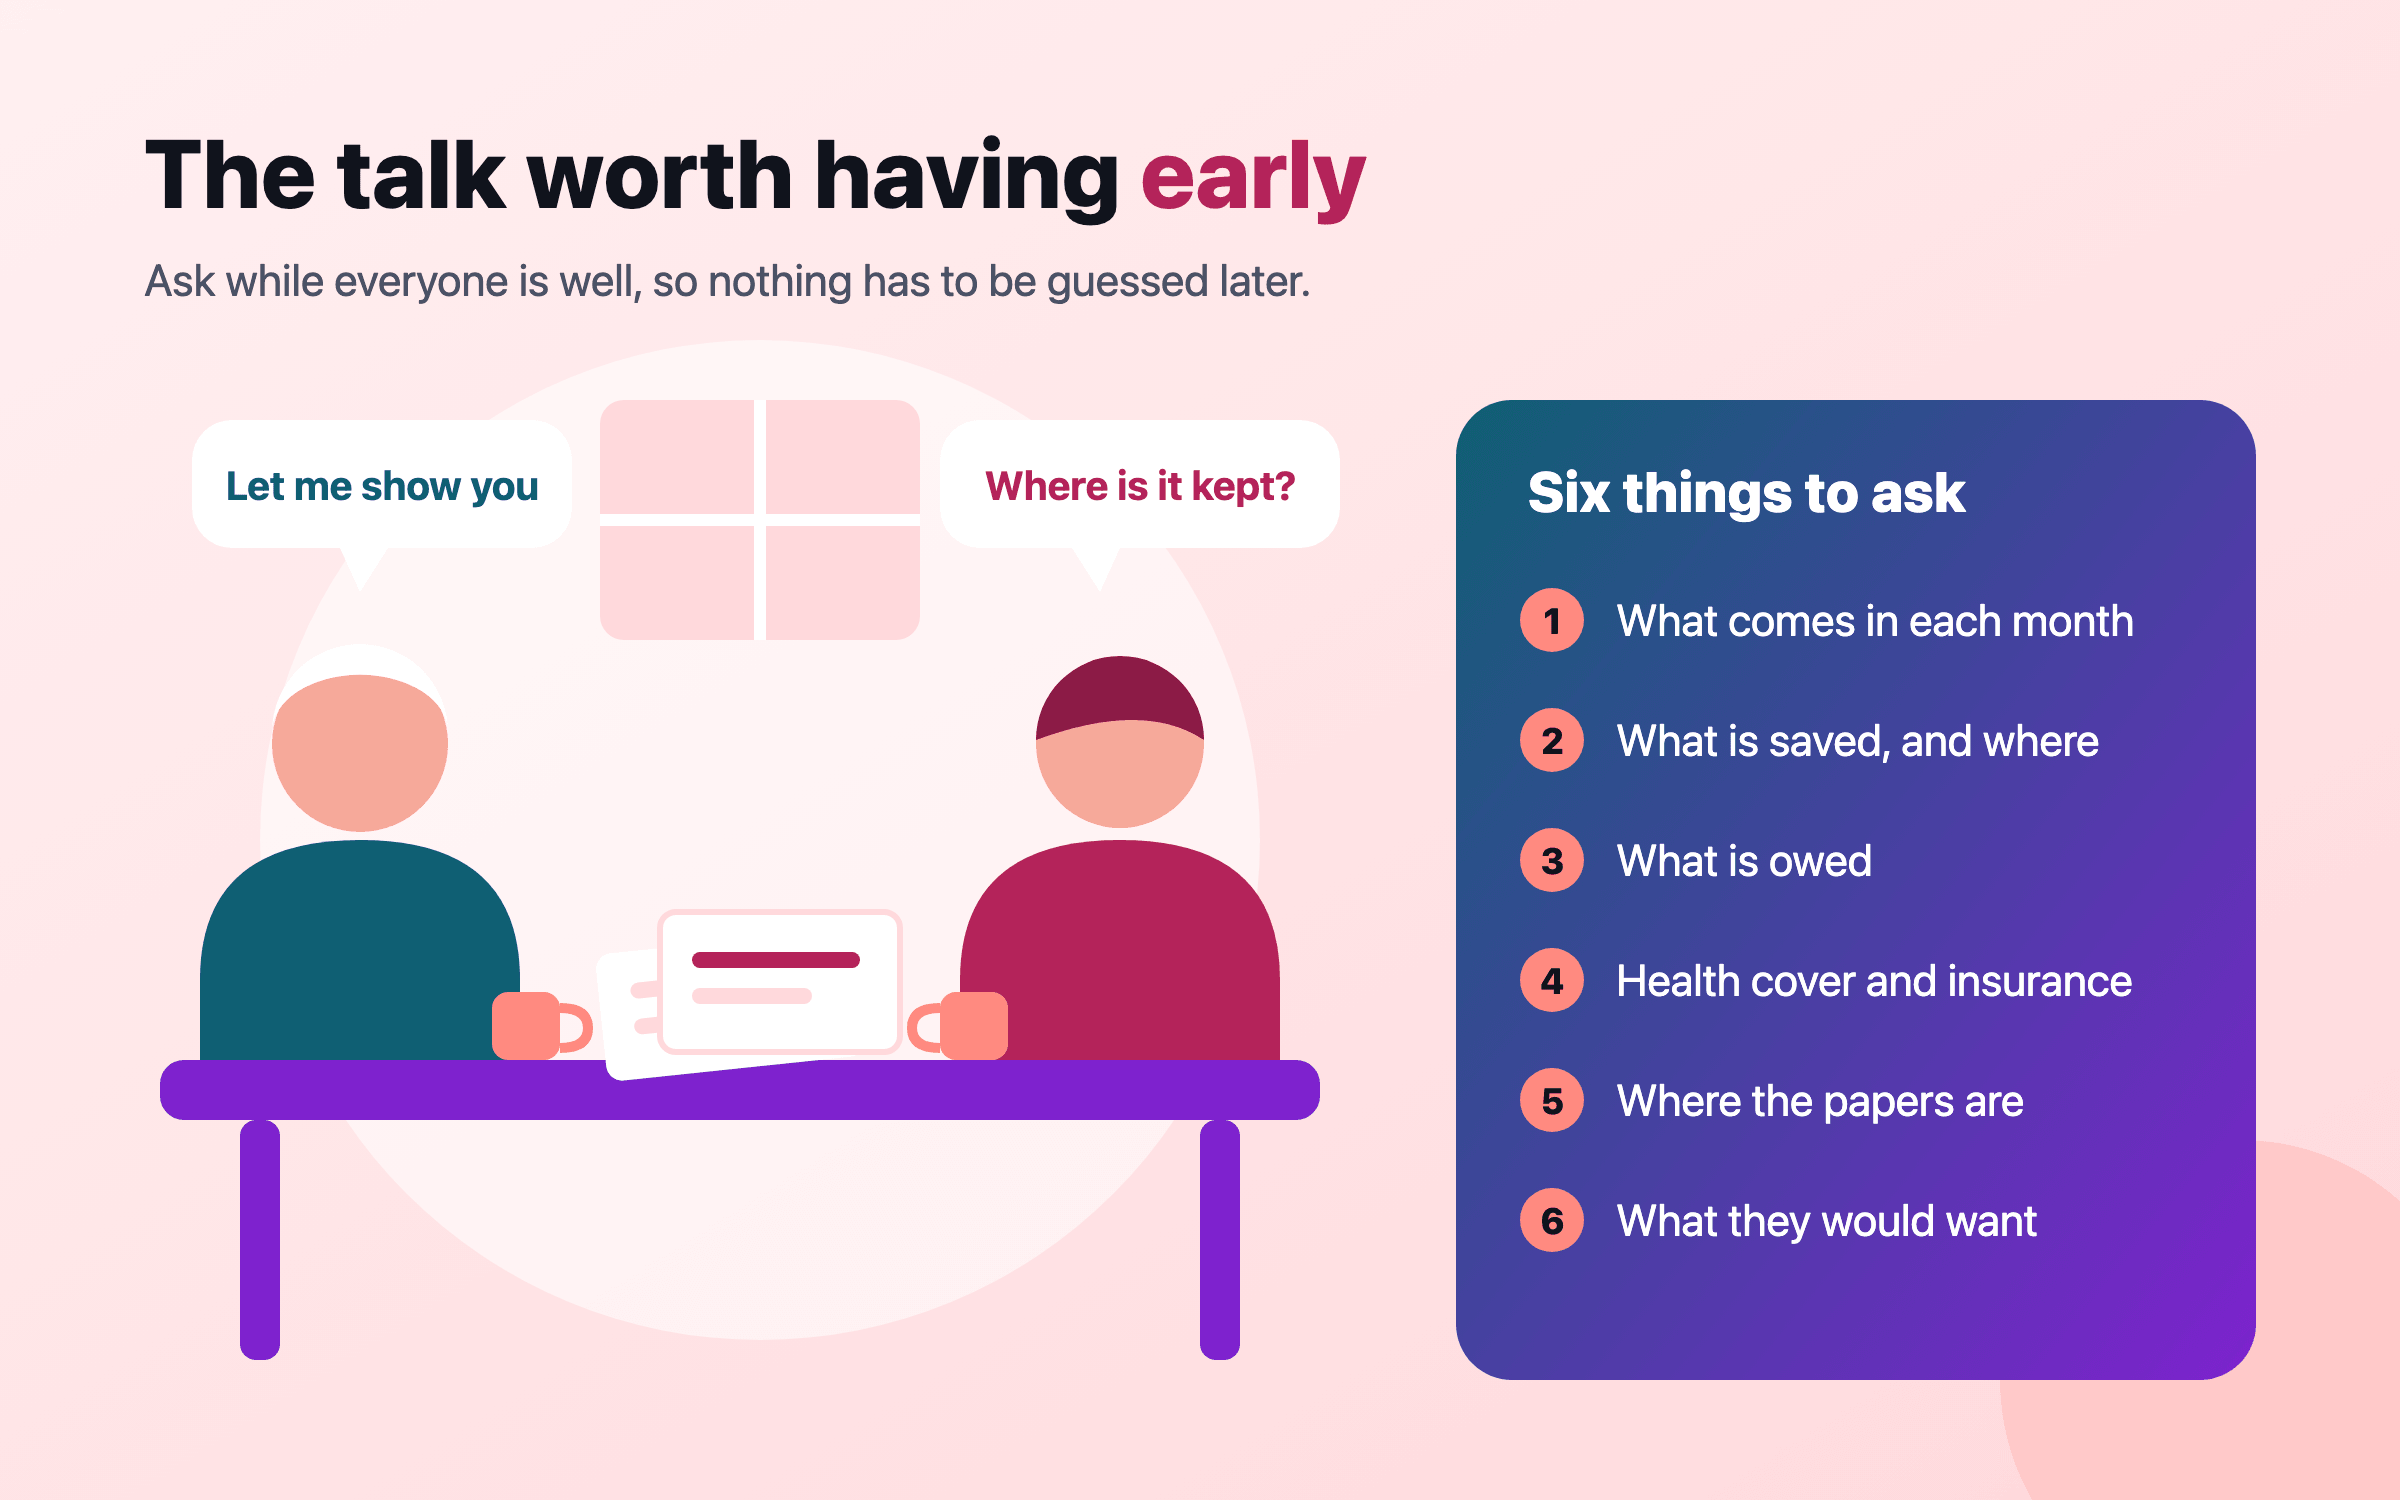
Most families have this conversation too late, in a hospital corridor. Asked early, it comes down to six things — what comes in, what is saved, what is owed, what cover exists, where the papers are and what your parents would want — plus a power of attorney signed while they are well, a watch for scams, and an agreed split of support between siblings that also fits inside your own plan.
This is general information, not financial, tax or legal advice for your circumstances. Rules and figures change; check the official source for your country, and consult a licensed professional before making financial decisions. Projections are estimates, not predictions.