The number you need is your yearly spending after you stop, less the pensions you can count on, multiplied by about 25 — and more than that if you stop early or live long.
Start from what you will spend, not from what you earn. Subtract the state and workplace pensions you can rely on, and multiply what is left by about 25 for a 30-year retirement, or by closer to 30 for a 40-year one. Real spending has tended to drift down about 1% a year through retirement while healthcare rises, and a 65-year-old today can expect to live another 15 to 25 years depending on country and sex — so plan for the long end.
Nivritee Research · 6 October 2026 · 11 min read
There is no universal retirement number, but there is a universal way to find yours. Estimate what you will spend each year once you stop, take off the income you can count on — a state pension, a workplace pension, an annuity — and divide what is left by a withdrawal rate you are comfortable with. At 4%, the starting rate William Bengen found had never exhausted a US portfolio half in shares and half in bonds in under 33 years, on data from 1926, that is 25 times the gap1. Morningstar’s current estimate for a 30-year retirement is 3.9%, and for 40 years 3.3%, about 30 times23. Everything else in this article is about getting the inputs right, because a small error in spending, multiplied by 25, becomes a large error in the target.
The age a 65-year-old Japanese woman can expect to reach
Start from spending, not from income
The old rule of thumb says you need most of your final salary, and the figure quoted varies with whoever is quoting it. It is a poor fit for the households most likely to be reading this, because a working income pays for things that stop: pension contributions, payroll taxes on wages, commuting, the mortgage once it is cleared, and saving itself. A household putting a quarter of its take-home pay into investments already lives on three-quarters of it, before anything else falls away. A household still paying school fees or a mortgage at 60 is in the opposite position, and a percentage of income tells neither of them much.
The better starting point is a year of your own spending, taken from bank and card statements rather than memory, then edited line by line for the life you expect after you stop. Some lines fall (commuting, work clothes, the mortgage), some rise (travel in the early years, healthcare later, help for adult children or ageing parents) and some simply carry on. The result is a figure in today’s money, which is the only honest unit for a target decades away.
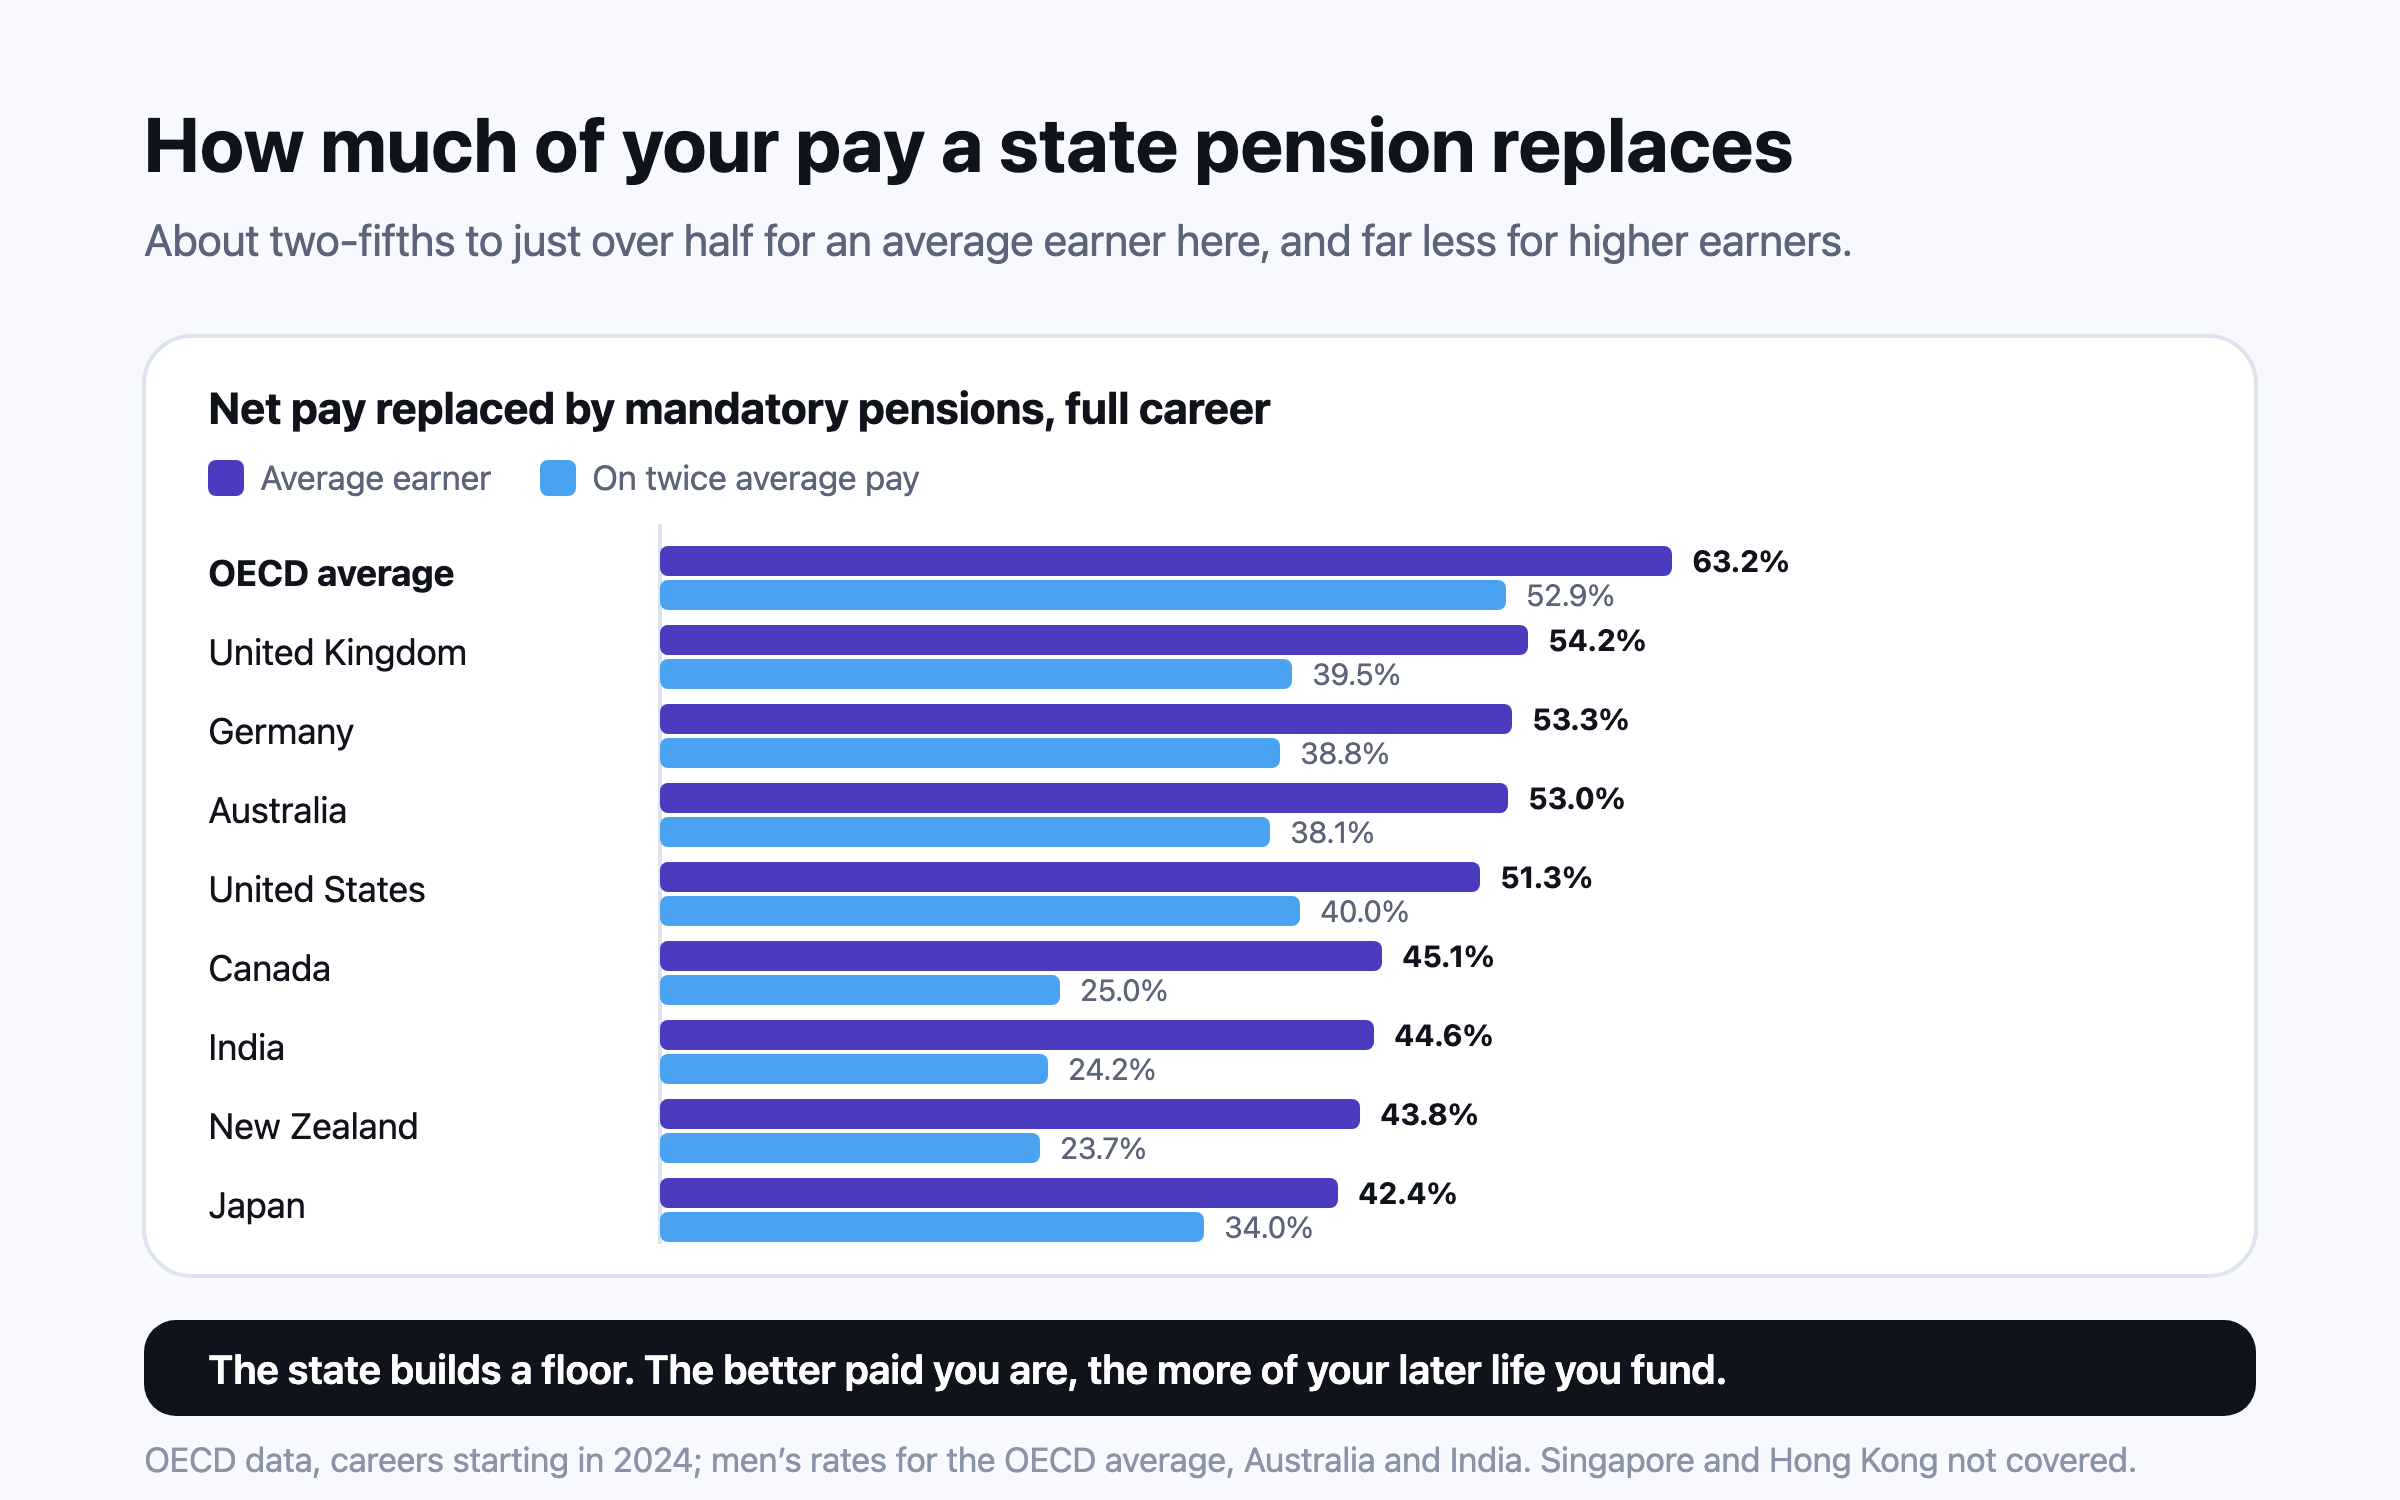
The OECD’s Pensions at a Glance shows how much of the gap state systems fill. For a man on average earnings starting a full career today, mandatory pensions are projected to replace 63.2% of net pay on the OECD average (62.4% for a woman) — but 51.3% in the United States, 54.2% in the UK, 45.1% in Canada and 42.4% in Japan, where the rates are the same for both sexes, and 53.0% in Australia and 44.6% in India for men4. At twice average earnings the OECD average falls to 52.9%, and Canada’s to 25.0%4. The better paid you are, the more of your later life you fund yourself. State pensions compared sets out what each system pays and when.
How spending really changes after you stop
Many calculators assume retirees spend the same amount, rising with inflation, until they die. David Blanchett, then at Morningstar, tested that against what American retirees actually spent, matching the RAND Health and Retirement Study to its consumption survey for 2001 to 2009, and found real spending fell by approximately 1% a year on average7. The fall was gentler in early and late retirement and steeper in the middle, the shape he called the retirement spending smile: travel and activity early, medical costs late. At a steady 1% a year, real spending ends up about 18% lower after 20 years7.
The pattern changes the arithmetic. In Blanchett’s simulations a couple of 65 spending about $50,000 a year and following the curve, and planning for their joint life expectancy rather than a fixed 30 years, could start at about 5% and have roughly the same chance of success as a 4% withdrawal held flat in real terms for 30 years — which means about 20% less saved for the same first-year income7.
The smile is an average, not a promise. Somebody who stops at 50 has a longer active phase, and a long-term-care bill in the last few years can undo a decade of falling spending. Wade Pfau’s Retirement Planning Guidebook describes a safety-first approach: meet essential spending with reliable income, and treat discretionary spending as the part that can flex8. A cautious way to use Blanchett’s finding is to let the target assume flat real spending, and treat any decline as a margin of safety rather than money to spend in advance.
Two public yardsticks: the UK and Australia
Britain has the most useful public measure of what a lifestyle costs. Pensions UK (formerly the PLSA) publishes Retirement Living Standards at three levels, as spending after tax for households who own their home outright; renters need more9.
Spending after tax, for people who own their home outright. Figures as published by Pensions UK in its June 2026 update. 9
Retirement Living Standard (UK)
One person, a year
Two people, a year
What it buys, roughly
Minimum
£13,900
£22,500
Basic needs, a week’s UK holiday, eating out about once a month, no car
Moderate
£32,700
£45,400
A fortnight’s all-inclusive holiday in the Mediterranean and a UK long weekend, a small car replaced every seven years
Comfortable
£45,400
£62,700
A fortnight’s half-board holiday in the Mediterranean plus three UK long weekends, a car replaced every five years
Australia’s Association of Superannuation Funds publishes a similar Retirement Standard each quarter for homeowners aged 65 to 84. For the June quarter of 2026 a comfortable lifestyle cost A$78,998 a year for a couple and A$56,166 for a single person, and a modest one A$52,690 and A$36,54810. ASFA estimates that a couple retiring at 67 needs A$730,000 in super for the comfortable standard — far less than 25 times A$78,998, because its figure assumes a part Age Pension tops up their income and that their capital is spent down over retirement10. Most other countries have no official benchmark, which is why your own spending record is the better starting point everywhere.
Healthcare: the cost that rises
Fidelity’s 2026 estimate is that a 65-year-old American may need $185,500 in after-tax savings for healthcare over retirement — Medicare premiums, deductibles, co-insurance and prescriptions, but not long-term care, most dental services or over-the-counter medicines5. The estimate is for one person, so a couple both stopping at 65 would need roughly twice that: about $371,000 by simple doubling.
In the UK, Canada, Australia and most of Europe the state system covers much more, but public systems usually leave out some of medicines, dental care, eyesight and long-term care, and private cover gets dearer with age11. In India and Singapore the household carries more of the cost directly. Whatever the country, health costs have tended to rise faster than general prices, so they belong in a plan as their own line with their own inflation rate, not buried in the total11. Inflation is not one number shows how far apart the rates can run.
How long the money has to last
Life expectancy at 65 in 2024, expressed as the age reached, from OECD Pensions at a Glance 2025. These are averages: roughly half of people live longer, and a couple’s joint horizon is longer than either person’s. 6
Country
Men at 65 can expect to reach
Women at 65 can expect to reach
Japan
85.1
89.9
Australia
85.9
88.2
Canada
84.9
87.8
New Zealand
84.6
86.8
United Kingdom
83.8
86.3
United States
83.7
86.2
Germany
83.4
86.5
India
80.1
81.5
OECD average
83.5
86.6
An average is the age half of people outlive. A 65-year-old Australian woman can expect to reach 88.2 on average6, so a plan that runs to 88 falls short for roughly half of the women it is written for. For a couple the relevant question is how long the second of two people lives, which is longer again. Planning to 90 or 95 is not pessimism; it is the honest end of the distribution. Sequence-of-returns risk explains why the first ten of those years matter most.
From spending to a target: the multiplier
Bengen’s 4% rule took a first-year withdrawal of 4% of the portfolio and raised it with inflation each year; on US data from 1926 it never ran out in under 33 years1. Morningstar’s forward-looking estimates, for a 90% chance of not running out with 40% in shares, are 3.9% for 30 years, 3.5% for 35, 3.3% for 40 and 2.9% for 5023. As multipliers of the yearly gap that is about 26, 29, 30 and 34. Morningstar also finds that flexible spending — cutting back after bad years — supports a higher starting rate3.
Two adjustments matter. Withdrawals from pensions and tax-deferred accounts are usually taxed, so a gap stated after tax must be grossed up before multiplying; and investment costs come out of the withdrawal rate, not on top of it (what fees cost). How the safe rate varies by country shows what history says outside the US, where history has generally been less kind.
Seven households, worked through
The households below are illustrative and every amount is in today’s money. Each uses the same method; the pension figures are the official 2026 rates, and the spending levels are chosen to sit in the middle and upper-middle of each country.
Gap = spending − secure income; target = gap × multiplier, in today’s money, before tax on withdrawals. UK State Pension £241.30 a week each; Canada’s OAS C$762.50 a month each; Singapore’s CPF LIFE about S$1,780 a month each for the 2026 Full Retirement Sum; Australia’s full Age Pension A$1,866 a fortnight for a couple from 20 September 2026. 12913141015163
Household
Spending a year
Secure income a year
Gap
Multiplier
Target
Mark and Jen, Raleigh, stop at 67
$96,000
$62,400
$33,600
25
$840,000
Gareth and Helen, Bristol, Moderate
£45,400
£25,095
£20,305
25
about £507,600
Gareth and Helen, Bristol, Comfortable
£62,700
£25,095
£37,605
25
about £940,100
Raj and Simran, Ottawa, stop at 65
C$90,000
C$44,700
C$45,300
25
C$1,132,500
Craig and Kate, Brisbane, stop at 67
A$78,998
Age Pension, means-tested
up to A$78,998
25
up to A$1,974,950
Li Ting and Jun, Singapore, stop at 65
S$72,000
S$42,720
S$29,280
25
S$732,000
Suresh and Lata, Chennai, stop at 55
₹12 lakh
None counted
₹12 lakh
30
₹3.6 crore
Mark and Jen, 64 and 62, Raleigh, North Carolina. They spend $96,000 a year and both plan to stop at 67, their full retirement age. Their Social Security statements show $3,300 and $1,900 a month at 67, $62,400 a year together, leaving $33,600 for savings to cover: $840,000 at 25 times. Claiming at 62 would have cut each benefit by 30% for life, so Mark’s $3,300 would be $2,310; waiting past 67 adds 8% a year until 70, which would lift it to $4,0921718. Healthcare is the line to check: Fidelity’s $185,500 per person covers Medicare-related costs and leaves out long-term care and most dental work5, so they test whether their $96,000 already includes premiums and out-of-pocket costs.
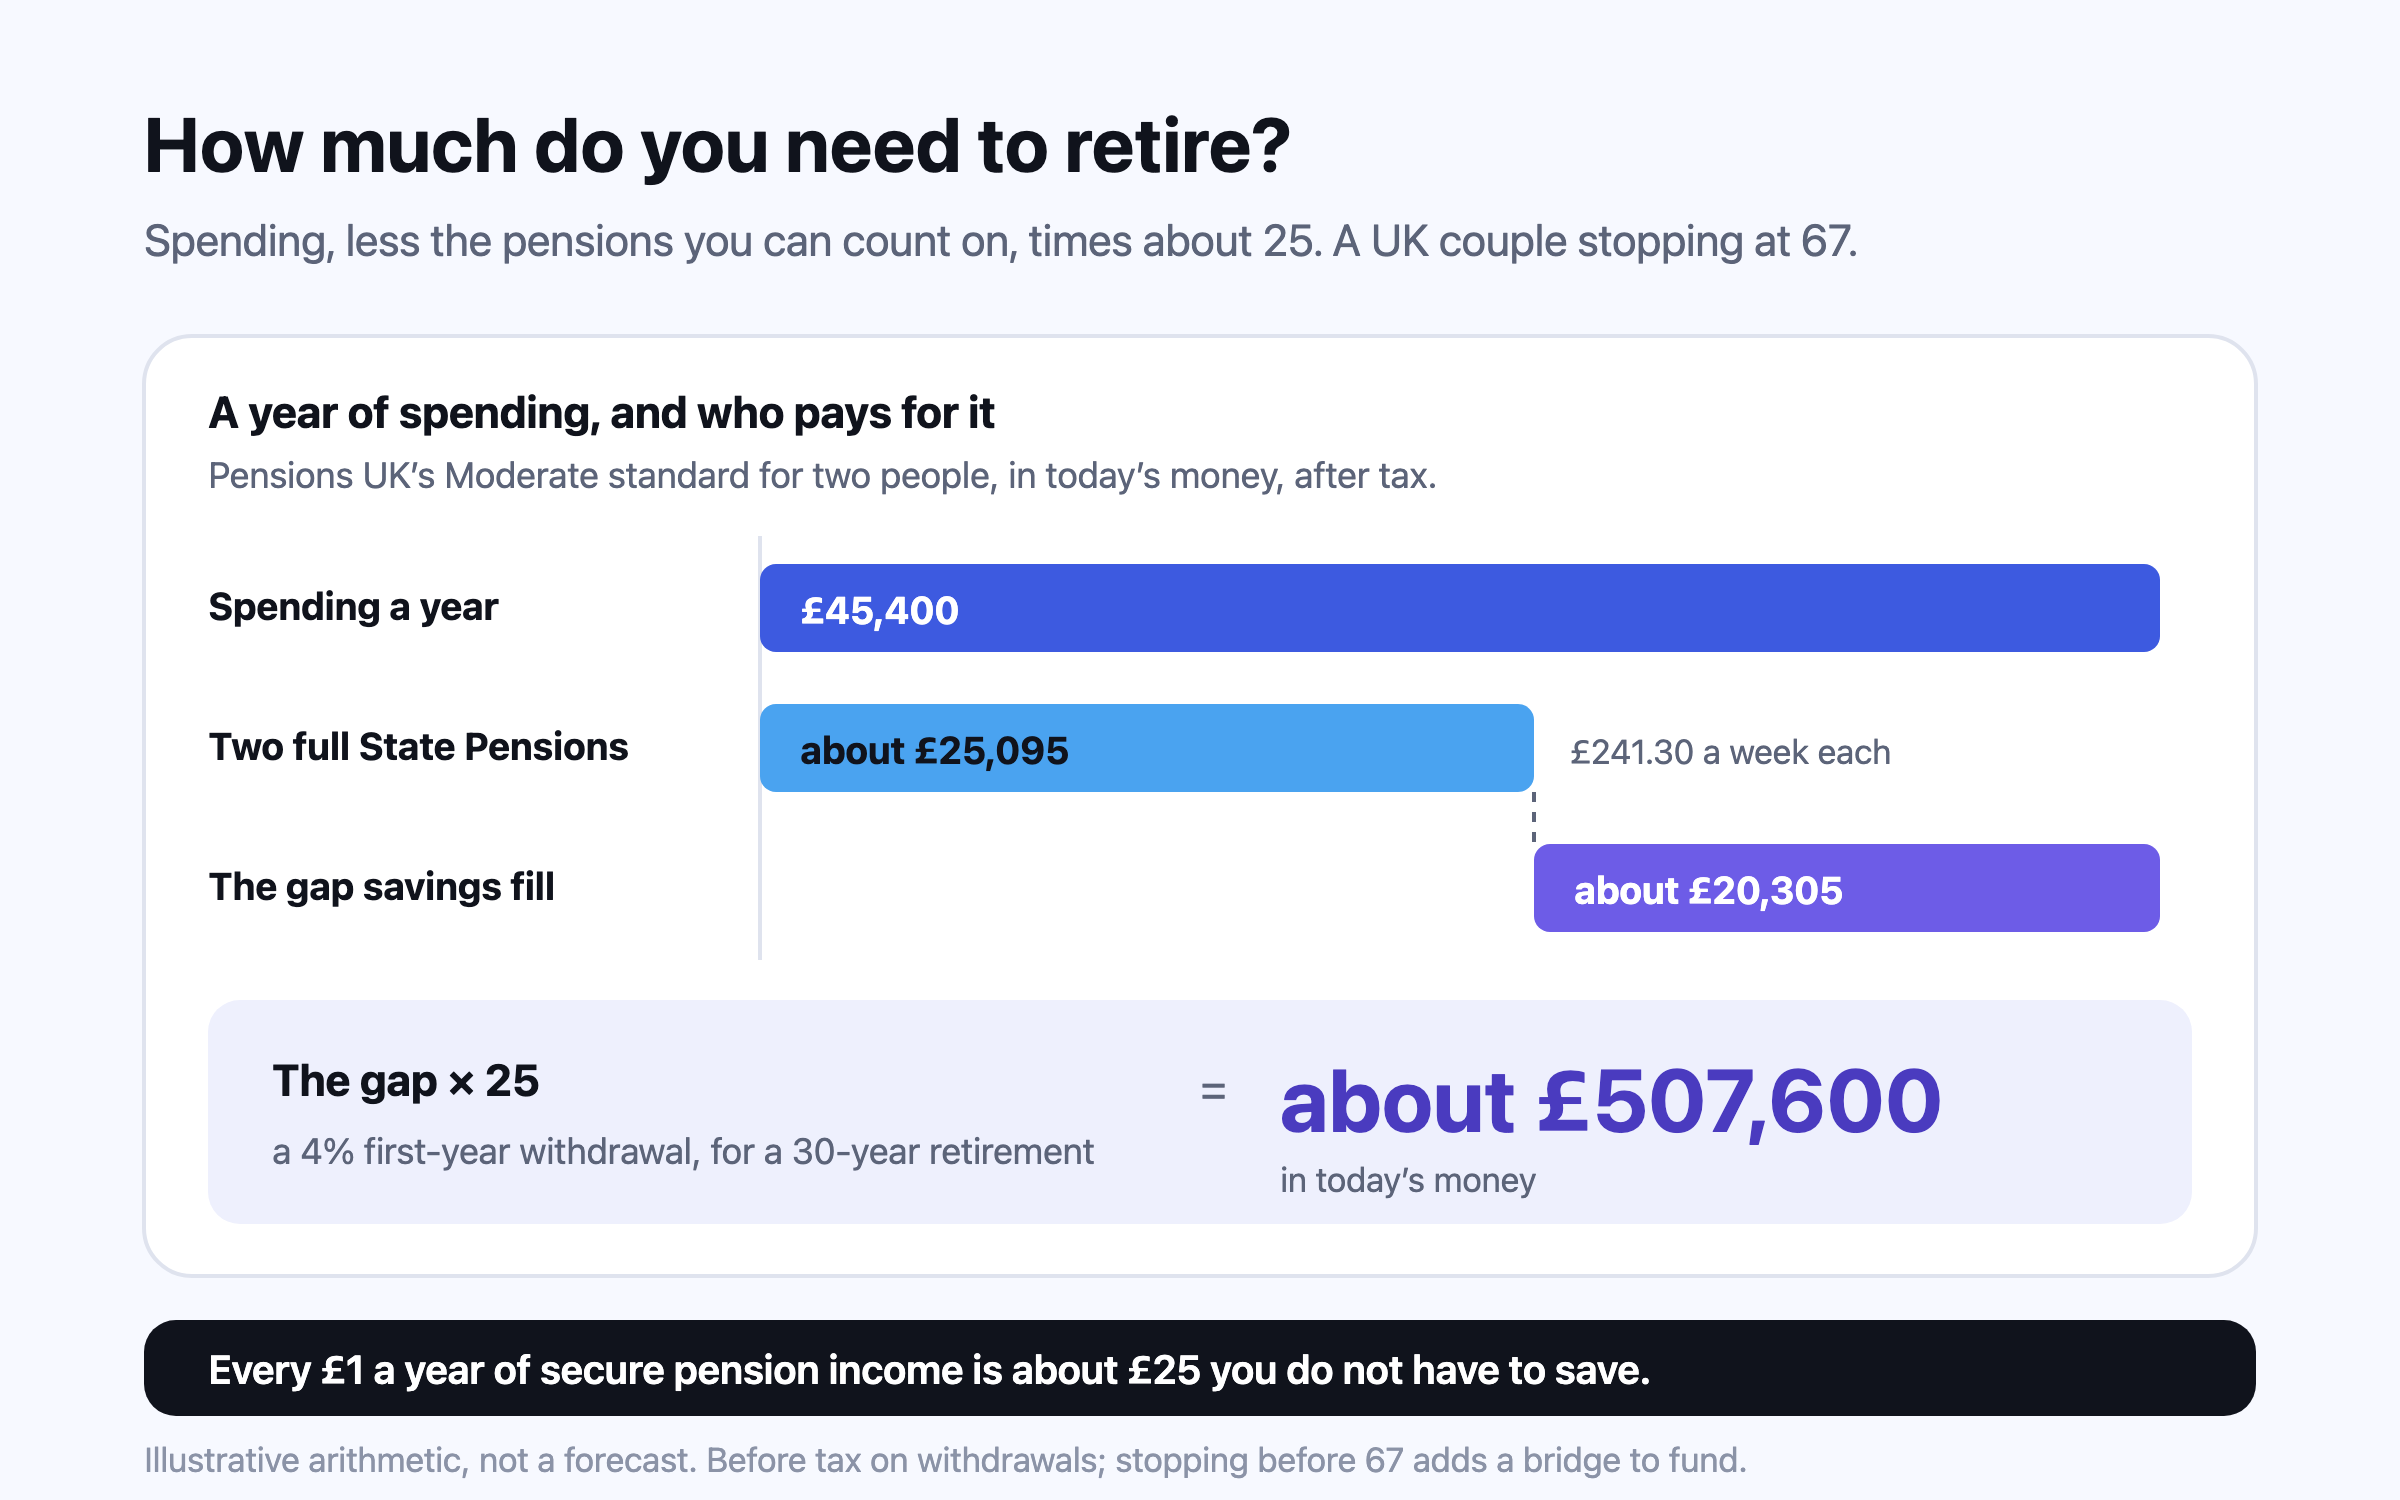
Gareth and Helen, both 60, Bristol. They own their home and aim for the Moderate standard of £45,400 a year9. With 35 qualifying years each, both get the full new State Pension of £241.30 a week from 67, about £25,095 a year together12. The gap of about £20,305 needs about £507,600 at 25 times; the Comfortable standard, £62,700, needs about £940,100. Workplace pension income is taxable, so they gross up the gap before multiplying, and they check their State Pension forecasts, because gaps in a National Insurance record mean a smaller pension12.
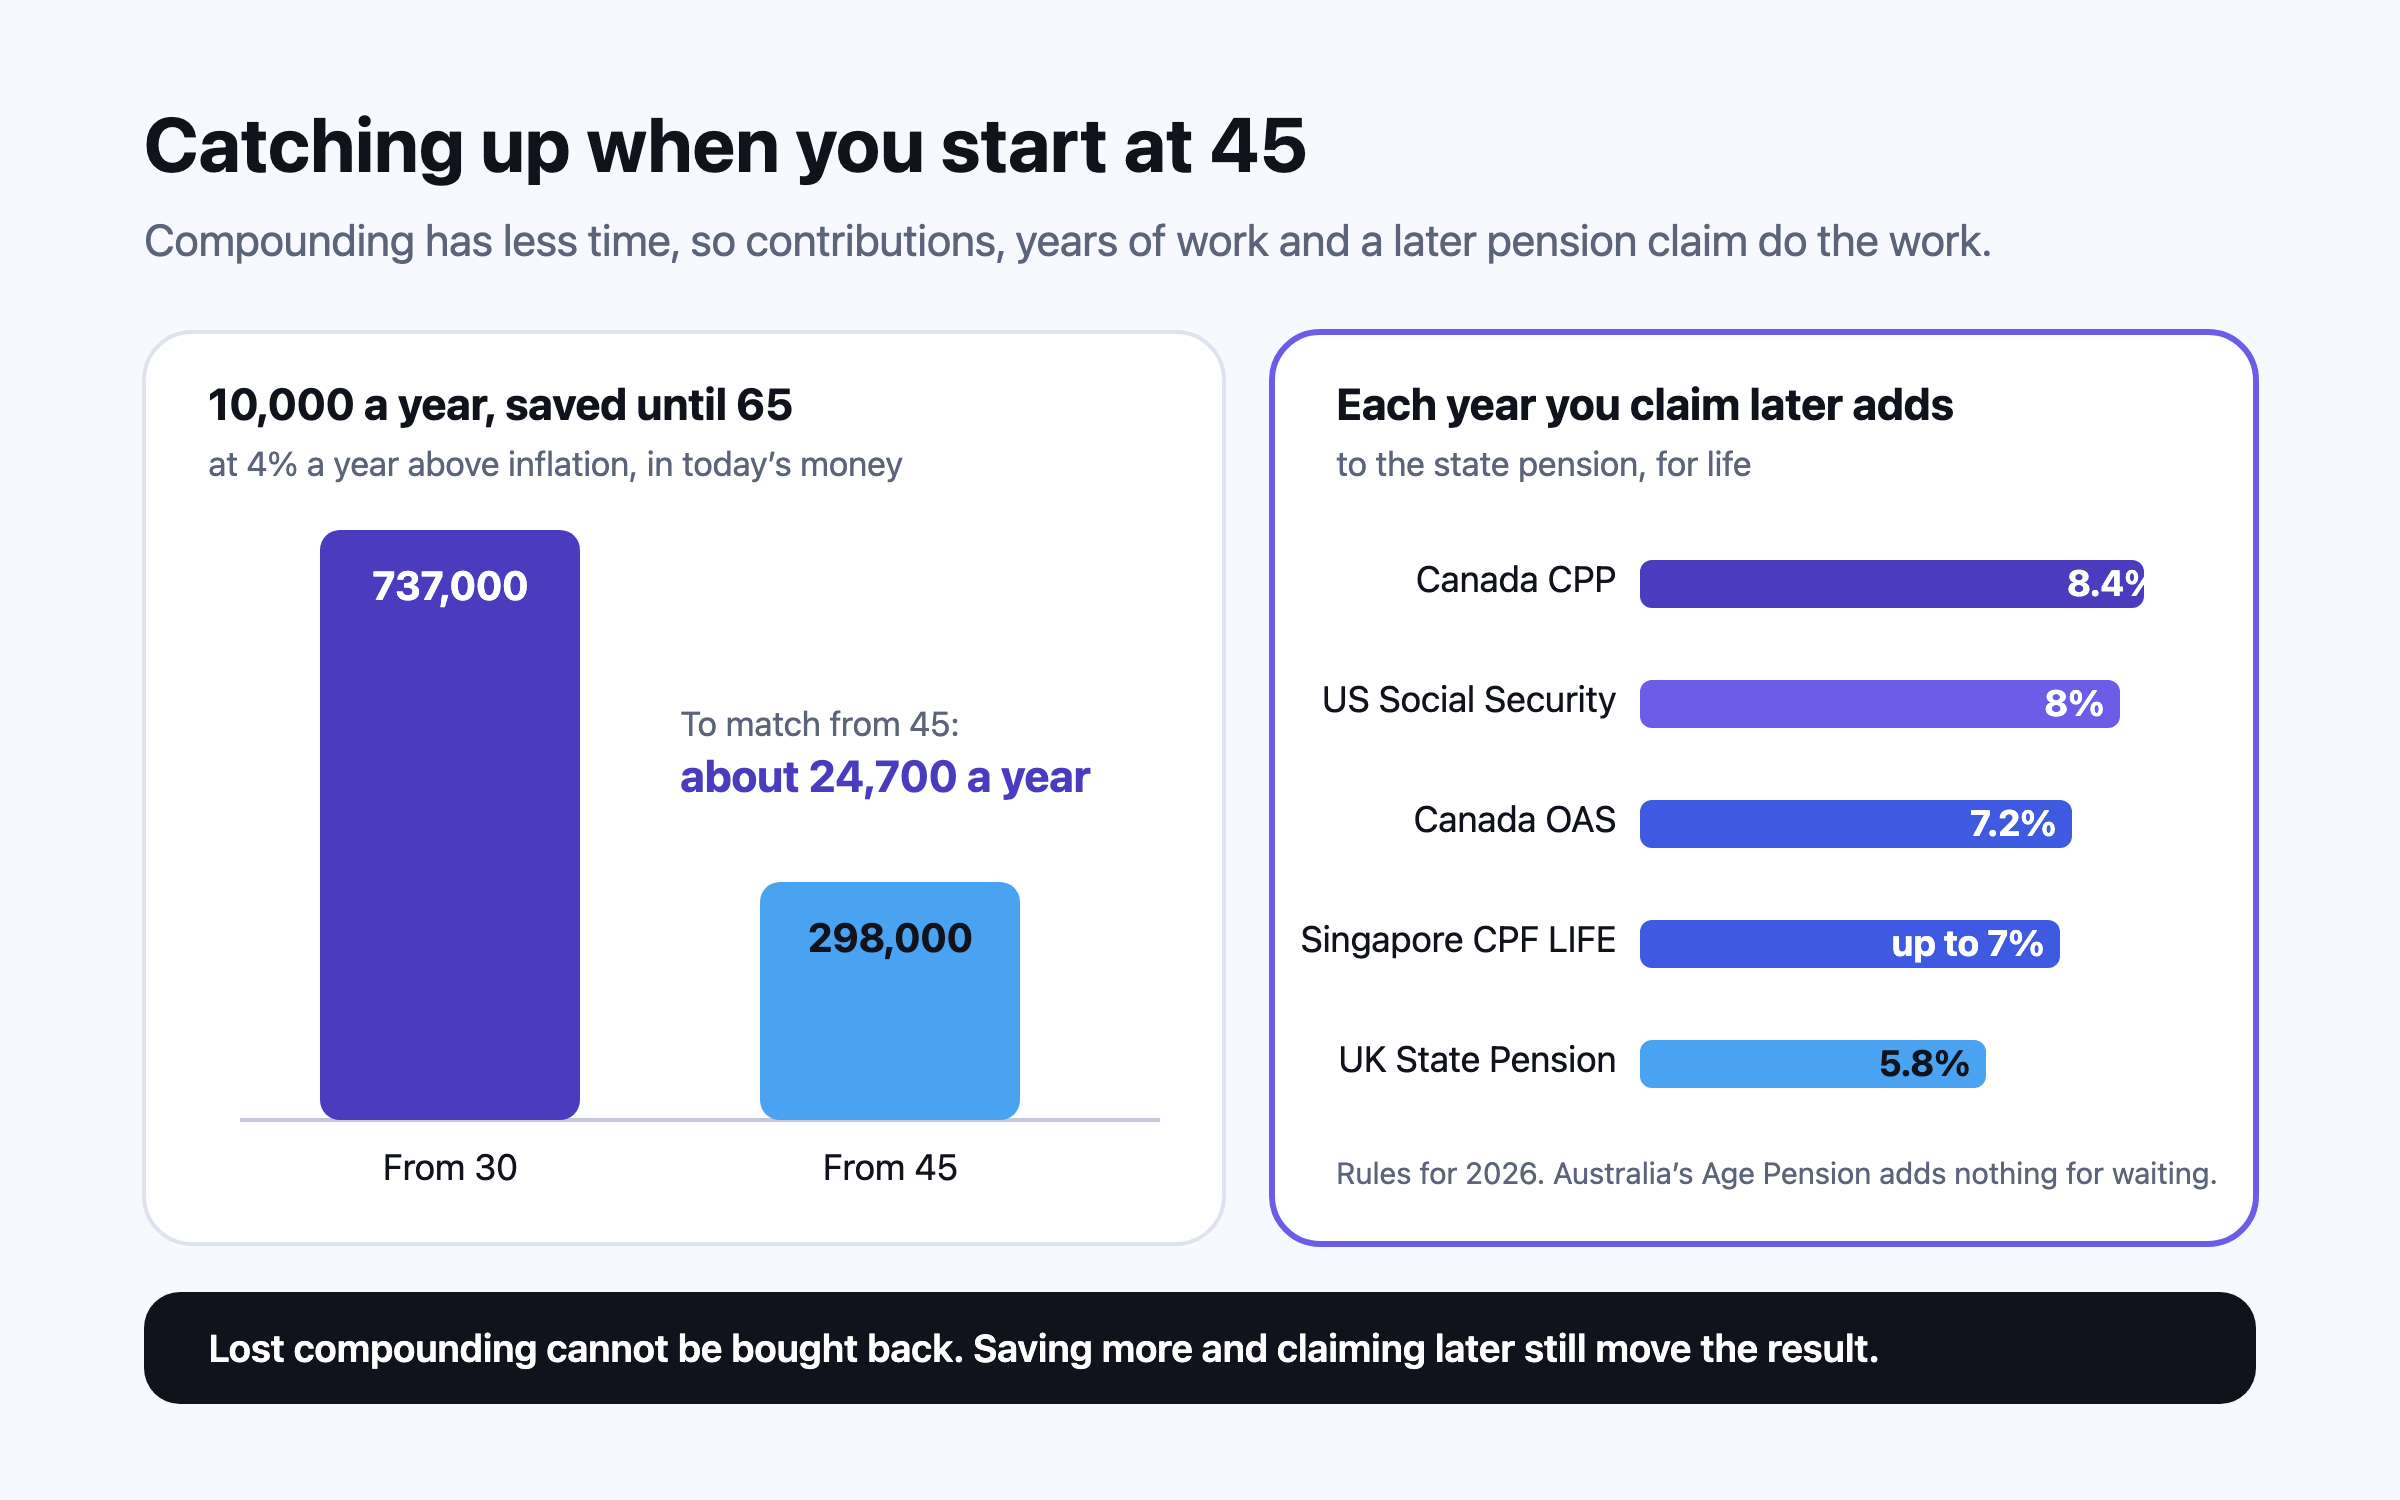
Raj and Simran, both 63, Ottawa. They spend C$90,000 a year. At 65 Raj’s CPP is C$1,300 a month and Simran’s C$900, against a 2026 maximum of C$1,507.65 and an average for new pensioners of C$858.3413, and each gets the full Old Age Security of C$762.50 a month for October to December 202614. That is C$44,700 a year, so savings must cover C$45,300: about C$1,132,500. Starting CPP at 70 rather than 65 raises it by 42%, so Raj’s C$1,300 would become C$1,846, indexed to prices and paid for as long as he lives — the trade is five more years drawn from savings first19.
Craig and Kate, both 60, Brisbane. They own their home and want ASFA’s comfortable standard, A$78,998 a year for a couple10. The Age Pension starts at 67 and is means-tested: from 20 September 2026 a homeowner couple with assessable assets above A$1,121,000 gets none, while a couple on the full rate gets A$1,866 a fortnight, A$48,516 a year15. Funding all of their spending themselves at 25 times needs A$1,974,950. ASFA’s A$730,000, which assumes a part pension and capital spent down10, is the other end of the range. The honest answer for them lies between the two, and the further their balance falls, the more Age Pension tops it up.
Li Ting and Jun, both 55 this year, Singapore. They expect to spend S$6,000 a month, S$72,000 a year, from 65. If each sets aside the 2026 Full Retirement Sum of S$220,400 in their Retirement Account, CPF LIFE’s Standard Plan is estimated to pay each about S$1,780 a month from 6516, S$42,720 a year together. The S$29,280 gap needs S$732,000 of their own savings at 25 times. Topping up to the Enhanced Retirement Sum of S$440,800 would raise each estimate to about S$3,440 a month16, which would close the gap entirely — at the price of locking that money into the annuity. One catch either way: the Standard Plan pays a level amount that does not rise with prices, while the Escalating Plan starts lower and rises 2% a year20, so in a plan kept in today’s money the Standard Plan’s payout buys a little less each year.
Suresh and Lata, 50 and 48, Chennai. They spend ₹12 lakh a year and want to stop at 55. India pays no state pension to everyone, and Suresh’s EPS pension is small by design: pensionable salary × service ÷ 70, with the salary capped at ₹6,500 a month for service before September 2014, ₹15,000 after that and ₹25,000 from September 2026, and drawing it at 55 rather than 58 cuts it by 4% for each year short2122. They leave it out of the target and treat it as a margin. A 40-year horizon puts them at Morningstar’s 3.3%, about 30 times3, so the target is ₹3.6 crore in today’s money. India also targets higher inflation than Britain or America — the Reserve Bank aims for 4% within a band of 2% to 6%23 — so at 4% a year the same target is about ₹4.38 crore by the time Suresh is 55.
Chloe, 42, Manchester, wants to stop at 55. Her spending is £30,000 a year. The State Pension does not start until 67, so the twelve years from 55 must be funded in full: £360,000 in today’s money, if her savings just keep pace with inflation in that time. From 67 the full State Pension of £241.30 a week, about £12,548 a year, leaves about £17,452 to fund, about £436,300 at 25 times12. Her target is therefore about £796,300 — about 80% more than somebody with the same spending who stops at 67 would need. That assumes she still reaches the 35 qualifying years a full State Pension needs; if she started work at 22 she would have 33 by 55, so she checks her forecast and what the missing years would cost to fill12. Early financial independence is mostly a problem of funding the bridge, which is why the FIRE movement’s arithmetic leans so hard on the savings rate.
Today’s money and tomorrow’s
Every target above is in today’s money, which is the honest way to think about it: about £507,600 means the buying power that sum has now. To see the figure needed on the day you stop, grow it by inflation. At the Bank of England’s 2% target24, Gareth and Helen’s target becomes about £583,100 in seven years. Planning in today’s money and assuming investment returns after inflation keeps both sides of the sum in the same units, and stops a large future number from looking either frightening or reassuring.
Five mistakes that move the number most
Using gross income instead of spending. A household saving a quarter of its pay does not need to replace that quarter.
Counting the home as retirement money. You cannot spend a house you live in without selling it or moving somewhere cheaper.
Forgetting the bridge. Years before a state pension starts must be funded in full.
Planning to the average age. About half of people outlive it.
Treating a pension forecast as a certainty. The 2026 Social Security Trustees Report projects that the US retirement trust fund will be depleted in the fourth quarter of 2032, after which income would cover 78% of scheduled benefits unless the law changes25.
The last point cuts both ways. Lawmakers have acted before when a trust fund ran low — the 1983 amendments raised the full retirement age to 67 — and a cut may never come; but a careful plan tests what happens if a pension arrives later or smaller than the statement says, including a reform that arrives as a later age, as the last big one did. Catching up on retirement savings covers what to do if the number looks out of reach.
Finding your own number
Questions people ask
How much do I need to retire?
Take the yearly spending you expect after you stop, subtract the pensions you can count on, and multiply by about 25 for a 30-year retirement (a 4% withdrawal rate)1. For 40 years, Morningstar’s estimate of 3.3% means closer to 30 times3.
Do you really need 70% to 80% of your income in retirement?
Not necessarily. Spending, not income, is what matters, and many costs of working stop. Mandatory pensions replace 63.2% of net pay for an OECD average earner but far less for higher earners, so a percentage of income tells you little about your own gap4.
Does spending go down in retirement?
On average, yes. Blanchett found US retirees’ real spending fell by approximately 1% a year, more gently at the start and end of retirement than in the middle7. Healthcare tends to rise in the late years.
How much do you need to retire comfortably in the UK?
Pensions UK’s Comfortable standard is £45,400 a year for one person and £62,700 for two, after tax, for homeowners9. With two full State Pensions of £241.30 a week each12, a couple’s gap is about £37,605, or about £940,100 at 25 times.
How much super do I need to retire comfortably in Australia?
ASFA estimates A$730,000 for a homeowner couple retiring at 67 and A$630,000 for a single person, assuming a part Age Pension and capital spent down10. Funding the A$78,998 comfortable budget entirely from savings at 25 times would take far more.
How much should I plan for healthcare in retirement?
In the US, Fidelity estimates $185,500 per 65-year-old in 2026, excluding long-term care5. Elsewhere state systems cover more, but plan a separate line for what they do not cover, rising faster than general inflation11.
What age should I plan to live to?
Beyond the average. At 65, men in the OECD can expect to reach 83.5 and women 86.6 on average6; about half live longer, so many planners use 90 or 95.
How do I calculate my retirement corpus in India?
Use the same sum with a longer horizon and higher inflation: spending × about 30 for a 40-year retirement3, in today’s money, then grow it by inflation to the year you stop — the RBI targets 4%23. There is no universal state pension to subtract, and the EPS pension is limited by a wage ceiling of ₹15,000 a month for most service so far, raised to ₹25,000 in September 20262122.
For a man on average pay, mandatory pensions replace 63.2% of net earnings on the OECD average, but around half in the US, UK, Australia and Germany and less in Canada, New Zealand, Japan and India. At twice average pay the share falls further, and Singapore, Hong Kong and India rely mostly on the worker’s own account. Here is what each system pays in 2026, how claiming age changes it, and what it leaves a middle-class household to save.
Most households in their late forties have less put by than the rules of thumb say, and in the US fewer than two in three families aged 45–54 hold a retirement account at all. Fifteen or twenty years is still long enough to change the result, but not through returns: the levers that work are a much higher saving rate, using the catch-up and carry-forward rules each country offers, working a few more years, and claiming the state pension later.
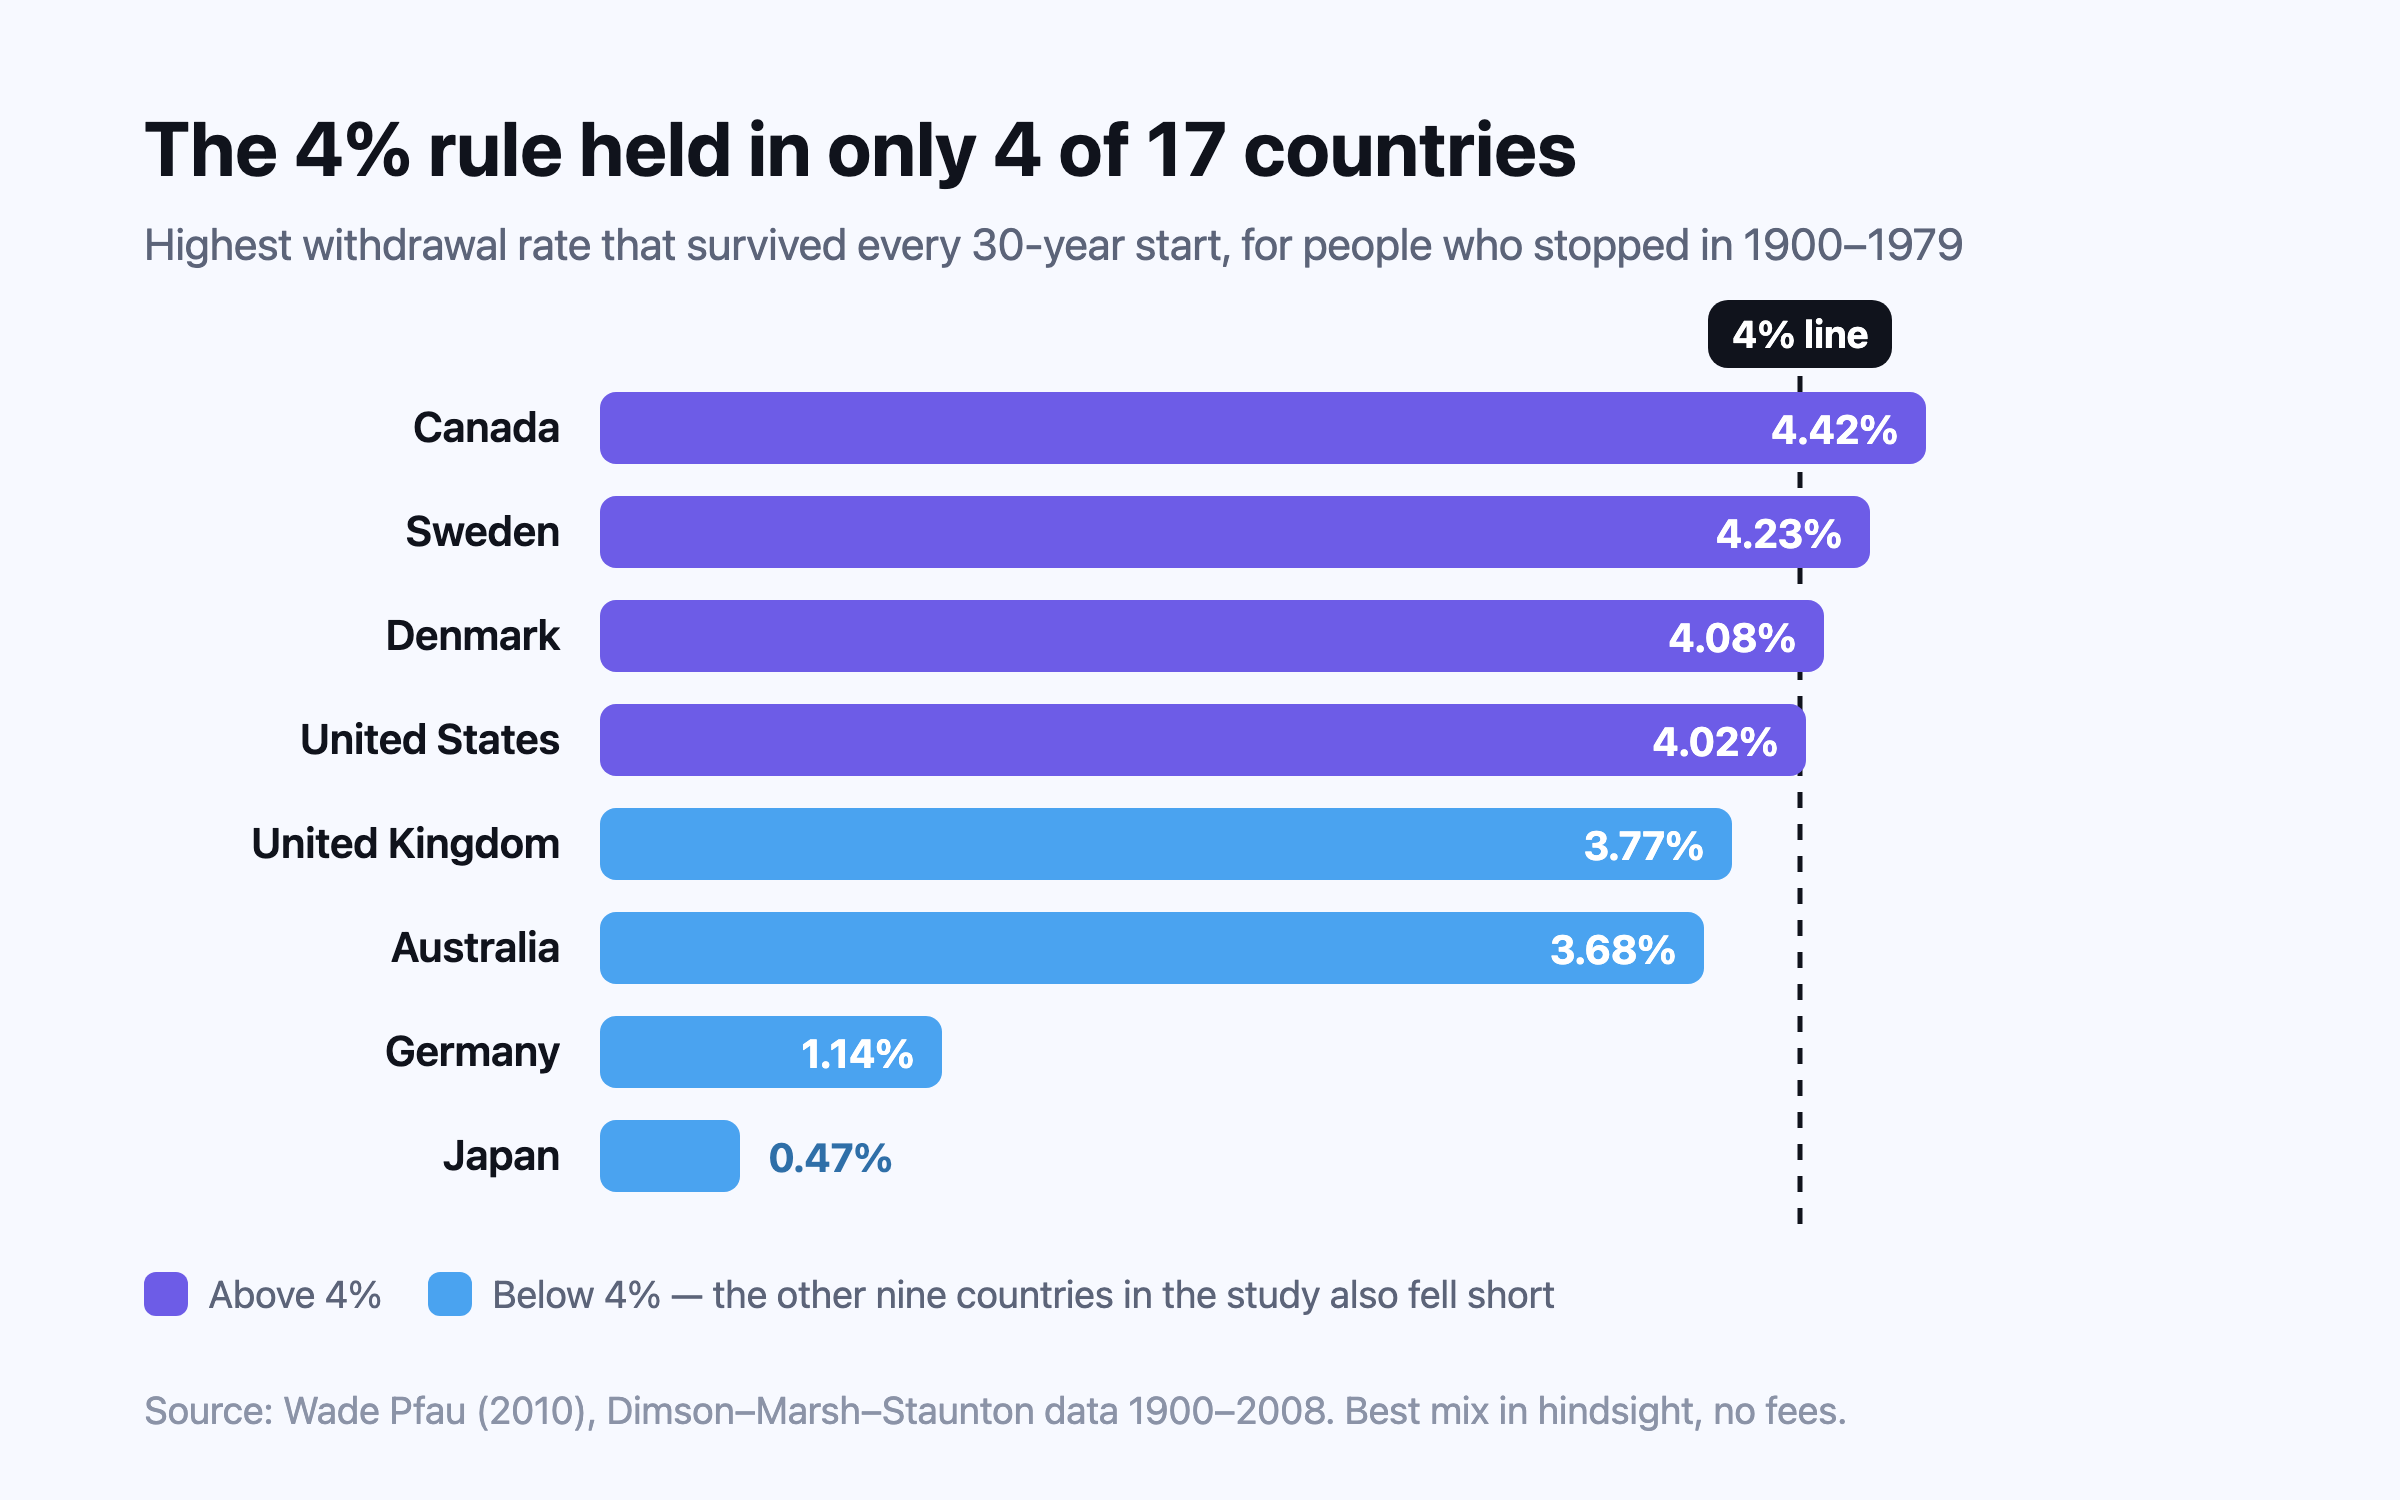
The 4% rule says a first-year withdrawal of 4% of savings, raised with inflation each year, lasted at least 30 years in US market history. Tested across 17 countries it held in only four, and longer horizons need lower rates — so treat it as a starting point to test against your own spending, country and timeline.
This is general information, not financial, tax or legal advice for your circumstances. Rules and figures change; check the official source for your country, and consult a licensed professional before making financial decisions. Projections are estimates, not predictions.