A family balance sheet is one page: what you own at a value you could actually get, what you owe today, and the difference. Built honestly, it is the most useful money document a household keeps.
A family balance sheet lists everything the household owns at a value it could realise and everything it owes at what it would take to settle today. Value investments at market, not cost; the home cautiously, after selling costs; pensions only where vested. Then separate net worth from the smaller figure that can actually fund your independence, and update it on the same date each year.
Nivritee Research · 2 July 2026 · updated 15 October 2026 · 8 min read
Most households can say roughly what they earn. Far fewer can say what they are worth, and fewer still could hand a partner one page showing every account, property and loan. A family balance sheet is that page. Companies have produced one every year for centuries because it answers questions an income statement cannot: what is there, what is owed against it, and how much of it could be turned into money if it were needed.
This guide covers what to list, how to value each item so the total means something, the difference between net worth and the money that can actually fund your independence, a worked household, and how to track the figure over time without being misled by markets.
Two columns and one subtraction
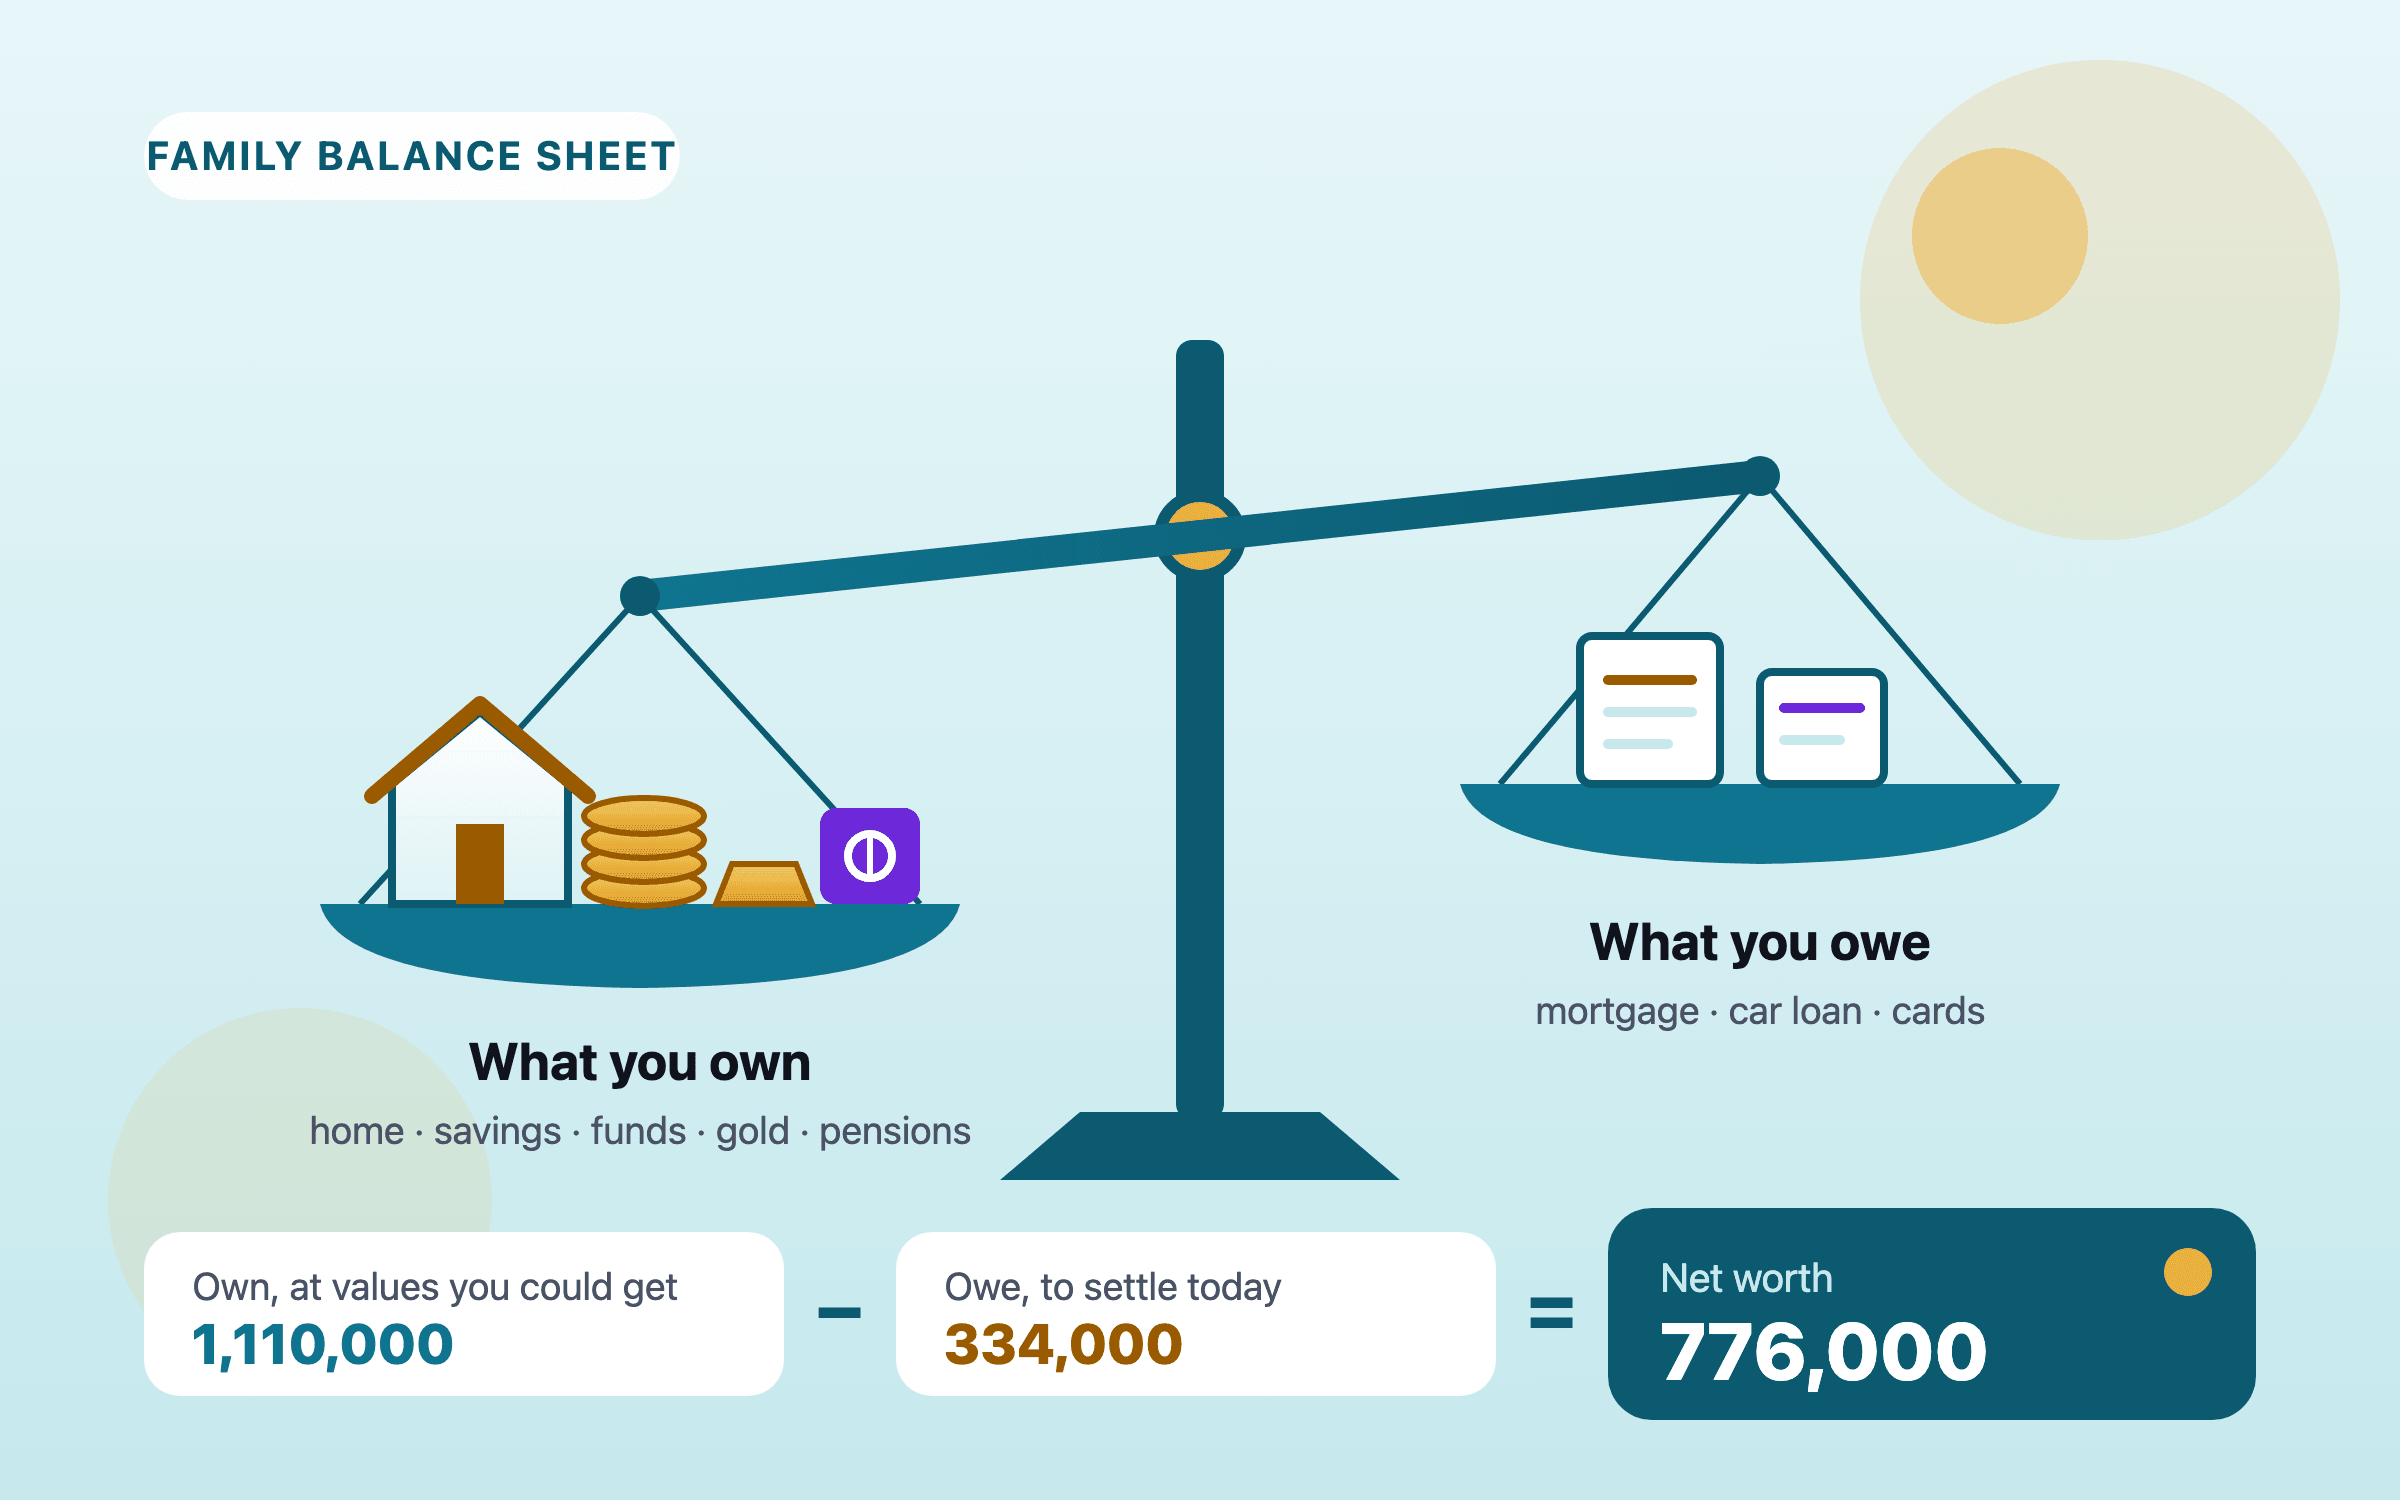
A balance sheet has two columns. Assets are everything the household owns that has a value. Liabilities are everything it owes. Net worth is assets minus liabilities. That is the whole of the arithmetic; the skill is in what goes into each column and at what value.
Do it for the household, not for one person, and record who owns each line — you, your partner or both. A couple’s net worth is the sum of two people’s, and the split matters the day the two people need to know where things are. Write down the date too. A balance sheet is a photograph of one day, and it is only comparable with another photograph taken the same way.
What goes on the asset side
Cash — current and savings accounts, money market funds, cash at home.
Deposits — fixed and term deposits, recurring deposits, government savings certificates.
Market investments — shares, mutual funds, ETFs and bonds in your own name, here or abroad.
Retirement and provident accounts — workplace pensions, 401(k)s and IRAs, EPF, PPF and NPS, CPF, super, KiwiSaver, MPF. Each belongs to one person.
Property — the home you live in, and separately any home you let or plan to sell.
Gold and other metals — coins, bars and jewellery held for value.
A business or professional practice — your share of it, if it could be sold or wound up for something.
Other things with a resale value — a car, money lent to family that will genuinely come back, a deposit held by a landlord.
The mix varies enormously by country. In Great Britain, net property wealth was 40% of all household wealth between April 2020 and March 2022, private pensions 35%, net financial wealth 14% and physical wealth such as vehicles and contents 10%.1 In India the Reserve Bank’s Household Finance Committee found the average household held 77% of its assets in real estate, 7% in other durable goods, 11% in gold and only 5% in financial assets.2 A balance sheet built for an Indian family is mostly a question of valuing property and gold well; one for a British family is as much about pensions.
Where household wealth sits: Great Britain against India, as a share of the total
Property
Pensions and financial assets
Gold, vehicles and other physical assets
Great Britain is net of mortgages and other debt and sums to 99 because of rounding; India is the composition of gross assets. In both, the largest single item is property, and in India almost nothing is in financial assets a family could sell in a week. 1,2The figures in this chart
Property
Pensions and financial assets
Gold, vehicles and other physical assets
Great Britain (2020–22)
40%
49%
10%
India (2017 report)
77%
5%
18%
Valuation rules that keep the total honest
A net worth figure is only as good as its valuations, and every error people make runs in the same direction: upwards. Seven rules keep it honest.
Market value, not what you paid. A fund bought for 160,000 and worth 220,000 today goes in at 220,000; one that has fallen goes in at its lower value. Use the last published price or close, and say which day.
Deposits at what they are worth today — the principal plus interest earned so far. If you might need to break one, know the cost: at State Bank of India the rate is cut by 0.5 percentage points on a deposit up to ₹5 lakh broken early, and by 1 point above that.3
The home at a conservative value. Use recent sales of similar homes nearby rather than the asking prices of homes still for sale, and subtract what it would cost to sell: agents, taxes, legal fees. Selling takes time and does not always happen — in England a purchase takes an average of 120 days to complete and around one in three fall through.4
Pensions only where they are yours. In a US 401(k), your own contributions are always 100% vested, but an employer’s can follow a schedule — nothing until year three under cliff vesting, or a share that rises each year to full ownership by year six under graded vesting.5 Count only the vested balance; the rest belongs to your employer until it doesn’t. The same goes for unvested share awards.
Gold at its metal value, at today’s price for its purity. The making charges paid for jewellery do not come back when it is sold.
A business or a car at what it would fetch, not what it cost or what it might be worth in a good year. If you cannot name a buyer, value it cautiously or leave it out and note that you have.
Money abroad at today’s exchange rate, all in one reporting currency, so the total is one number rather than three.
The liability side
List every debt at the amount it would take to settle it today: the outstanding principal on a mortgage or car loan, the full balance on a credit card (not the minimum payment), any overdraft, a loan from an employer or a relative, tax you know is due. A monthly payment is not a liability; the balance behind it is.
Keep secured and unsecured debts apart. A mortgage is set against the home it is secured on, and the difference is your home equity. A credit-card balance is set against nothing, and it is the first line to clear because it usually carries the highest rate. Which debt to pay off first covers the order.
Net worth is not the money you can live on
Net worth answers “how much is there?”. A plan for financial independence asks a narrower question: how much can pay for life once the salary stops? Two adjustments turn the first figure into the second.
Take out the home you live in. You need somewhere to live, so its value cannot pay for your spending unless you sell and move somewhere cheaper. Nivritee keeps it in your net worth but leaves it out of the corpus that funds independence, while a property you let does count.6
Mark what is locked. Retirement money counts towards independence but often cannot be reached before an access age: 59½ for a US 401(k) or IRA without an extra 10% tax,7 55 for withdrawals from Singapore’s CPF,8 60 for Australian super if you were born on or after 1 July 1964.9
What is left — cash, deposits, market investments and retirement accounts, less any debt not secured on the home — is investable wealth. It is usually much smaller than net worth, and it is the figure your independence actually depends on.
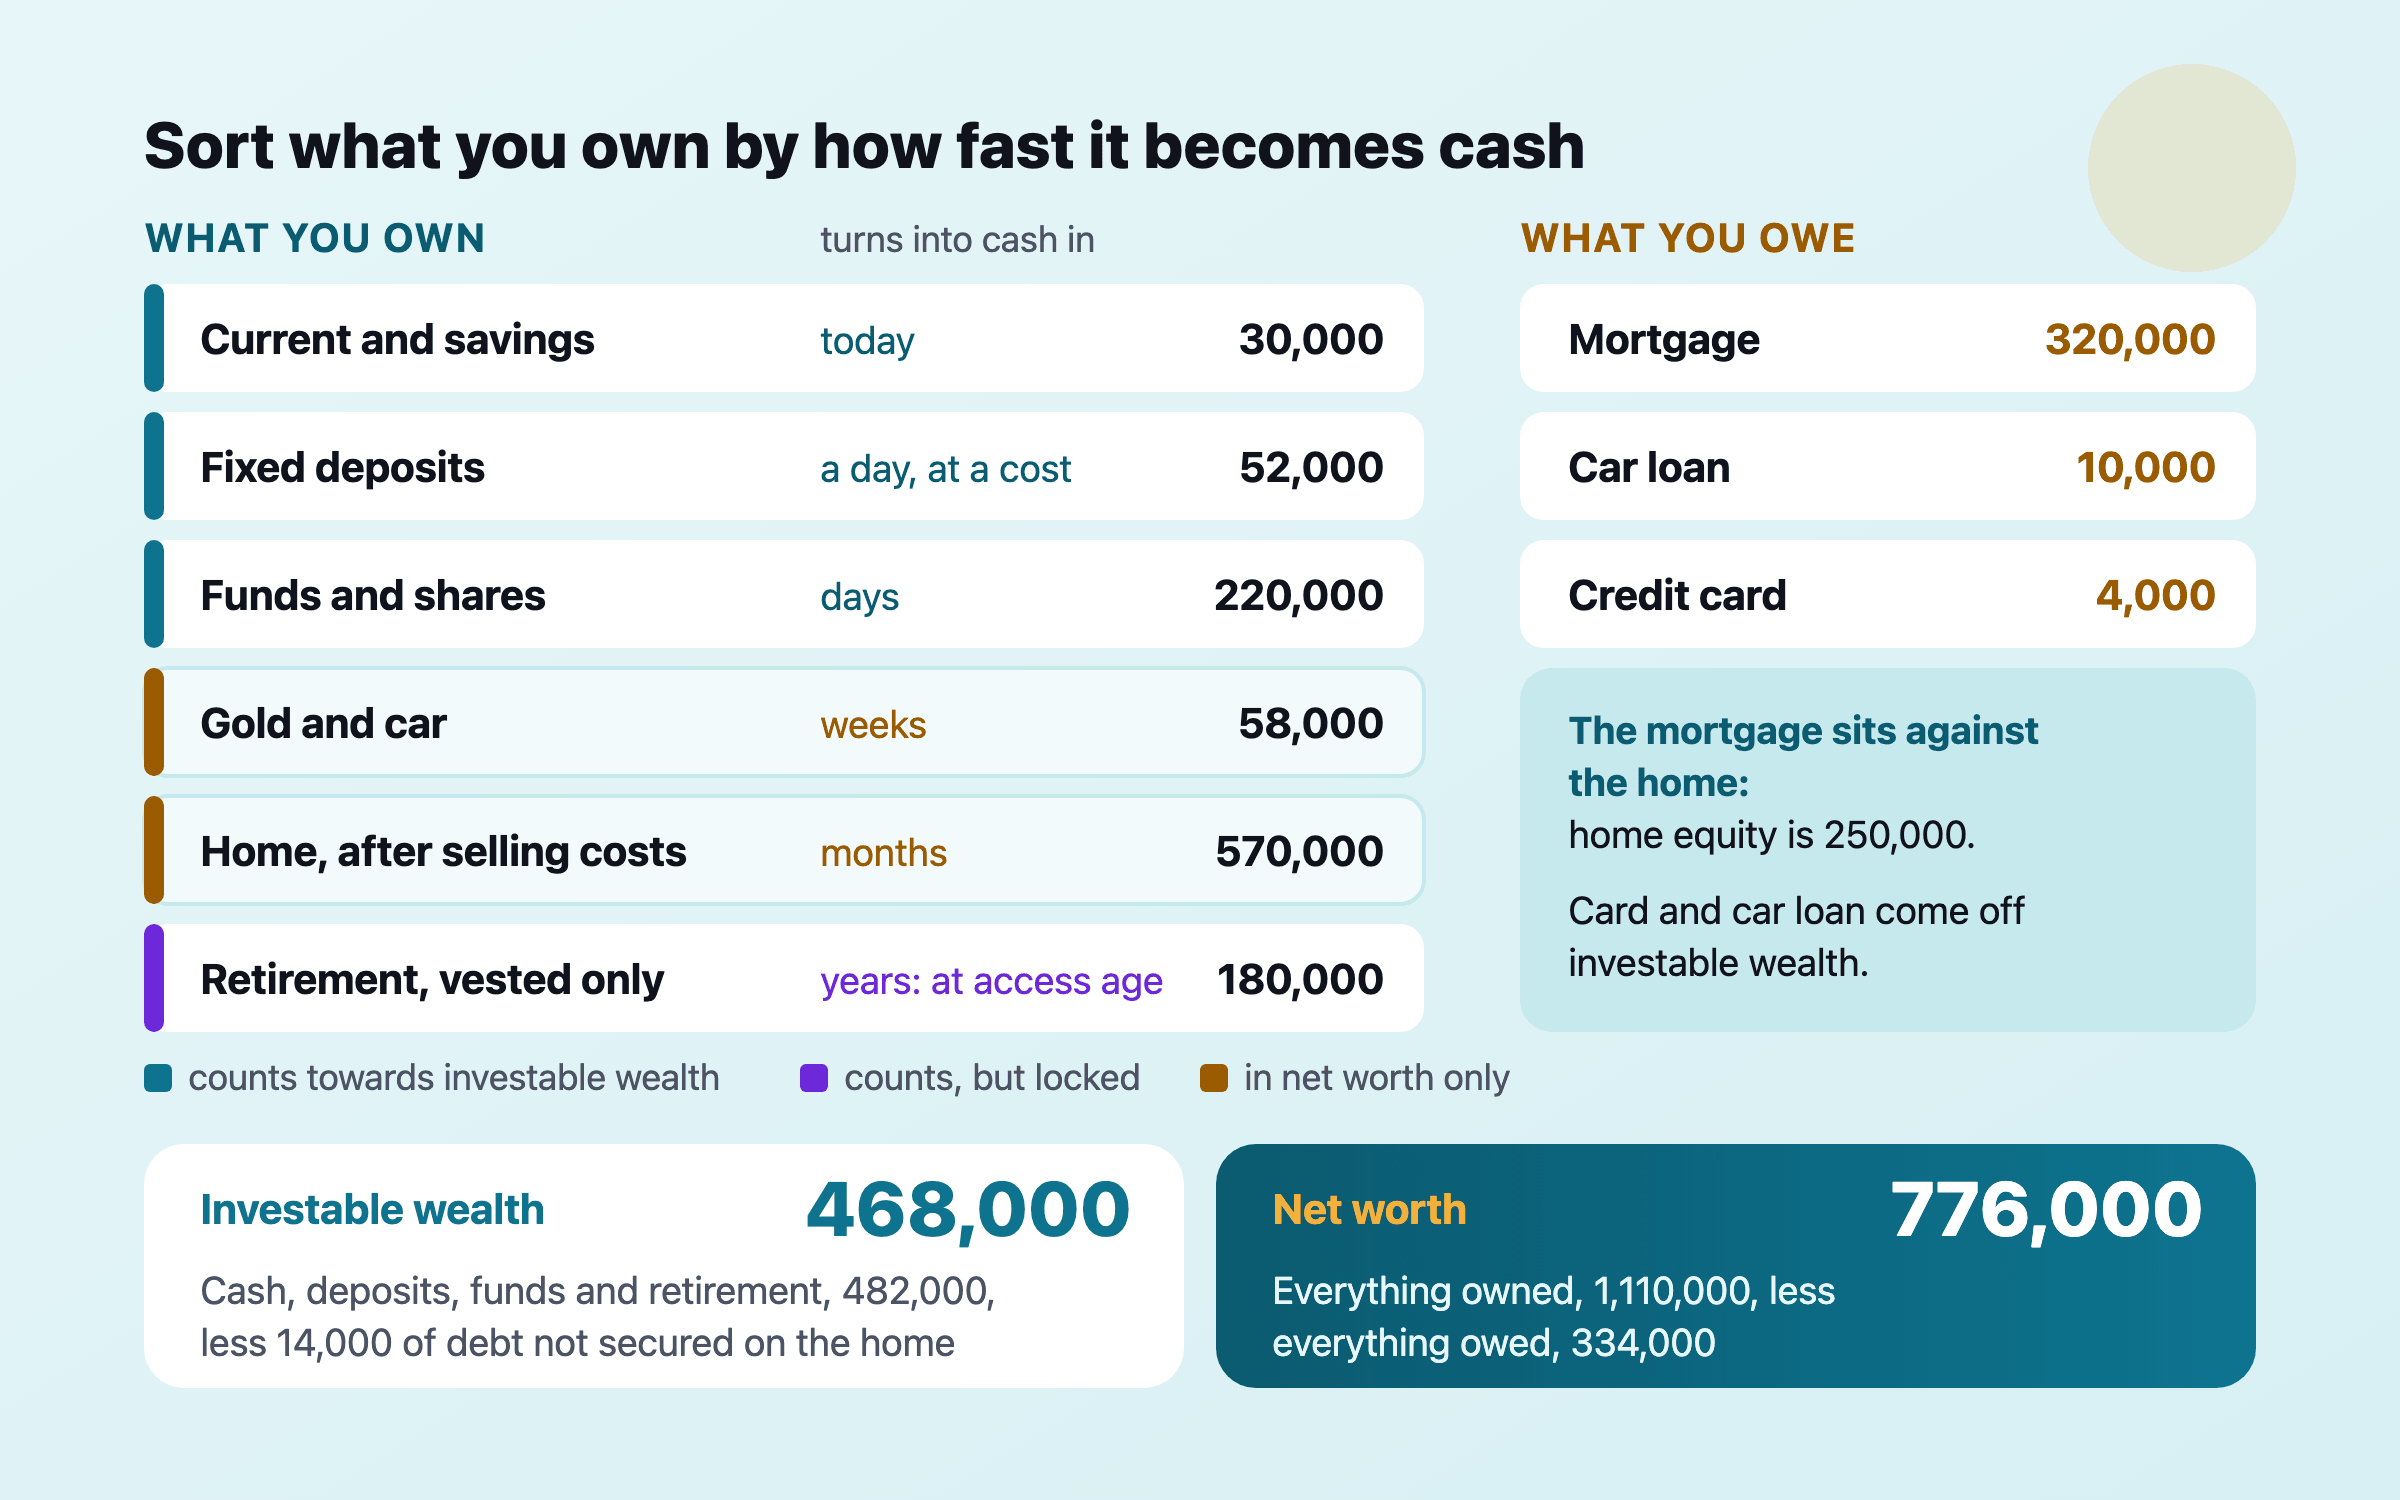
Sort the asset column by how quickly each item becomes cash. Net worth is everything less everything owed; investable wealth leaves out the home and the things you would never sell.
A worked household
An illustrative couple in their early forties, in round numbers and in whatever currency they report in. The table shows each line at the value the rules above give it.
An illustrative household, not a benchmark. Each value follows one of the rules above: market value, vested only, the home after selling costs, gold at metal value. 5,4
Line
How it is valued
Value
Current and savings accounts
Balance today
30,000
Fixed deposits
Principal of 50,000 plus interest earned so far
52,000
Funds and shares
Last close (they paid 160,000)
220,000
Retirement accounts
Vested balance only (20,000 of employer money not yet vested is left out)
180,000
Home
Recent sales of similar homes, 600,000, less 30,000 to sell
570,000
Gold and jewellery
Metal value today (they paid 55,000)
40,000
Car
Resale value
18,000
Total assets
1,110,000
Mortgage
Outstanding principal
320,000
Car loan
Outstanding principal
10,000
Credit card
Statement balance
4,000
Total liabilities
334,000
Net worth
Assets less liabilities
776,000
Their net worth is 776,000. Had they used the flattering version — the home at 600,000, the unvested 20,000 counted and the jewellery at what they paid — they would have written down 841,000, about 65,000 more than they could actually realise.
Their investable wealth is cash 30,000, deposits 52,000, funds 220,000 and retirement accounts 180,000, which is 482,000, less the 14,000 of car loan and card debt: 468,000. The rest of the 776,000 is 250,000 of home equity, 40,000 of gold and an 18,000 car. So a household that is worth 776,000 has 468,000 working towards its independence, and 180,000 of that is locked until each partner reaches their scheme’s access age. Seen this way, the next decision is obvious: clear the 4,000 card balance, and check that the cash is at least the emergency fund they want — see how big an emergency fund should be.
How often to update it
Once a year, in full, on the same date — the start of the tax year or a birthday works. Revalue the home from recent sales, the gold at today’s price, the car at resale, and check every vesting schedule.
Once a month or once a quarter, lightly. Only the lines that move on their own: balances, fund values, loan principal. Fifteen minutes is enough if the list exists.
After anything large. A purchase, a sale, an inheritance, a new loan, a move between countries.
Do not update the home every month. Its value is an estimate whatever you do, and revising it often makes the total move for reasons that have nothing to do with your decisions.
What a typical balance sheet looks like
National surveys give a reference point, not a target. Median household wealth in Great Britain was £293,700 in April 2020 to March 2022, the household exactly in the middle once every household is lined up.1 In Canada, the median net worth of all families and unattached individuals was C$519,700 in 2023, rising from C$159,100 where the main earner is under 35 to C$873,400 at 55 to 64.10 Both include the home. Our study of household wealth by age across eleven countries sets these beside the United States, the euro area, Japan, Australia, New Zealand and India, and explains why medians and averages differ so much.
The comparison that matters more is with yourself a year ago. A household well below its national median at 35 may be exactly on course; one above it at 55 may still be short of what its own plan needs.
What moves net worth: saving or the market
Net worth changes for two reasons only. You add to it — by saving, or by repaying loan principal, which lowers a liability. Prices move it — markets, house prices, gold, exchange rates. The first is in your control and tells you whether the plan is working. The second is mostly noise in any single year.
Here is the worked household over five illustrative years, saving a little more each year and holding the home, gold and car at the same values so that only the investments move. Savings and loan repayments added 200,000; markets added 96,000, but not evenly: in year two they took away 42,000, more than that year’s saving of 38,000.
An illustrative household’s yearly change in net worth: what it saved against what markets did
Saved, including loan principal repaid
Market movement
Illustrative arithmetic: saving is steady and in the household’s control; market movement is larger in good years and negative in bad ones. The figures add 296,000 over five years, 200,000 of it saved. The figures in this chart
Saved, including loan principal repaid
Market movement
Year 1
36,000
18,000
Year 2
38,000
−42,000
Year 3
40,000
51,000
Year 4
42,000
30,000
Year 5
44,000
39,000
Over time the balance between the two shifts. With 468,000 invested, a fall of a tenth costs 46,800 — already more than a year’s saving. With a few times that, a single year of markets will usually move the total more than anything the household does. That is why a falling net worth after a bad year is not, on its own, a sign that anything has gone wrong, and why the savings line is the one to watch. To see what a severe year could do to your own plan, the FIRE Planner’s stress tests include a 2008-style crash — what each stress test assumes. When you want to know how your own investments have done, measure their return directly rather than reading it off net worth — what XIRR is explains how.
Add up everything the household owns at a value it could realise today — cash, deposits, investments at market value, vested pension balances, property after selling costs, gold at metal value — and subtract everything it owes at the amount needed to settle today. The difference is net worth.
Should I include my house in my net worth?
Yes, at a cautious value net of the mortgage and of selling costs. But keep it out of the money you expect to live on: you need somewhere to live, so its value funds your spending only if you sell and move somewhere cheaper.
Should I include my pension or 401(k) in net worth?
Include the vested balance only. In a US 401(k) your own contributions are always fully vested, but employer money can take up to six years to become yours under a graded schedule.5
What is the difference between net worth and investable assets?
Net worth is everything you own less everything you owe. Investable assets leave out the home you live in and things you would never sell, such as a car, so they are the part that can actually fund spending once you stop working.
How often should I update my net worth?
In full once a year, on the same date, and lightly every month or quarter for the lines that move on their own: balances, fund values and loan principal. Revaluing the home every month adds noise without adding information.
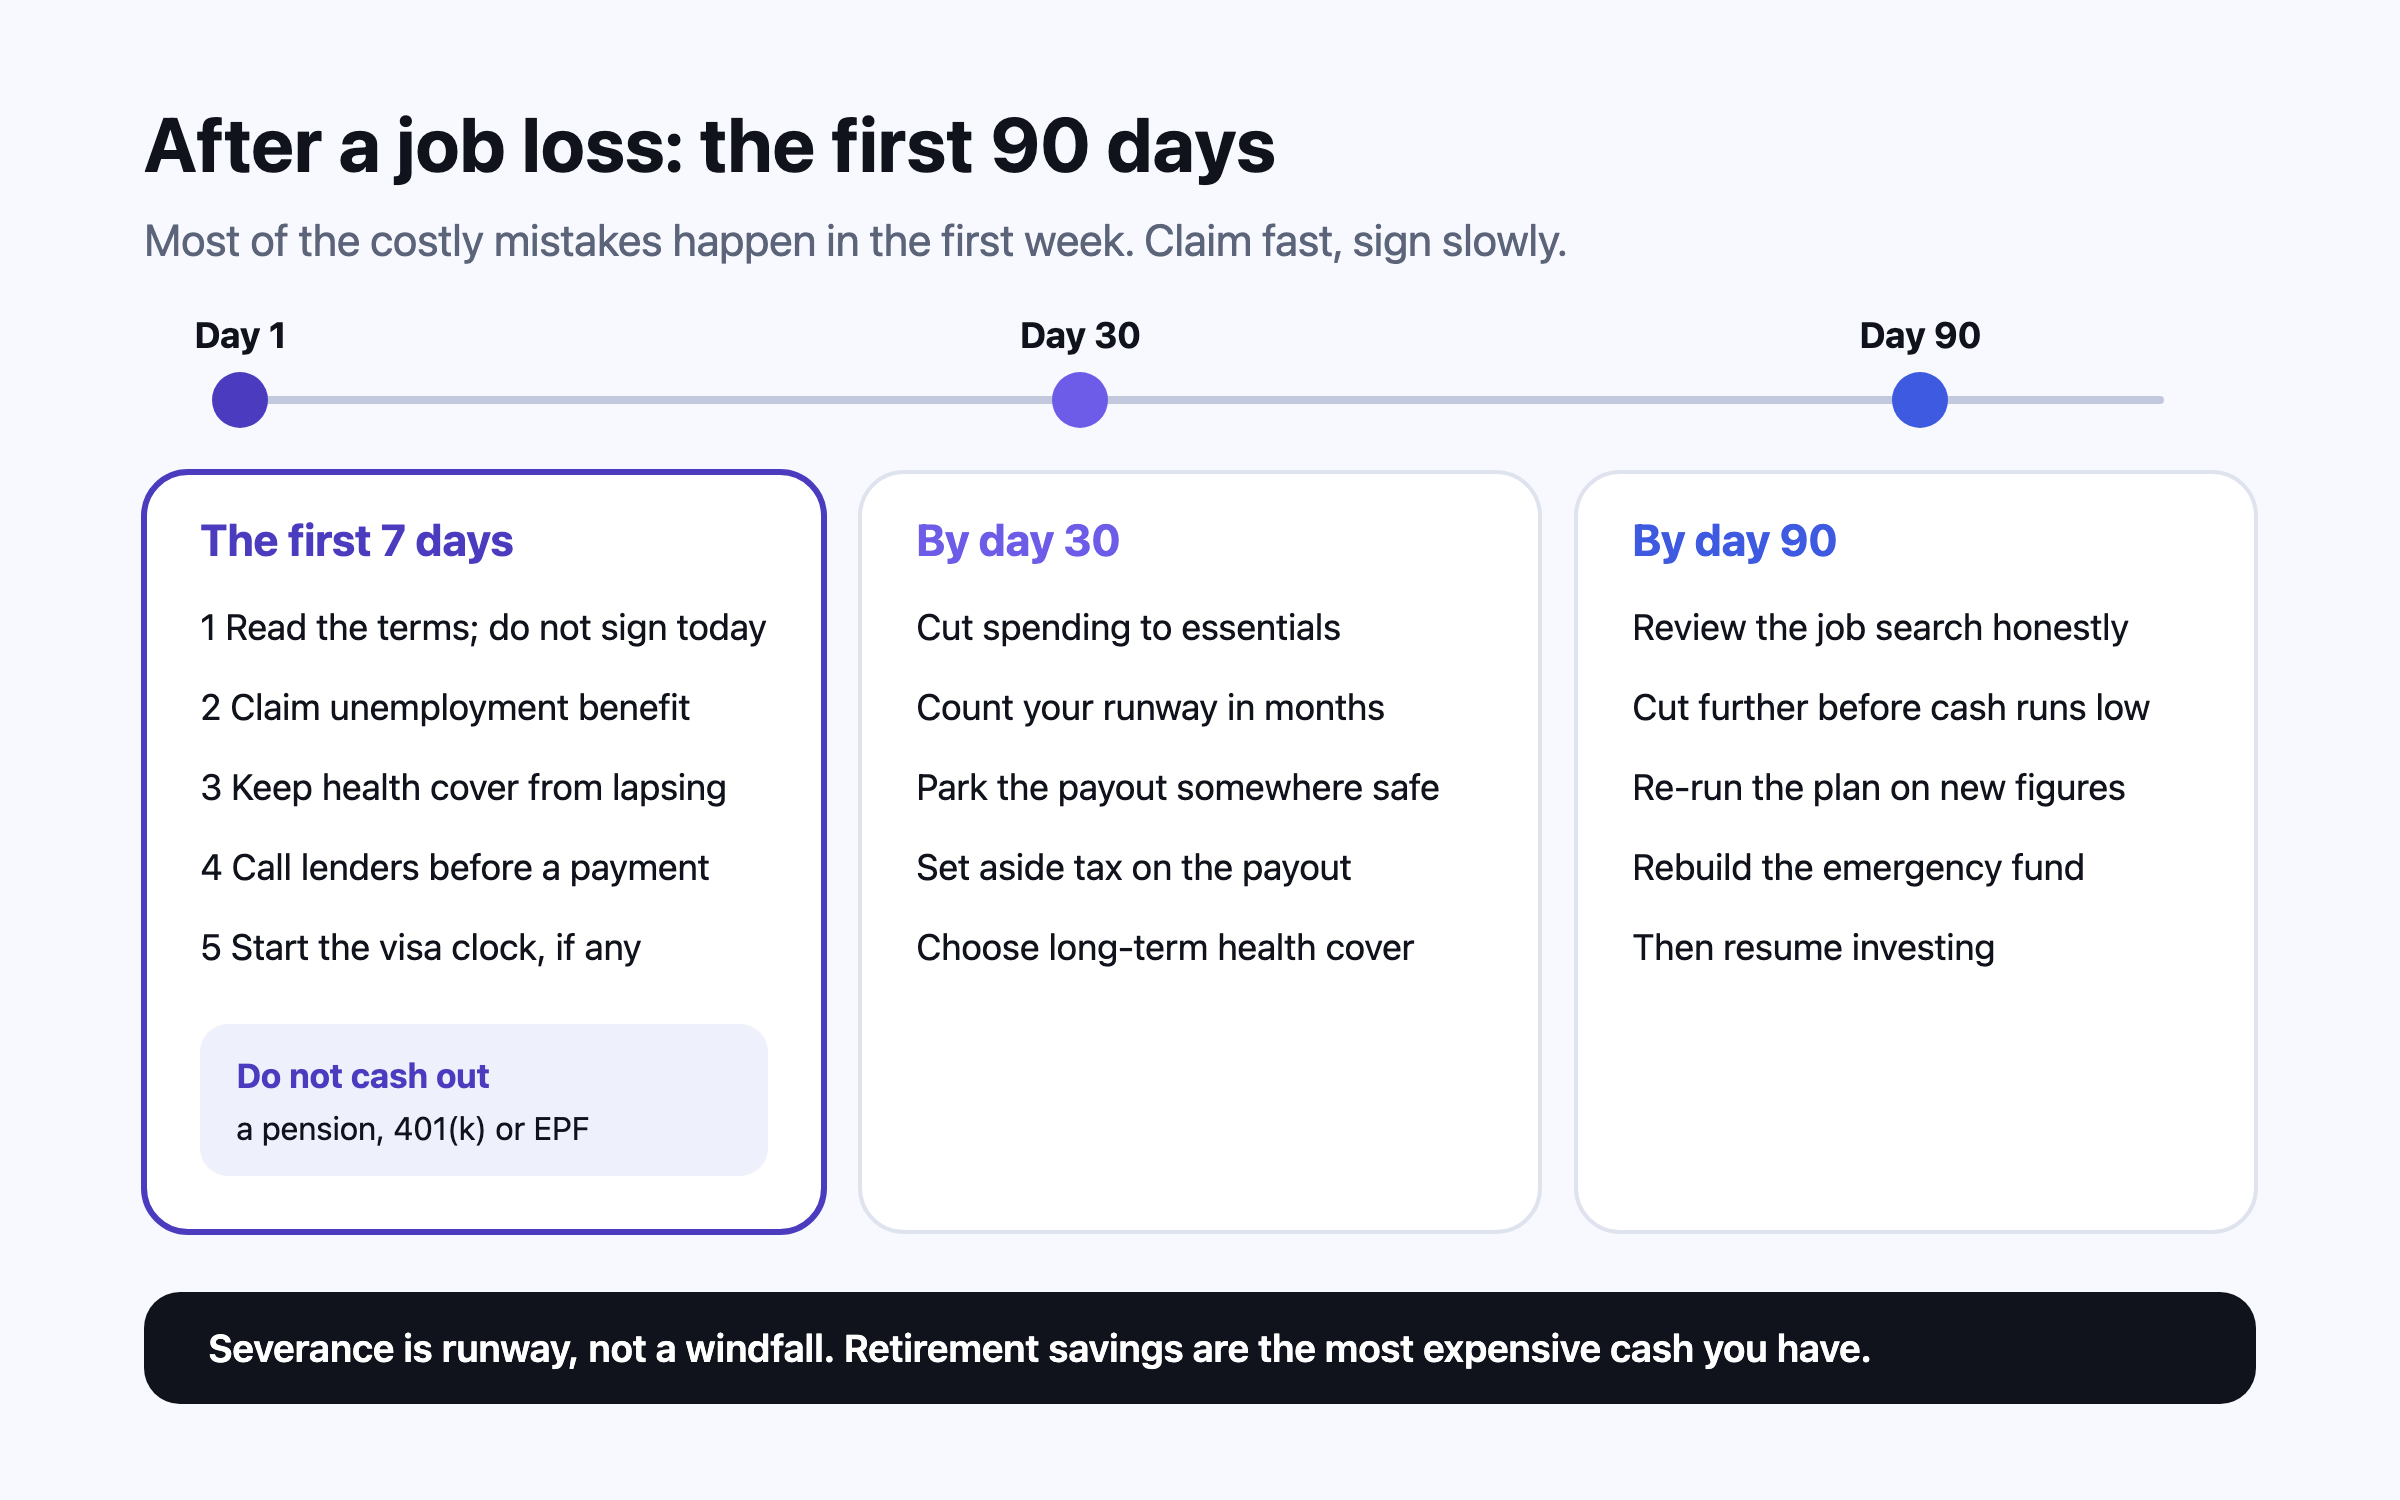
Most of the expensive mistakes after a layoff happen in the first fortnight: signing a severance agreement unread, claiming benefits late, letting health cover lapse, missing a loan payment without calling the lender, and cashing out retirement savings. This is the order to do things in, with the 2026 rules for the US, UK, India, Canada, Australia, Singapore and the UAE.
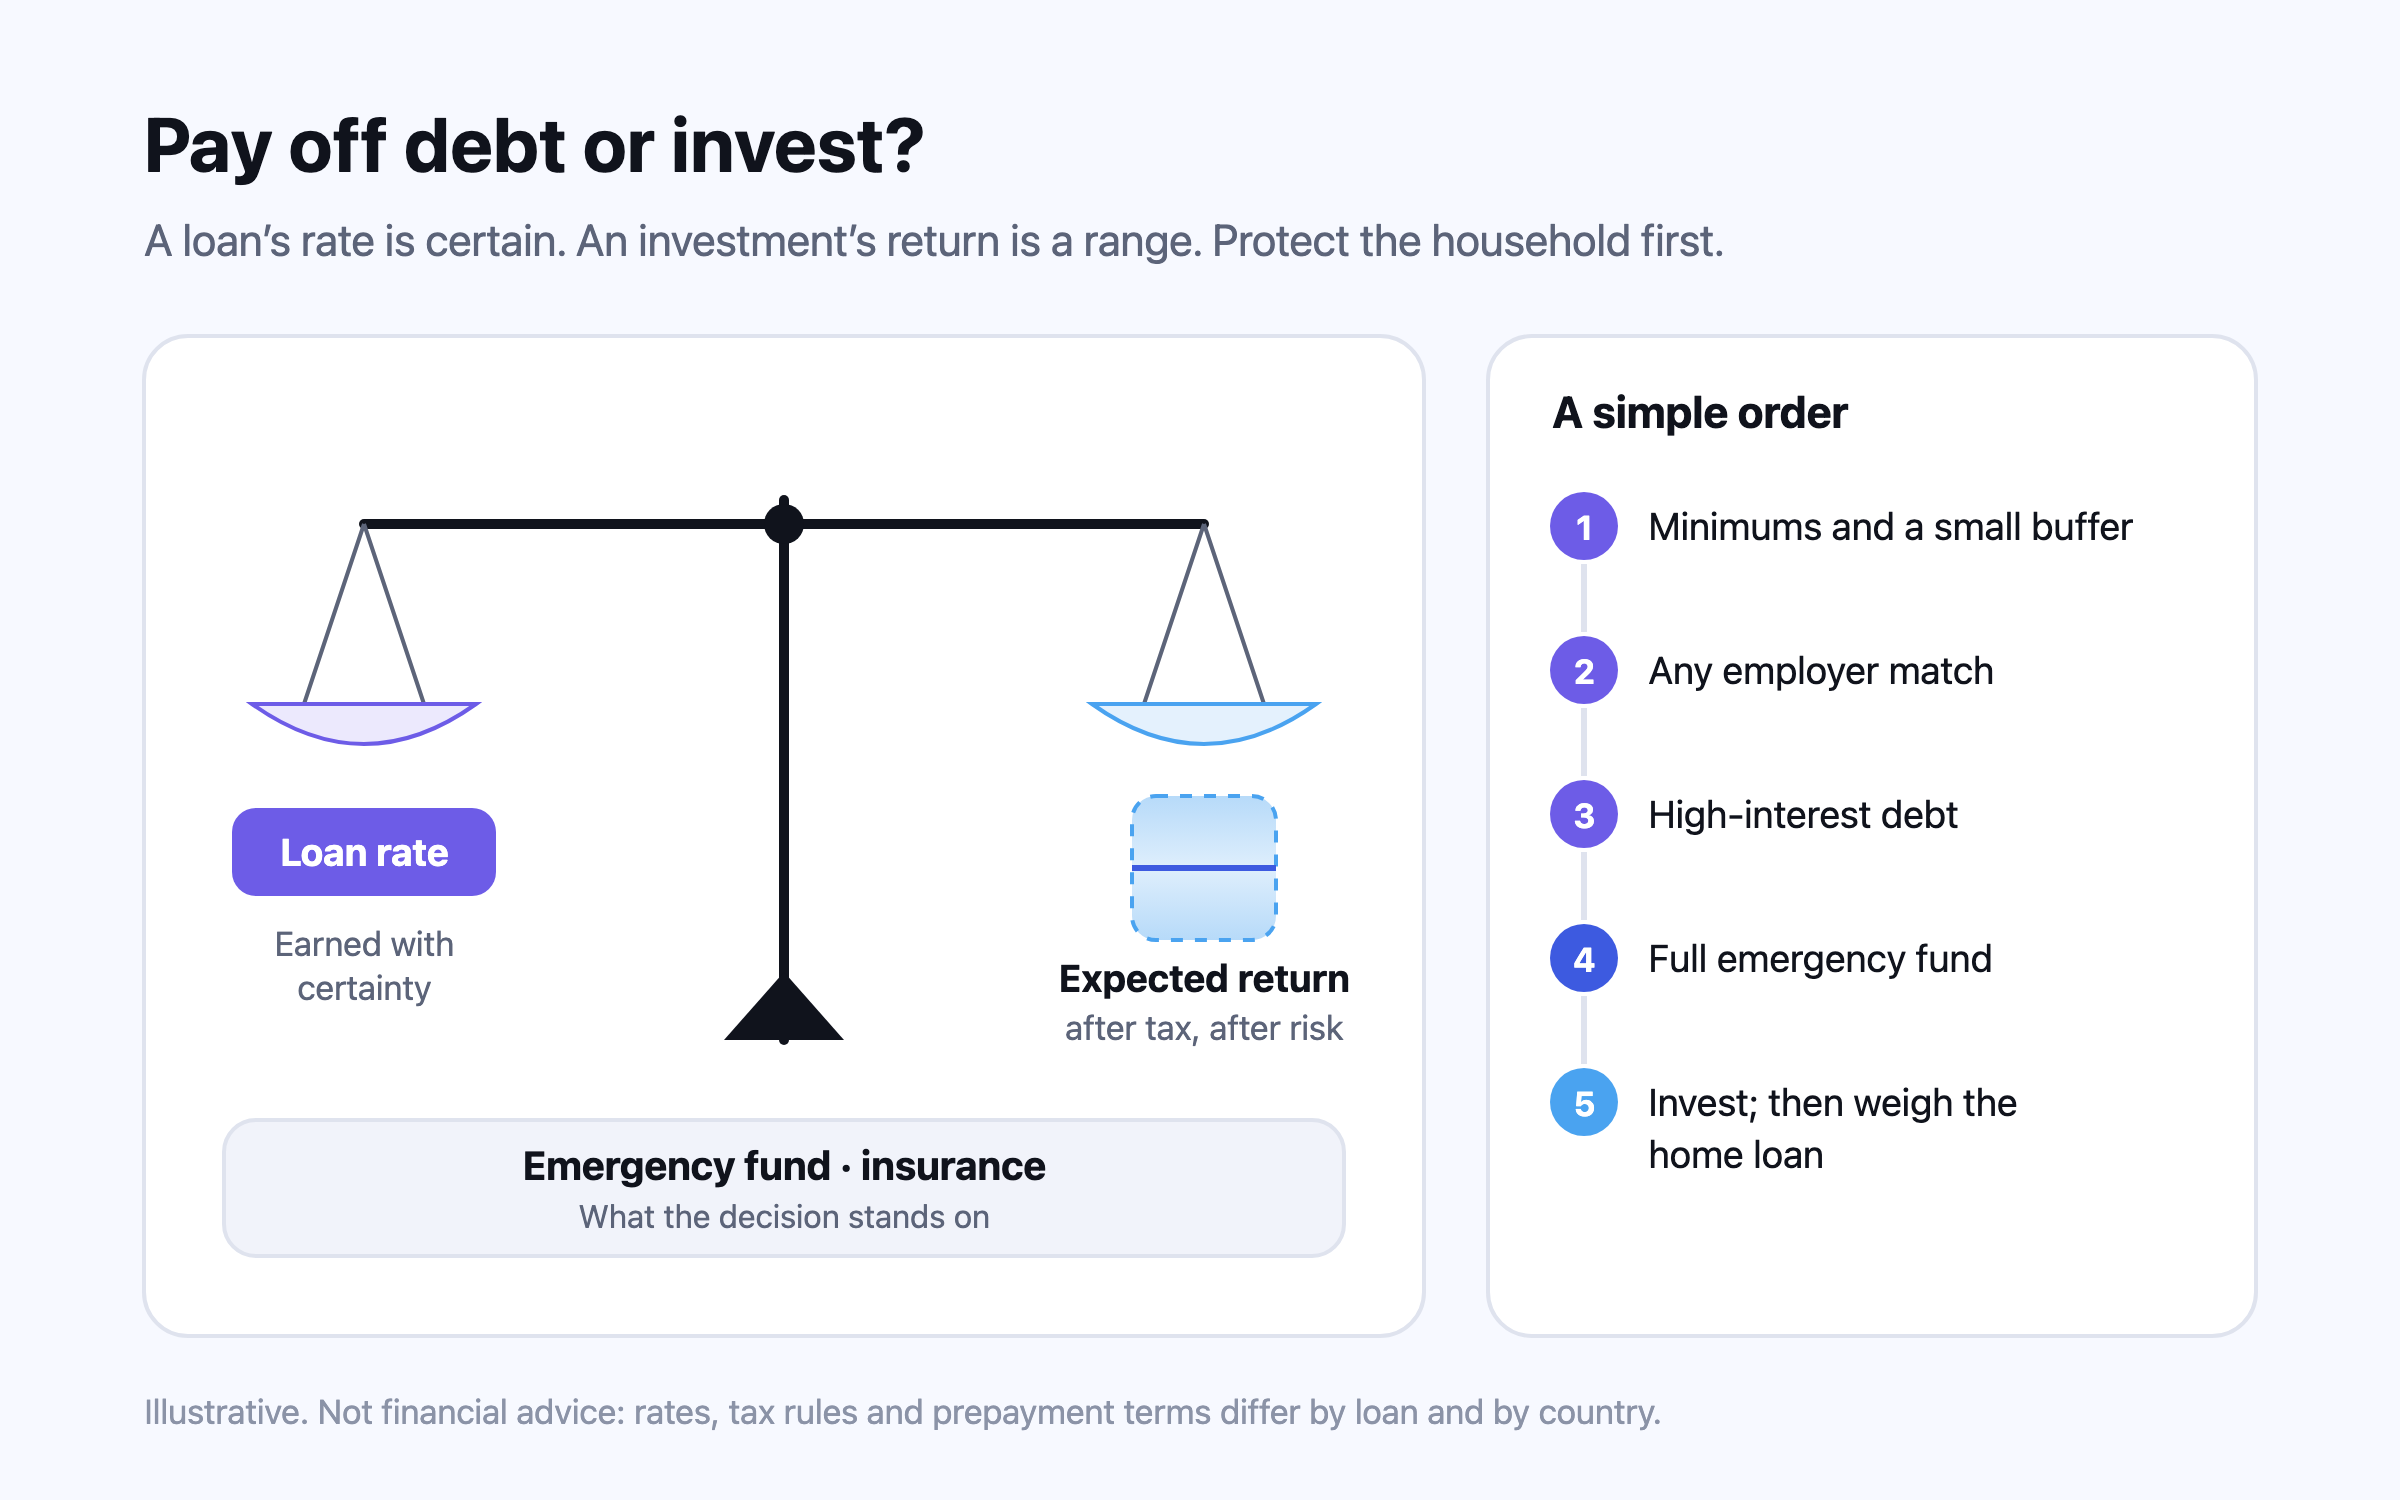
Repaying a loan earns its interest rate with certainty; investing earns an uncertain return, after tax. So costly debt goes first, a low-rate mortgage can sit beside investing, and an emergency fund and the right insurance come before both.
Insurance is for losses a household could not pay for itself: a large medical bill, the death of an earner somebody depends on, or years without income after an illness. Buy cover for those first, in that order, as plain term and health policies; size life cover to what dependants would need rather than to a multiple of salary; and be wary of policies that mix insurance with investment, which in India have returned 3–6% a year over 10 to 15 years.
This is general information, not financial, tax or legal advice for your circumstances. Rules and figures change; check the official source for your country, and consult a licensed professional before making financial decisions. Projections are estimates, not predictions.