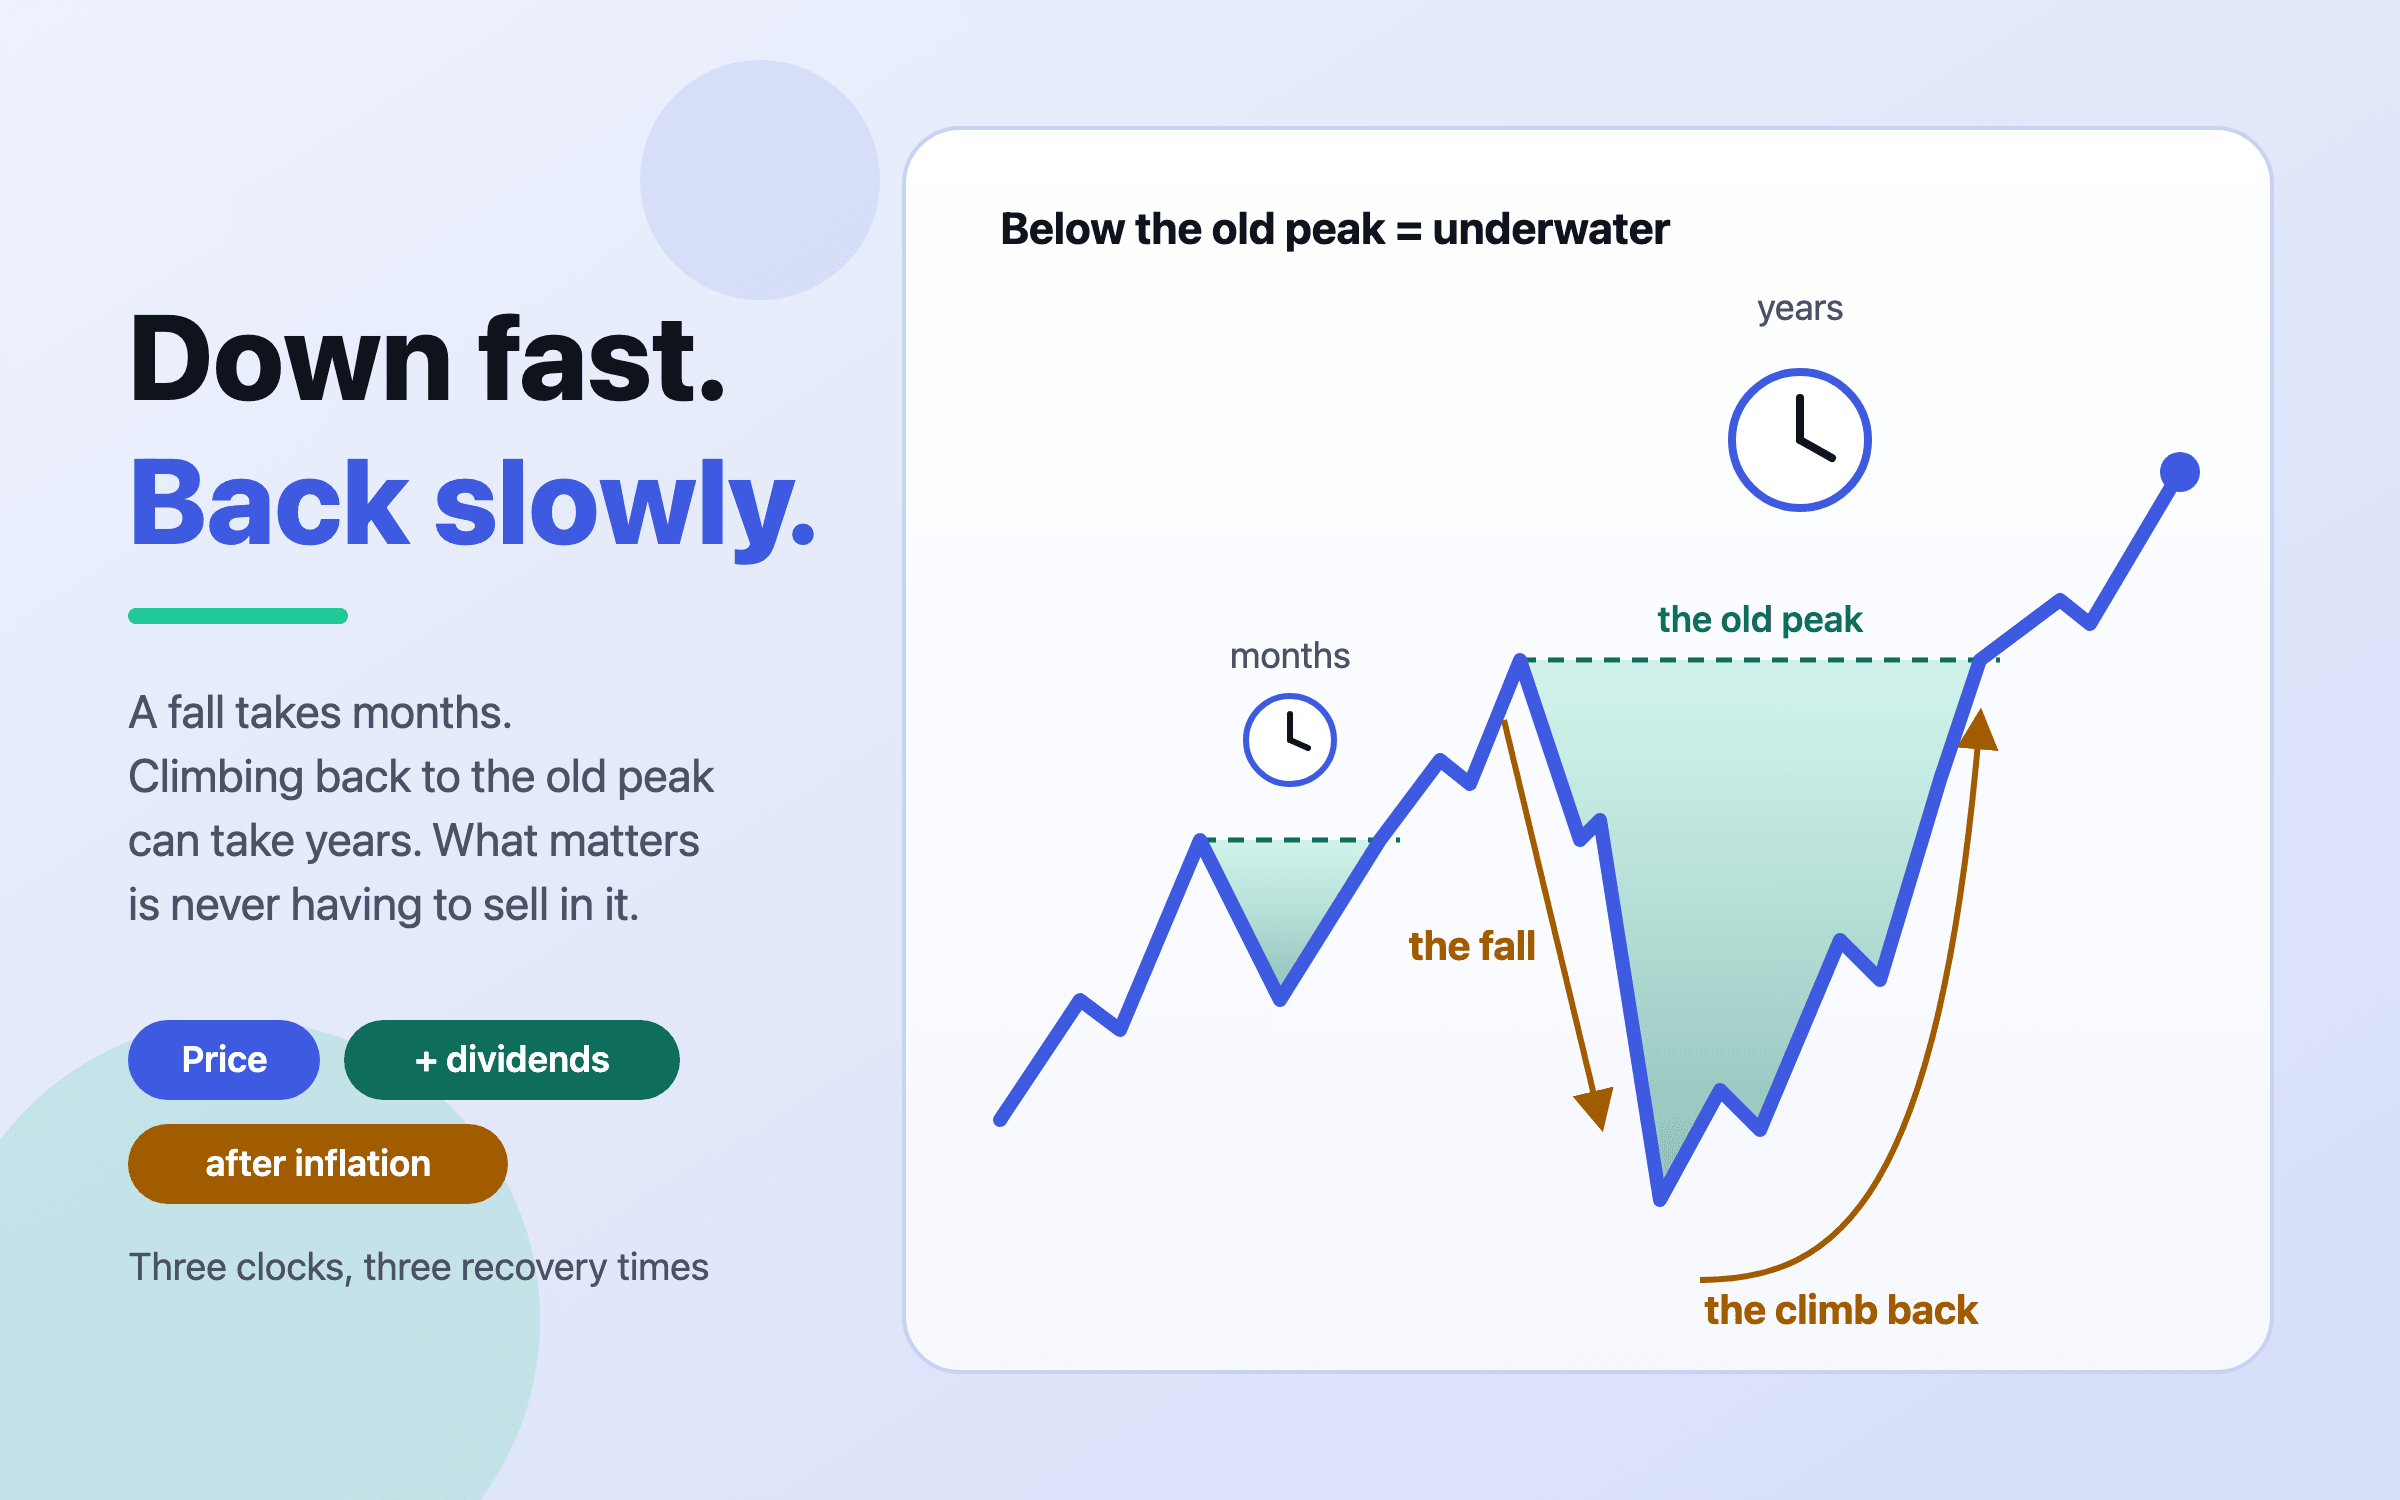
Big falls come every few years and most were climbed back within a decade, but the wait has ranged from months to 34 years.
The S&P 500 has fallen 20% or more about once every six years. Recoveries to the old peak have taken from six months (2020) to 25 years (1929, on price alone), and Japan’s Nikkei took 34. Dividends and falling prices shortened some waits a great deal. Investors who sold in a fall usually bought back far fewer shares than they sold.
Nivritee Research · 8 July 2026 · updated 15 October 2026 · 6 min read
A crash is fast. The S&P 500 lost 33.9% in 33 days in early 20201. Getting back to where it started is slower, and the wait is what decides whether a fall is a bad memory or a lasting loss — especially for a household that has to sell to pay the bills. This is the record, market by market, with the caveats that usually get left out.
How deep, and how long: the record
Measured from the closing peak to the closing low, on price alone:
United States, 1929–32. The S&P 500 fell 86.2% from September 1929 to June 1932 and did not close at a new high until September 1954, 25 years after the peak1.
United States, 1973–74. A 48.2% fall, and seven and a half years to a new high in July 19801.
United States, 2000–02. The dot-com bust took 49.1%, and the index regained its peak in May 2007, about seven years on1.
United States, 2007–09. The global financial crisis took 56.8% between October 2007 and March 2009; the old high was passed in March 2013, five and a half years after it was set1.
United States, 2020. 33.9% in 33 days, and a new high in August, 181 days after the peak1.
United States, 2022. A 25.4% fall to October 20221; the S&P 500 closed above its January 2022 record on 19 January 20242.
Japan, 1989. The Nikkei 225 peaked at 38,915.87 on 29 December 19893, fell to 7,054 on 10 March 2009, its lowest since the bubble burst4 — a fall of 81.9% — and first closed above its old record on 22 February 2024, more than 34 years later3.
India, 2008. The Sensex fell from 21,206.77 in January 20085 to 7,697.39 in October, about 64% on those intraday figures6, and closed at a level never seen before on 5 November 20107.
India, 2020. From a record 42,273 in January to 25,981 on 23 March, a fall of 38.5%, and a new record on 9 November the same year8.
United Kingdom, 1999. The FTSE 100’s record close of 6,930.2 on 30 December 19999 gave way to a low of 3,287 in March 200310, a fall of 52.6%, and was not passed until February 20159.
United Kingdom, 2020. From its close of 7,403.92 on 21 February to 5,190.78 on 20 March, 29.9% down, and still below that February level in November 202111.
How far each market fell, peak to low, on price
Index price only. US figures are the S&P 500, closing peak to closing low; India’s peaks (and its 2008 low) are intraday levels. Each fall is computed from the index levels reported at the time. The UK’s 2020 fall is left out: the levels found run from 21 February to 20 March, not from the peak to the low. 1,3,4,5,6,9,10,8The figures in this chart
Fall from peak
US 1929–32
86.2%
Japan 1989–2009
81.9%
India 2008
63.7%
US 2007–09
56.8%
UK 1999–2003
52.6%
US 2000–02
49.1%
US 1973–74
48.2%
India 2020
38.5%
US 2020
33.9%
US 2022
25.4%
The depth matters more than it looks, because losses and gains are not symmetrical. A 25% fall needs a 33% gain to get back; a 50% fall needs 100%; Japan’s 81.9% needed the index to multiply more than five times1,3,4. That is why the deepest falls are also the slowest to recover.
Years from the old peak until the index closed above it again, on price
Counted from the peak, not the low, and before dividends and inflation. The UK’s 2020 fall is left out because no reliable date for its recovery was found; it was still below its old level 21 months later. 1,2,3,9,7,8,5The figures in this chart
Years to a new high
Japan 1989
34.1
US 1929
25.0
UK 1999
15.2
US 1973
7.5
US 2000
7.2
US 2007
5.5
India 2008
2.8
US 2022
2.0
India 2020
0.8
US 2020
0.5
Three clocks: price, dividends and inflation
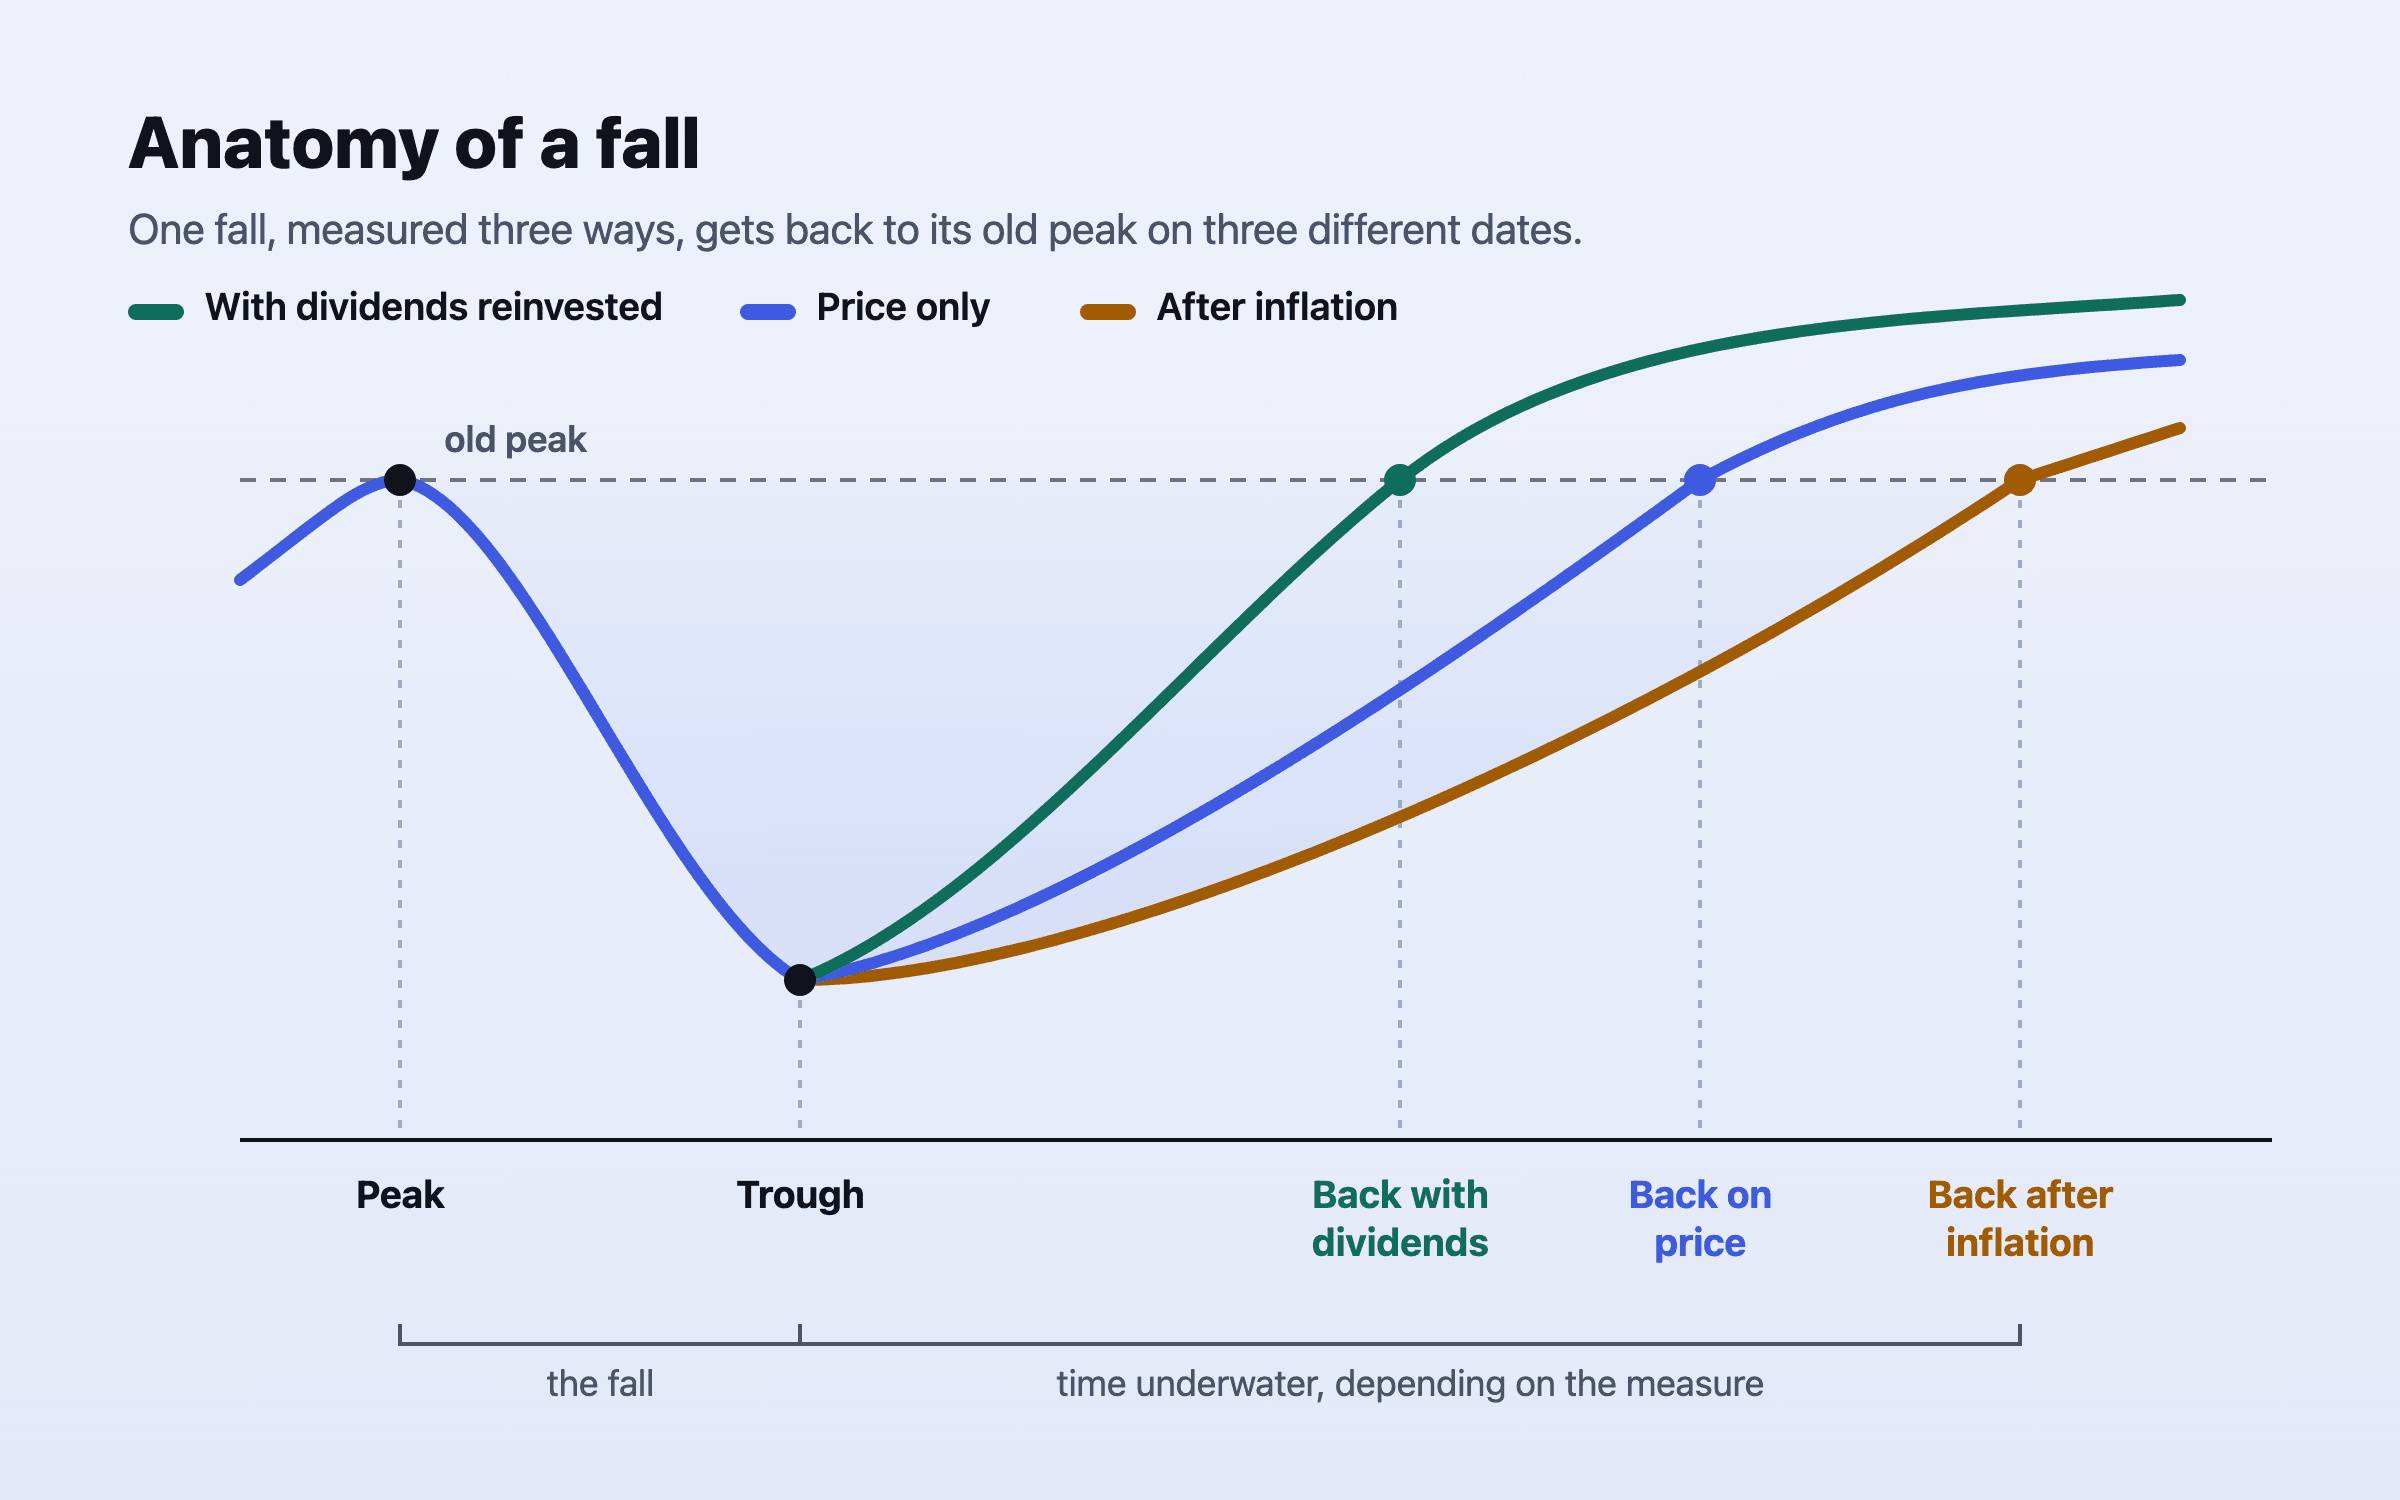
Nearly every recovery time you read is for an index’s price — which ignores the dividends investors were paid while they waited, and the change in what money bought. Both can move the answer by years.
The same fall regains its old peak on three different dates. With dividends reinvested it is usually soonest; after inflation, usually latest.
The famous 25 years after 1929 is a price figure. Mark Hulbert worked out that an investor who bought at the 1929 peak and reinvested dividends had broken even, after allowing for the deflation of the 1930s, by late 1936 — about seven years after the peak and less than four and a half after the 1932 low. At that low the market’s dividend yield was close to 14%, and consumer prices in late 1936 were more than 18% below the autumn of 192912.
Inflation can stretch a wait instead. When the Nikkei finally passed its 1989 record in February 2024, it was still 17.6% below that peak after inflation13. And the 1970s recovery to July 1980 came in a decade of fast-rising prices, so after inflation the wait was longer still. Ask which clock a figure is on before drawing a lesson from it.
How often falls come
Falls are not rare events to be predicted; they are the normal weather of owning shares. From 1954 to 2024, the S&P 500 fell 10% or more about once every 18 months, 15% or more about once every three years, and 20% or more about once every six years14. The average 10% decline lasted 135 days from high to low; the average 20% one, 402 days14. In a typical year the index has dropped 14.2% at some point, yet it ended 35 of the 46 calendar years from 1980 to 2025 higher15.
Hartford Funds counts 27 bear markets of 20% or more since 1928, with an average loss of 35% and an average length of 289 days, against an average bull-market gain of 112%16. The arithmetic of owning shares is that the falls are frequent and sharp and the rises are long and larger.
What selling in a fall costs
Selling locks in the fall, and buying back usually happens when it feels safe — which tends to be after the recovery. Suppose somebody sold their S&P 500 fund at the March 2009 low of 676.53 and bought back only once the index regained its 2007 peak of 1,565.151. Every unit they sold bought back just 0.43 of a unit: they kept 43% of the holding they would have had by doing nothing. Selling at the 2020 low of 2,237.40 and returning at the old high of 3,386.15 left 66%1.
The best days arrive in the middle of the worst periods, which is why stepping aside is so costly. J.P. Morgan found that $10,000 left in the S&P 500 from 2006 to 2025 grew to $80,619; missing just the 10 best days left $35,866, and missing 20 left $21,177. Six of those 10 best days came within two weeks of the 10 worst17. Hartford found that about 42% of the strongest days from 2003 to early 2025 fell during bear markets, and another 36% in the first two months of a bull market16.
$10,000 in the S&P 500, 2006–2025: what missing the best days did to the ending value
J.P. Morgan Asset Management, S&P 500 Total Return Index, 2 January 2006 to 31 December 2025, hypothetical and before fees. Nobody misses only the best days; the point is how few days carry the result. 17The figures in this chart
Ending value
Fully invested
$80,619
Missed 10 best days
$35,866
Missed 20
$21,177
Missed 30
$13,826
Missed 40
$9,462
Missed 50
$6,763
Missed 60
$4,966
Real investors pay for this every decade. Morningstar’s 2026 study found that the average dollar in US funds and ETFs earned 8.7% a year over the ten years to 2025, while the funds themselves returned 9.9% — a gap of 1.2 percentage points a year, caused by the timing of purchases and sales18. See common investing mistakes for the other habits behind that gap.
Japan: why one market is not enough
Japan is the case every long-term investor should know. A Japanese saver who put everything into the Nikkei at the end of 1989 waited more than 34 years to see the price again3, and was still behind after inflation13. Nothing in the 1989 numbers marked Japan as the exception; that is only obvious looking back. The defence is not to guess which market will be next but to own several — the evidence is in 125 years of global diversification and home bias and currency risk.
How to be the investor who stays
Hold your near-term spending outside shares. Money you will need within a few years — an emergency fund, and once you are drawing down, a runway of years of spending — belongs in cash, deposits and bonds, so a fall never forces a sale. A deposit or bond ladder is one way to build it.
Know in advance what a fall would do to you. Run your plan through a crash in the years after you stop working, when there is no salary to wait it out, and decide now what you would cut.
Spread across markets and asset classes, so no single index decides your outcome.
Rebalance rather than react. Buying the asset that has fallen, back to your target, is the opposite of panic selling and needs no forecast (rebalancing).
Keep investing on a schedule. A monthly investment buys more units when prices are low, without anybody having to call the bottom.
Nivritee’s stress tests deliberately sit at the mild end of history: A 2008-style crash takes 35% off your savings in a single year, five years after you stop working, when markets fell about half from peak to trough in 200819.
Questions people ask
How long does it take the stock market to recover from a crash?
On price, US recoveries to the old peak have taken from six months (2020) to 25 years (1929); of the falls since 1973, the longest was about seven and a half years1. Dividends shorten the wait — counting them and deflation, the 1929 investor was even by late 193612.
How often does the stock market fall 20%?
From 1954 to 2024 the S&P 500 fell 20% or more about once every six years, and 10% or more about once every 18 months14.
How long did the Nikkei take to recover from 1989?
More than 34 years: it peaked at 38,915.87 on 29 December 1989 and first closed above that on 22 February 20243. After inflation it was still below its peak13.
Should I sell my investments when the market crashes?
Selling turns a fall into a permanent loss, and the best days often follow the worst: missing the 10 best days from 2006 to 2025 cut $80,619 to $35,86617. Money you need soon should not be in shares in the first place.
How long did the Sensex take to recover after 2008?
From its January 2008 high it fell to about 7,700 in October and closed at a new record on 5 November 2010, a little under three years after the peak6,7.
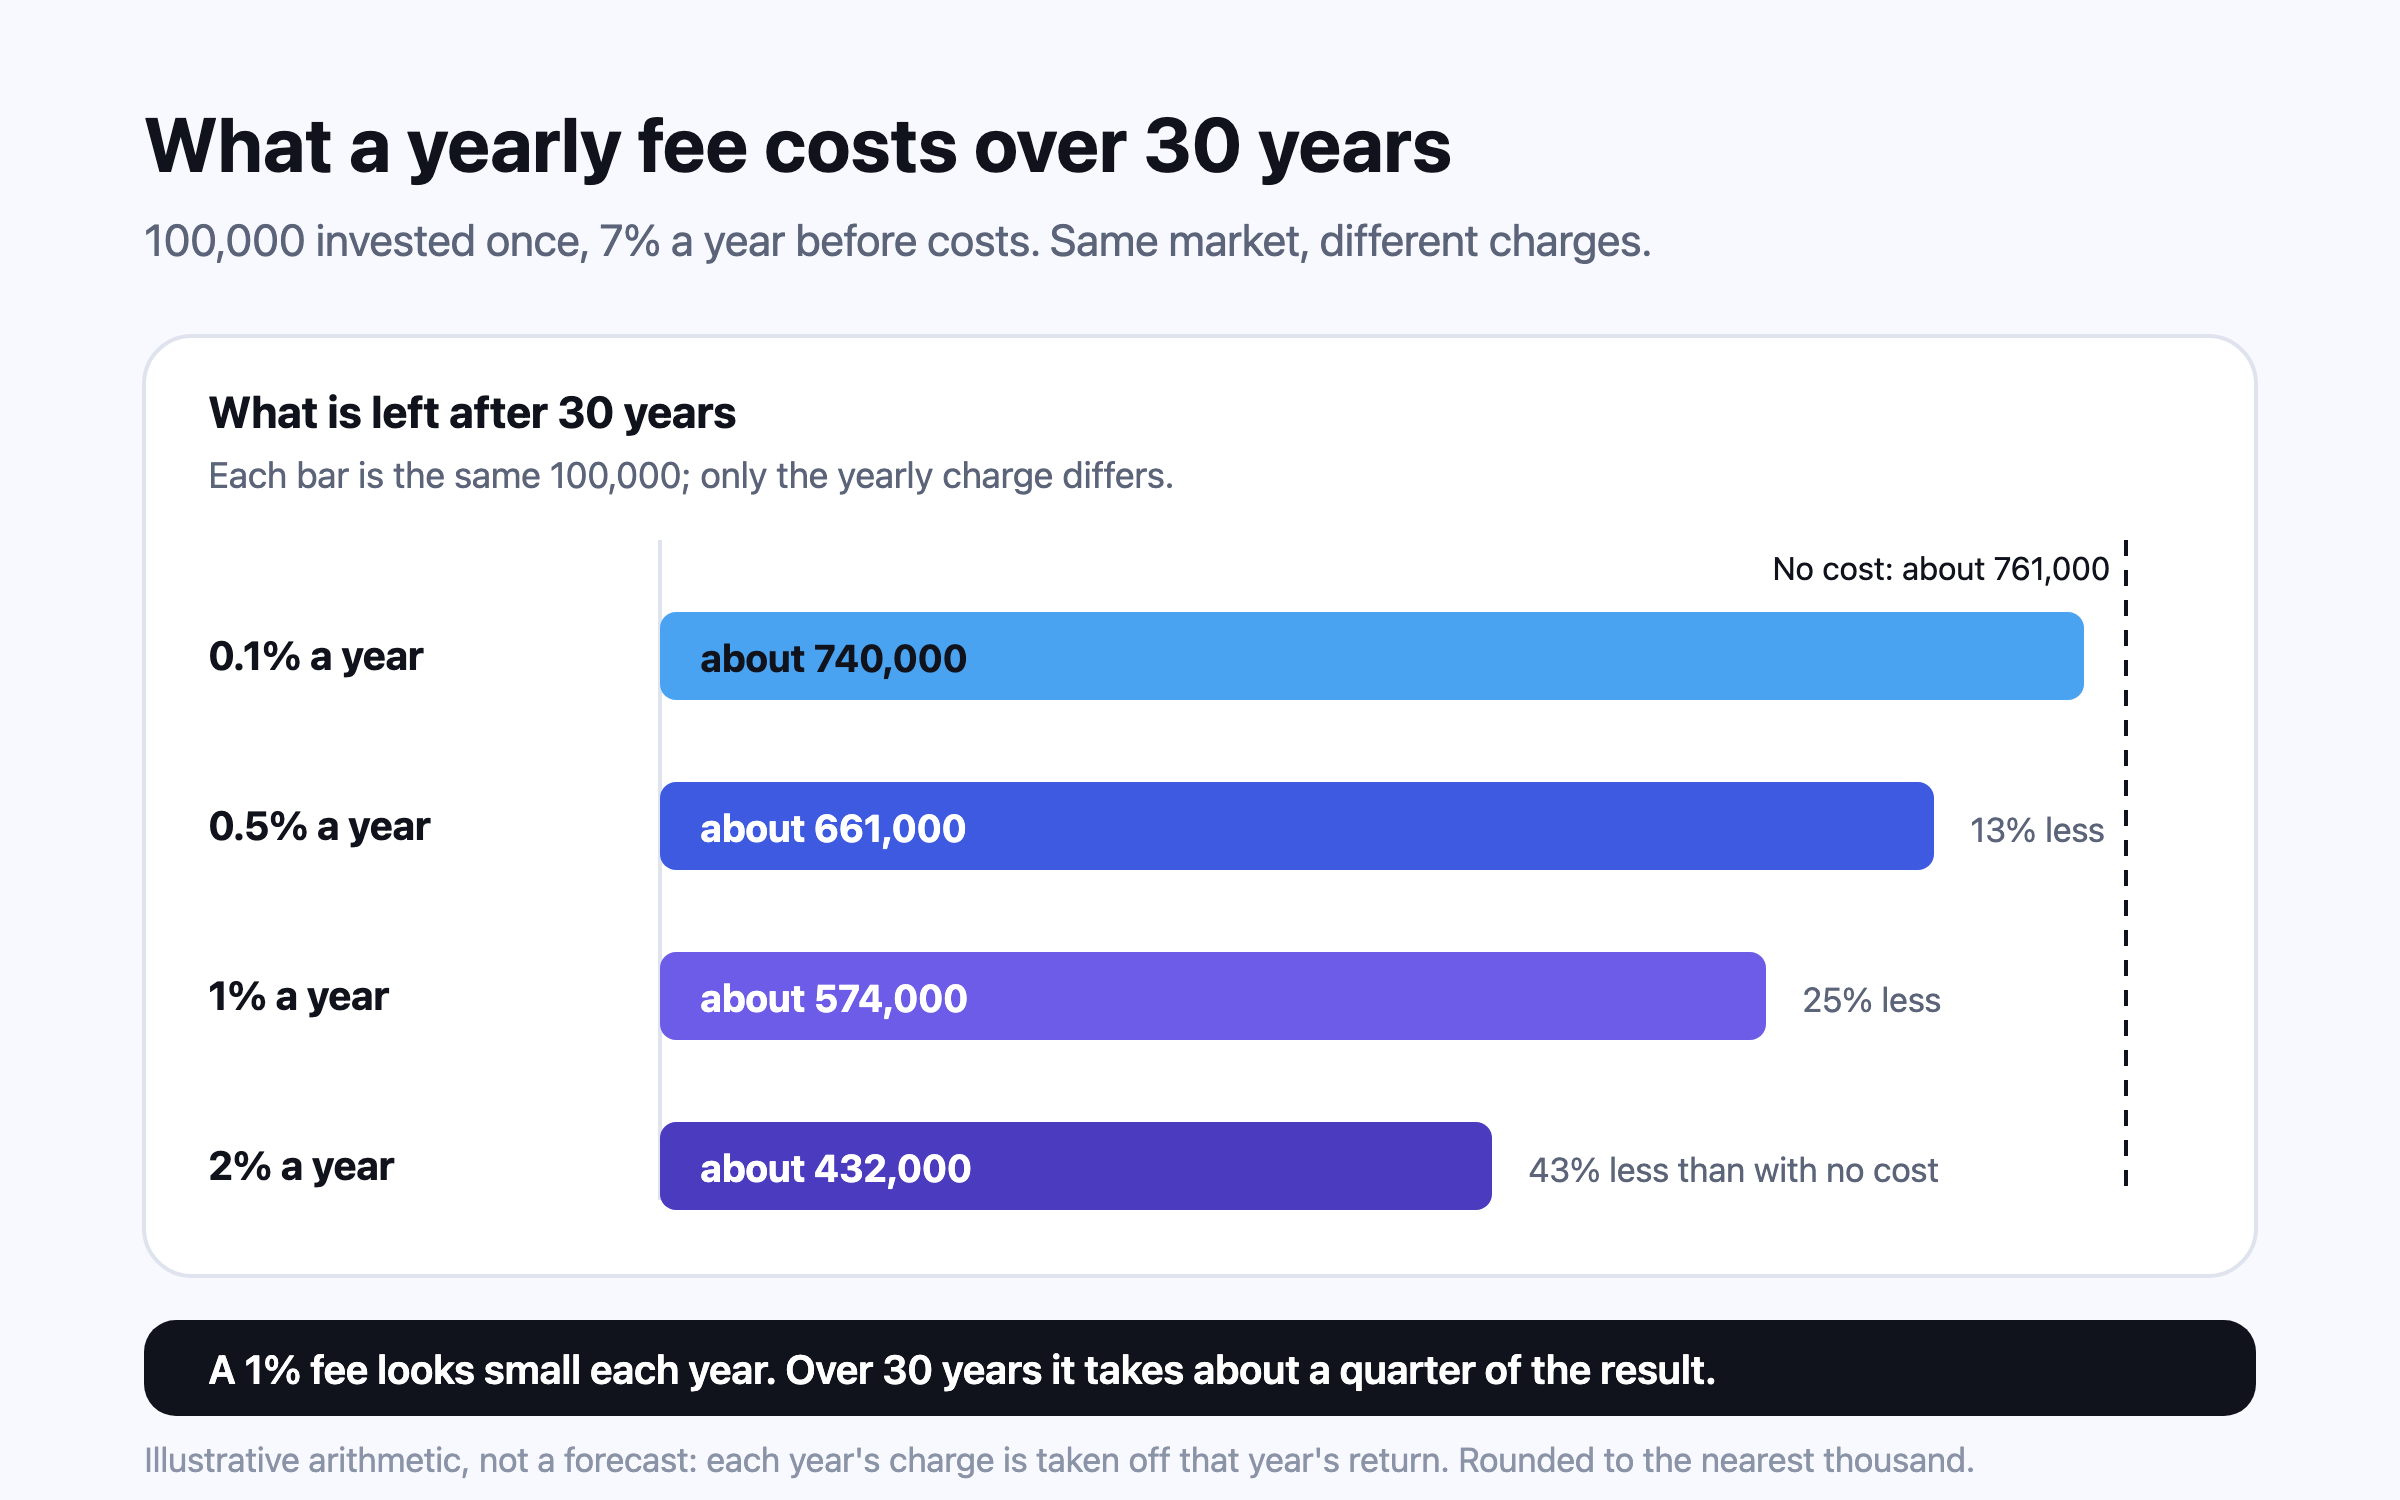
A fee is charged every year on the whole balance, so it compounds against you. On 7% a year before costs, a 1% yearly charge leaves about a quarter less after 30 years than no charge at all, and 2% leaves over 40% less. Fund costs have fallen sharply — US equity funds averaged 0.40% in 2025 against 1.04% in 1996 — but platform and adviser layers sit on top, and in India a regular plan carries a distributor’s commission that a direct plan does not.
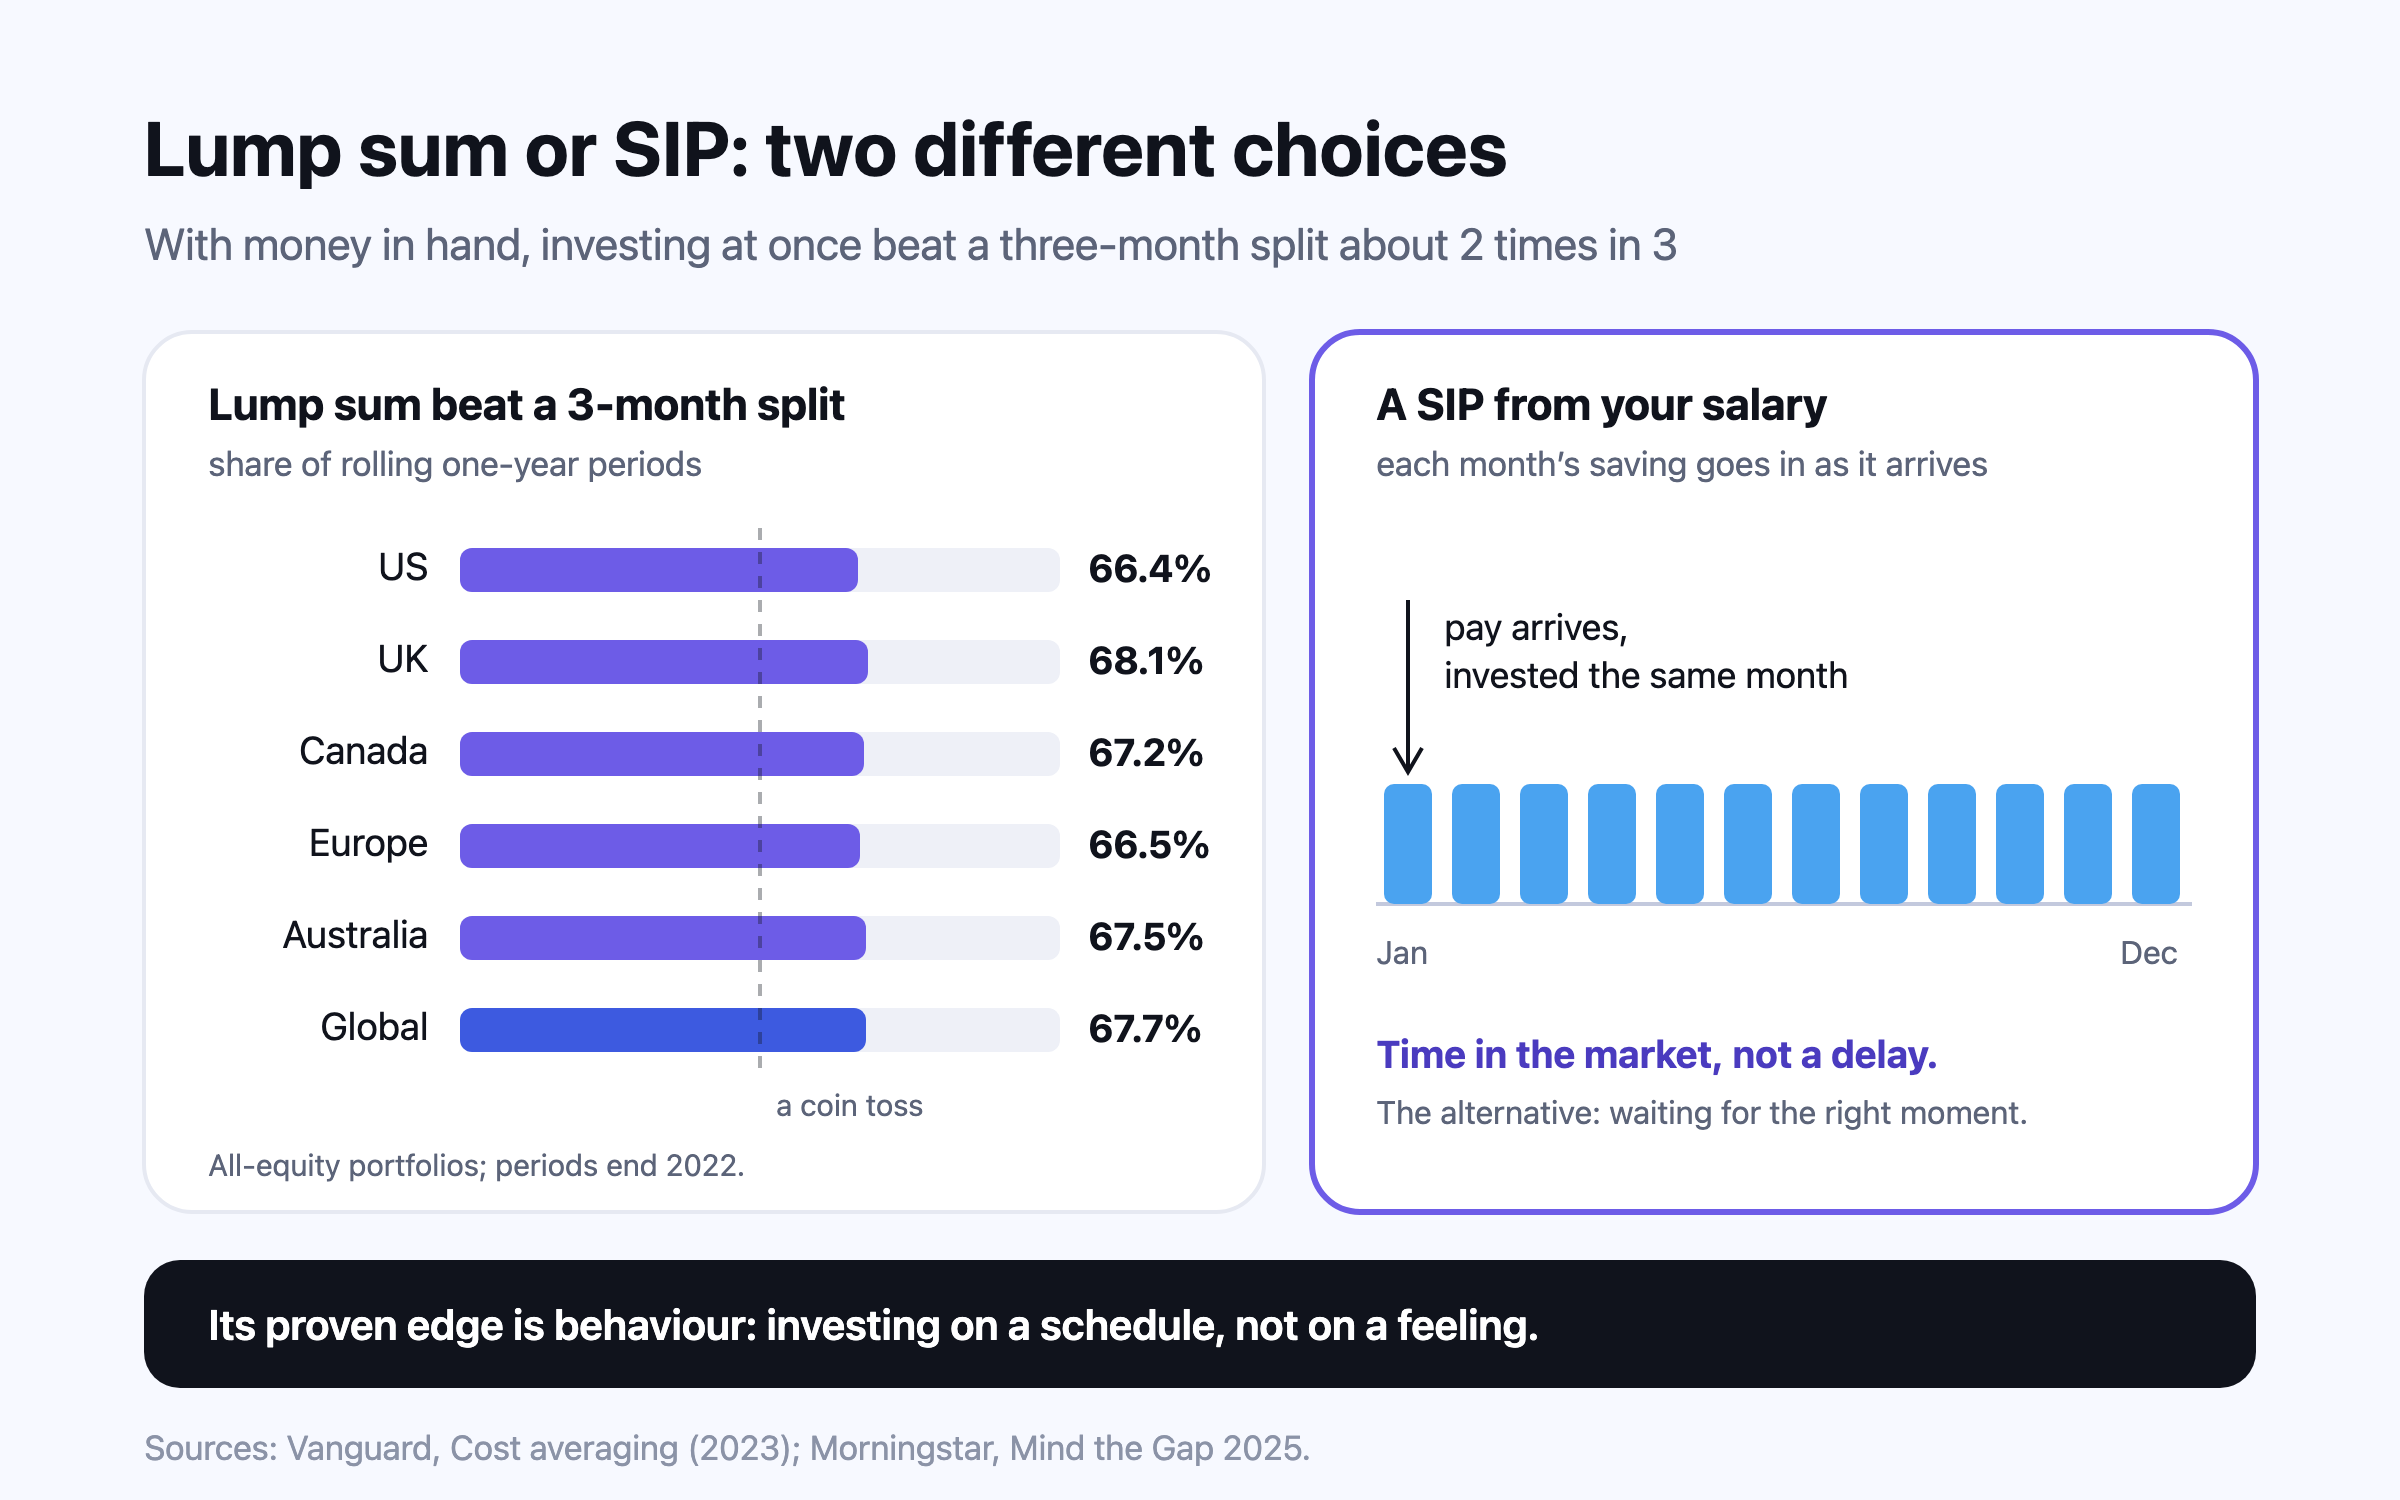
With money already in hand, investing it at once has beaten feeding it in over a few months roughly two-thirds of the time, by about 2% after a year for an all-equity portfolio, because markets rise more often than they fall. A SIP from each month’s salary is not that choice: it invests money as soon as it exists. Its real advantage is behavioural: automatic, regular investing takes the stop-start timing decisions out of investors’ hands.
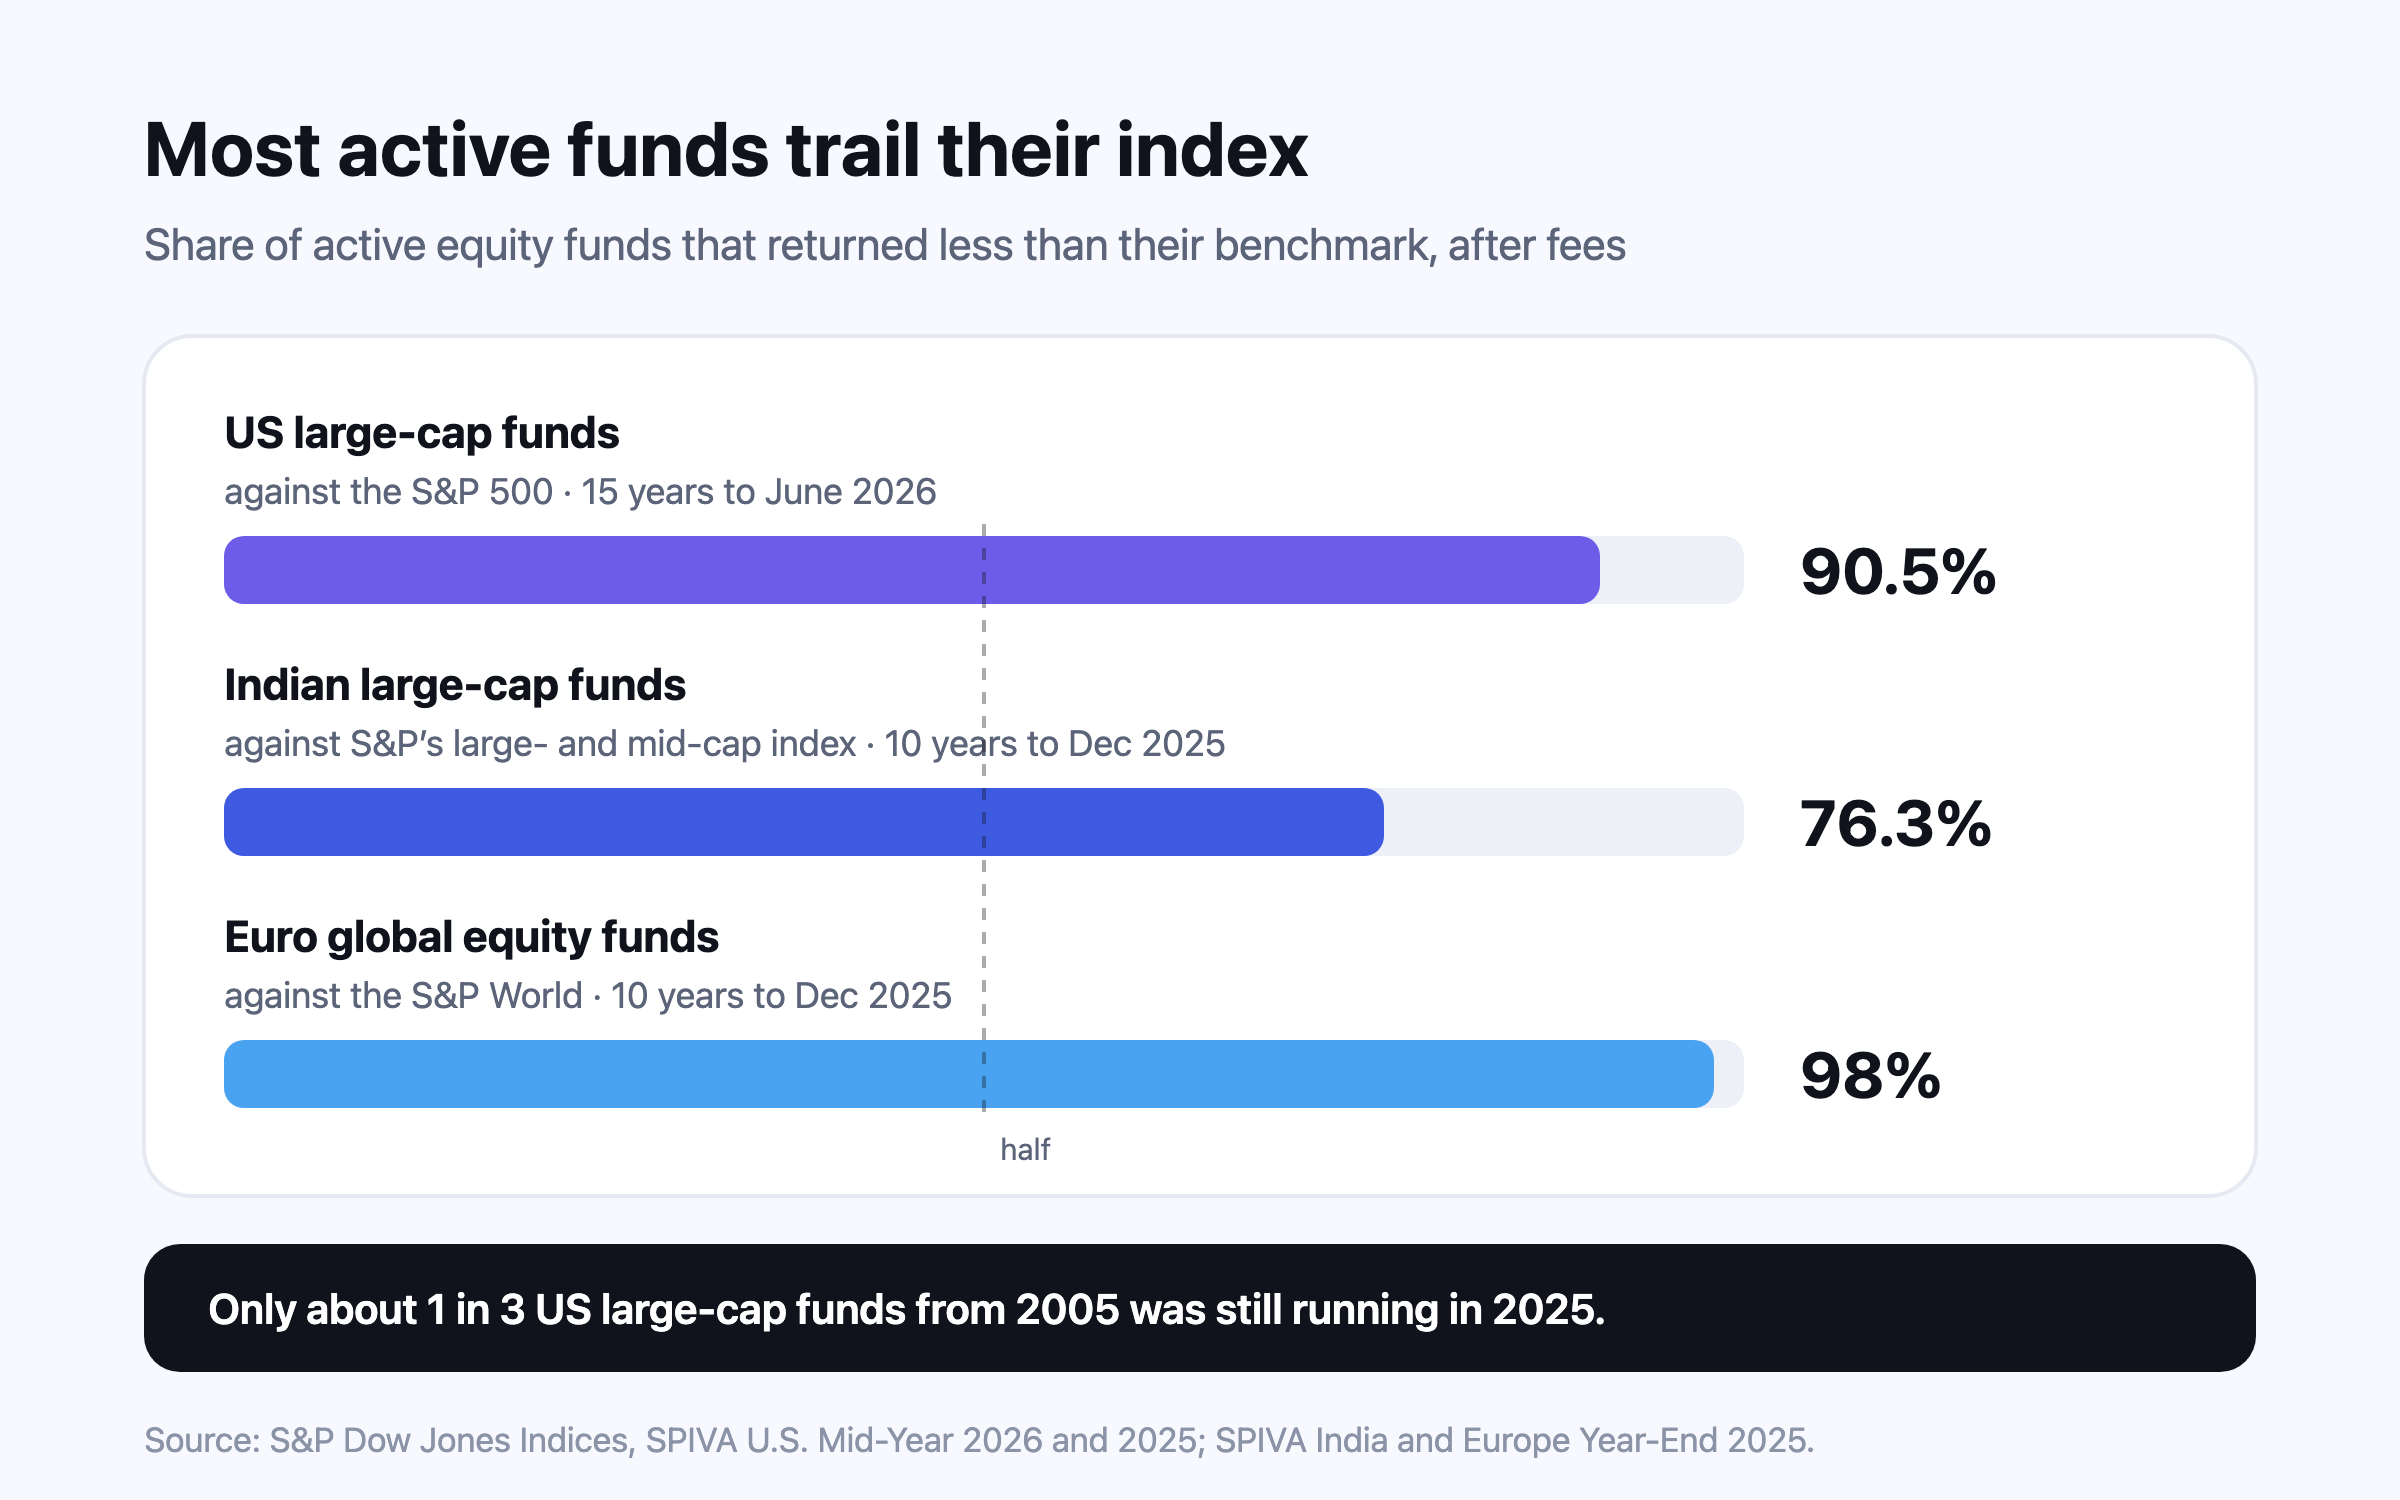
Most actively managed equity funds trail their benchmark after fees, and the share grows with time: to June 2026, 90.5% of US large-cap funds lagged the S&P 500 over 15 years. India and Europe show the same long-run pattern, with real exceptions — Indian mid- and small-cap funds had their best year against the index since 2014 in 2025. Winners rarely stay winners, and the cheapest funds succeed most often.
This is general information, not financial, tax or legal advice for your circumstances. Rules and figures change; check the official source for your country, and consult a licensed professional before making financial decisions. Projections are estimates, not predictions.