Nivritee Research · Investing & global markets

Index funds, global markets, fees and gold

What a century of returns across countries, and decades of fund data, say about how to invest and what it costs. 6 articles, every figure sourced.

Index funds vs active funds: the SPIVA data

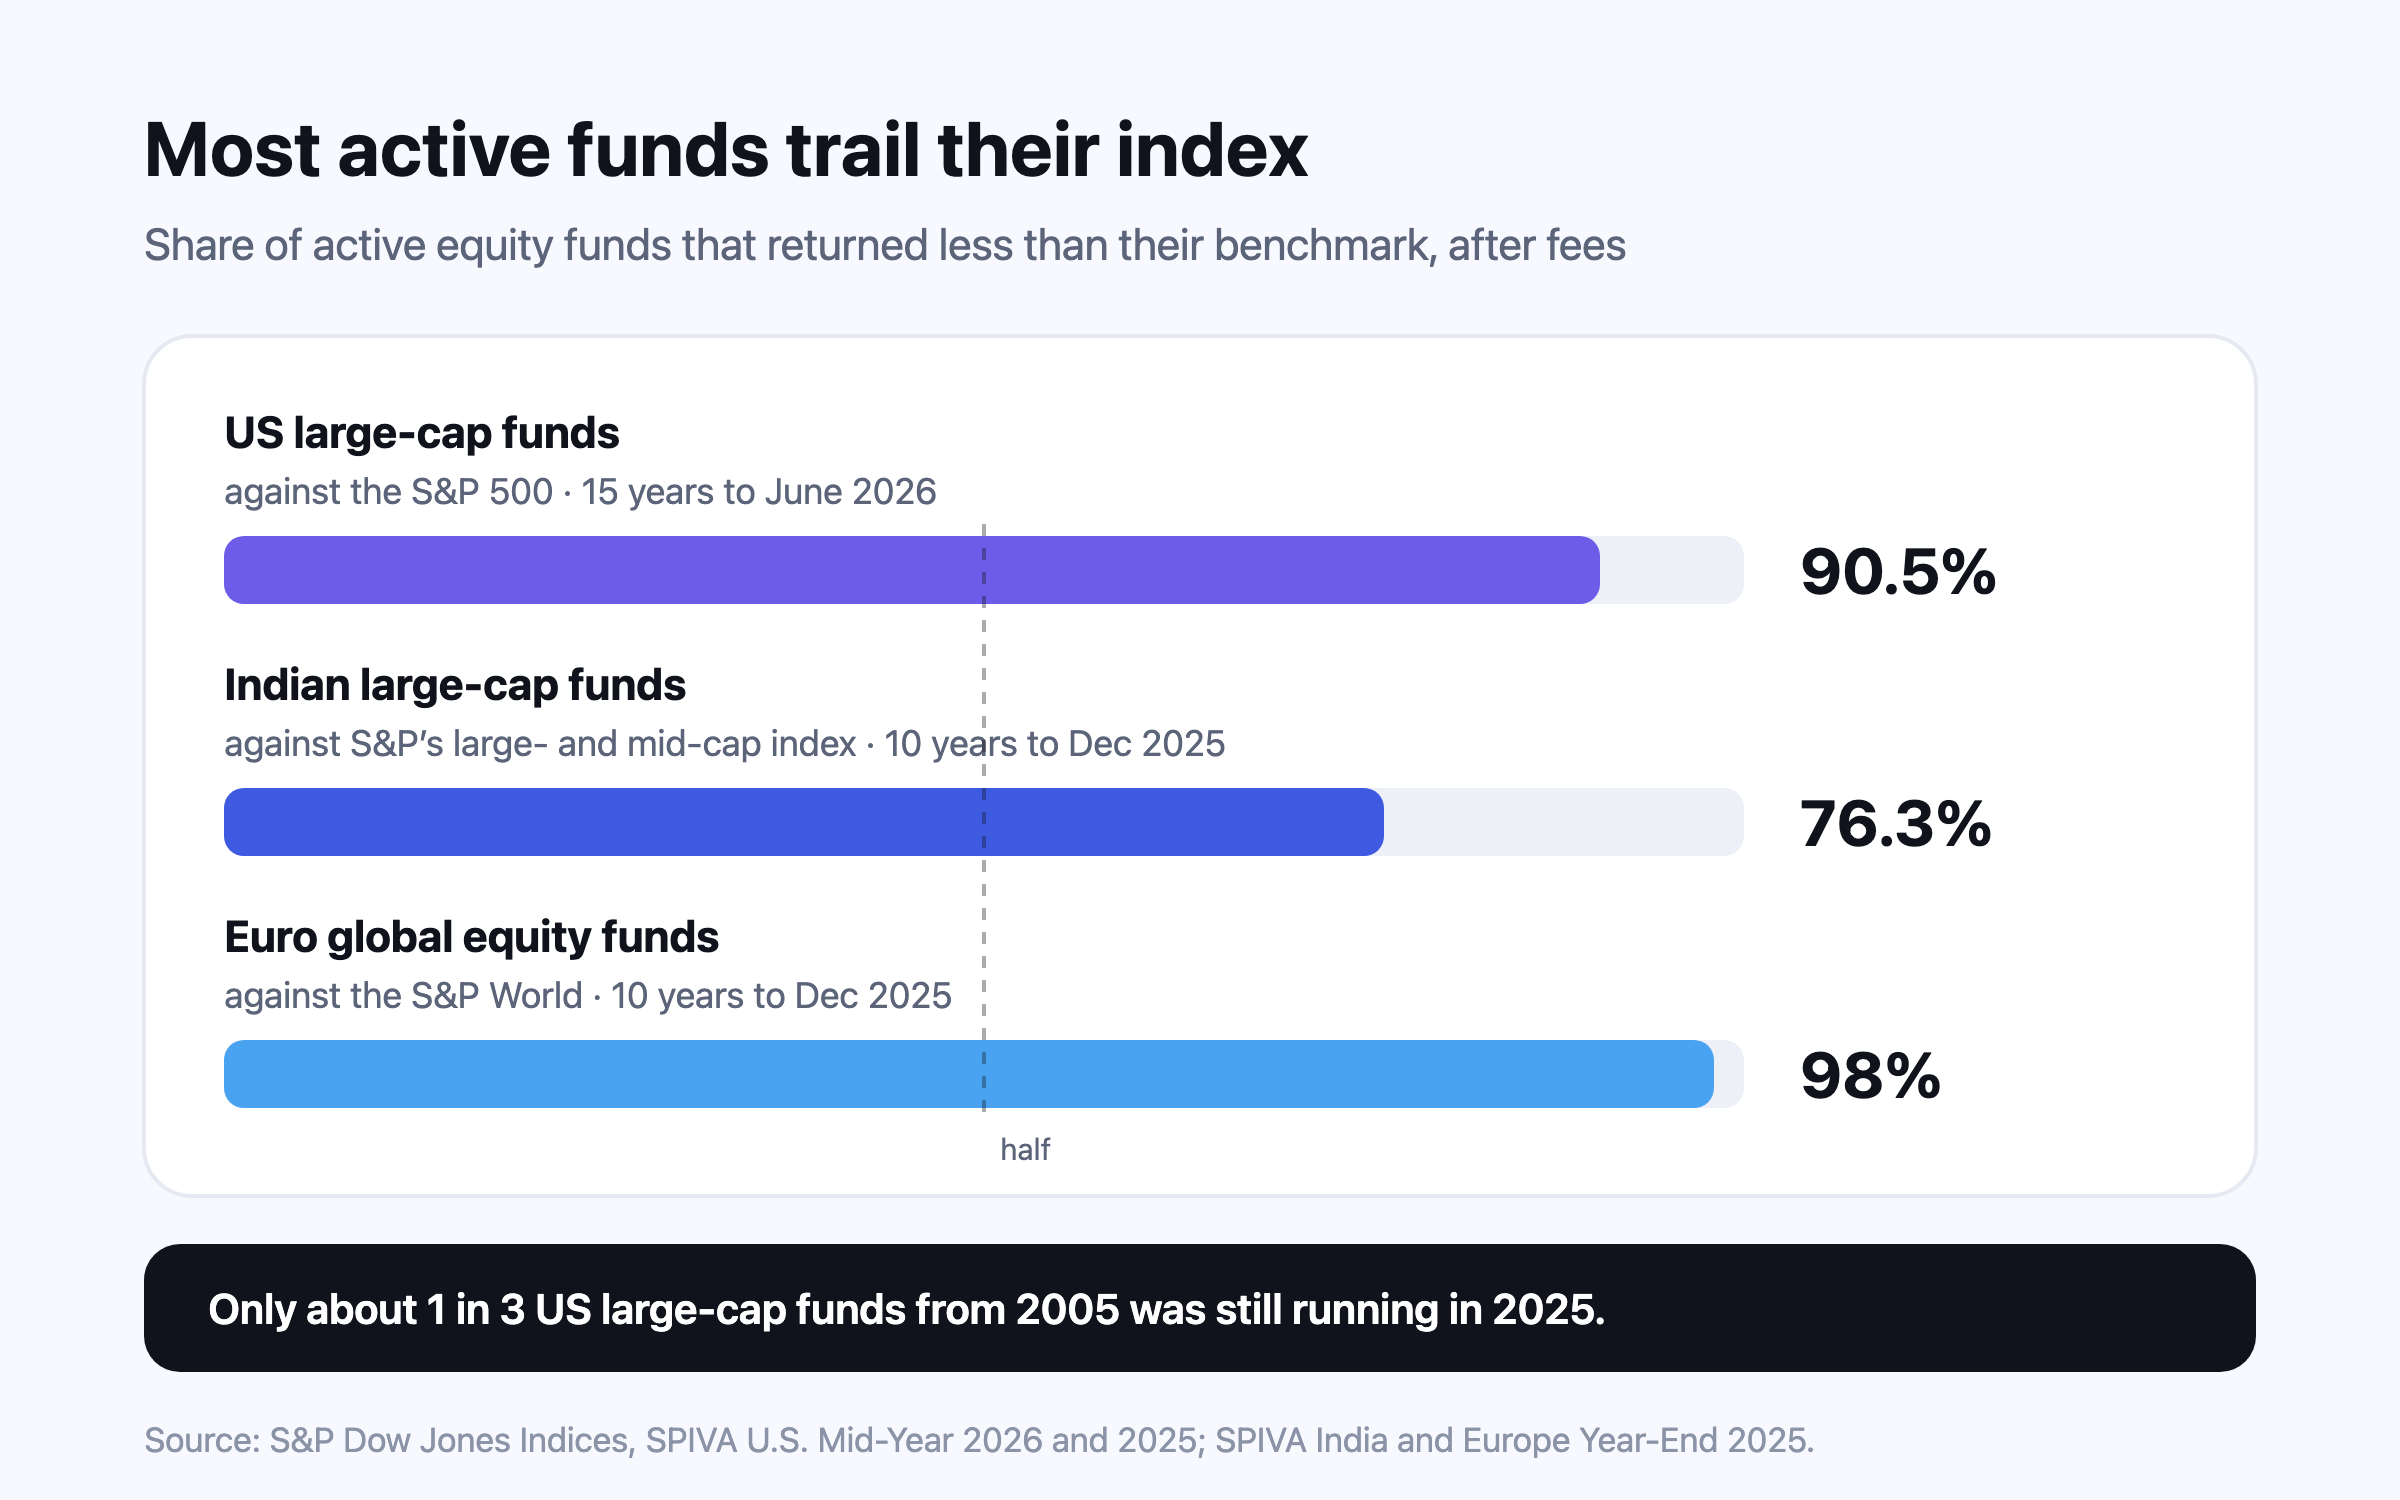
Most actively managed equity funds trail their benchmark after fees, and the share grows with time: to June 2026, 90.5% of US large-cap funds lagged the S&P 500 over 15 years. India and Europe show the same long-run pattern, with real exceptions — Indian mid- and small-cap funds had their best year against the index since 2014 in 2025. Winners rarely stay winners, and the cheapest funds succeed most often.
Investing & global markets

Every article on this topic

Global diversification: 125 years of returns

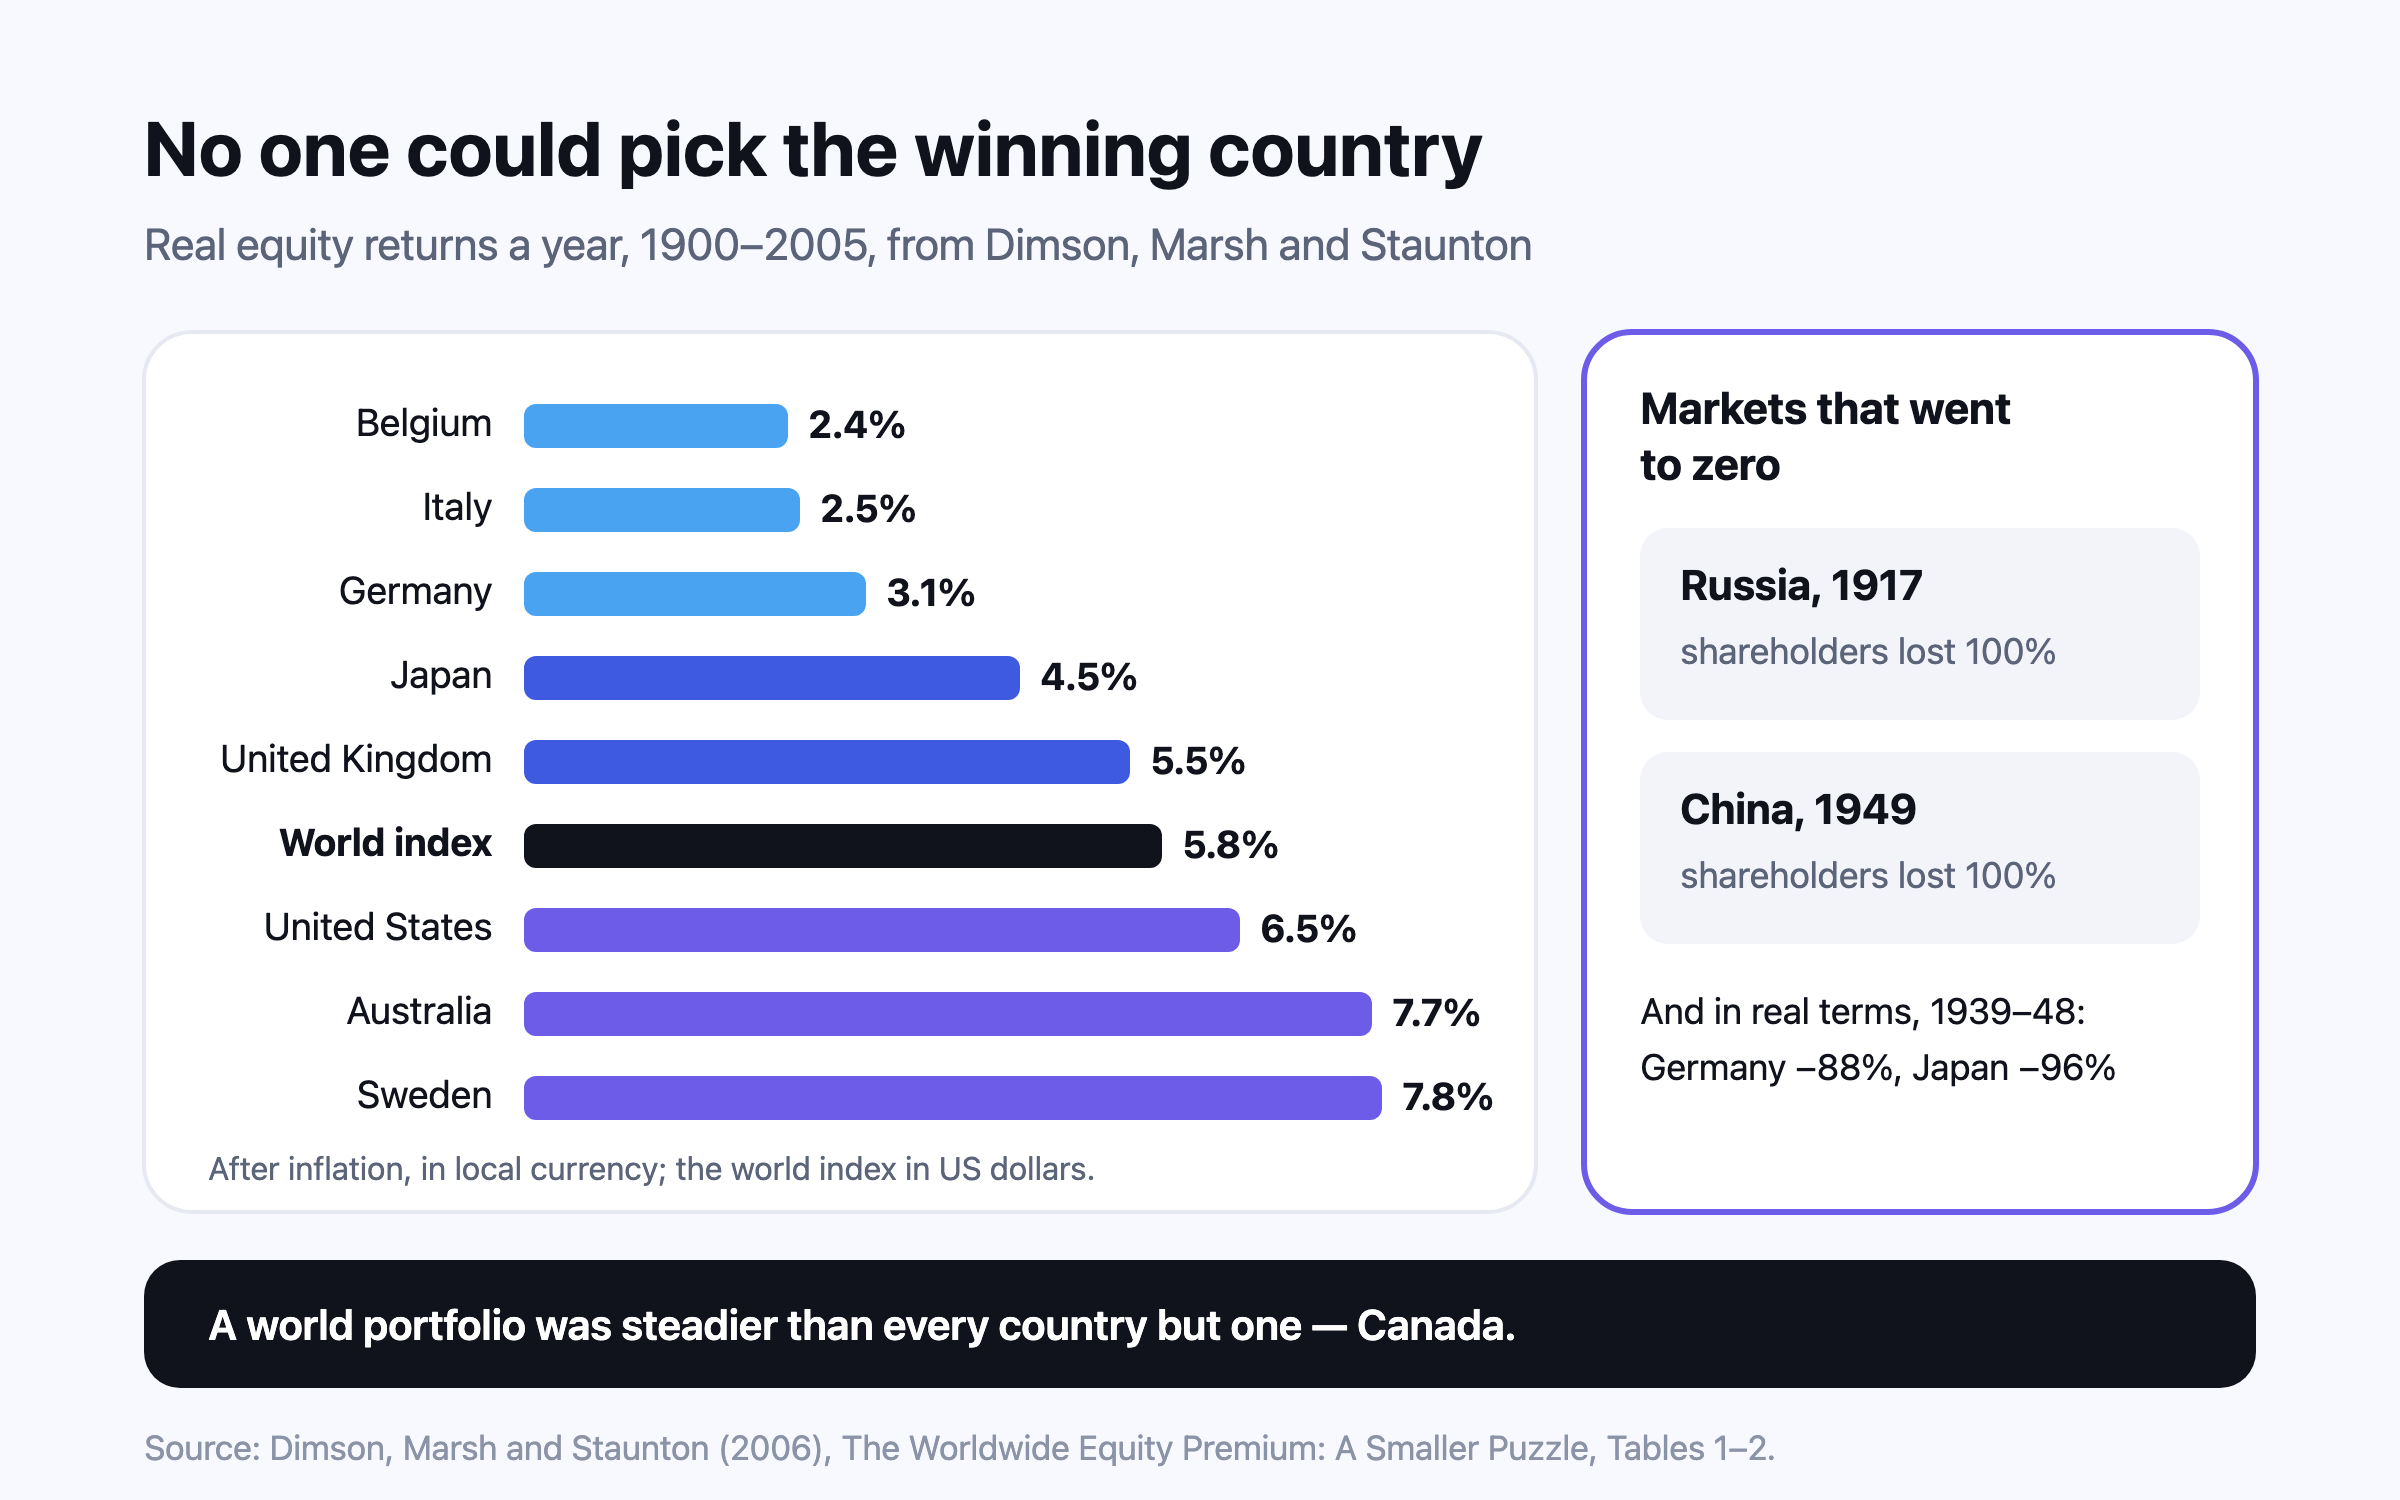
Across 126 years of the Dimson–Marsh–Staunton data, equities were the best asset in every market with a continuous history — yet over 1900–2005 real returns ranged from about 2.4% to 7.8% a year by country, Russian and Chinese investors lost everything, and German and Japanese shares fell over 85% in the 1940s. A world portfolio has been steadier than almost any single market. The US century was exceptional, and that is the reason not to assume it repeats.

SIP vs lump sum: what the evidence says

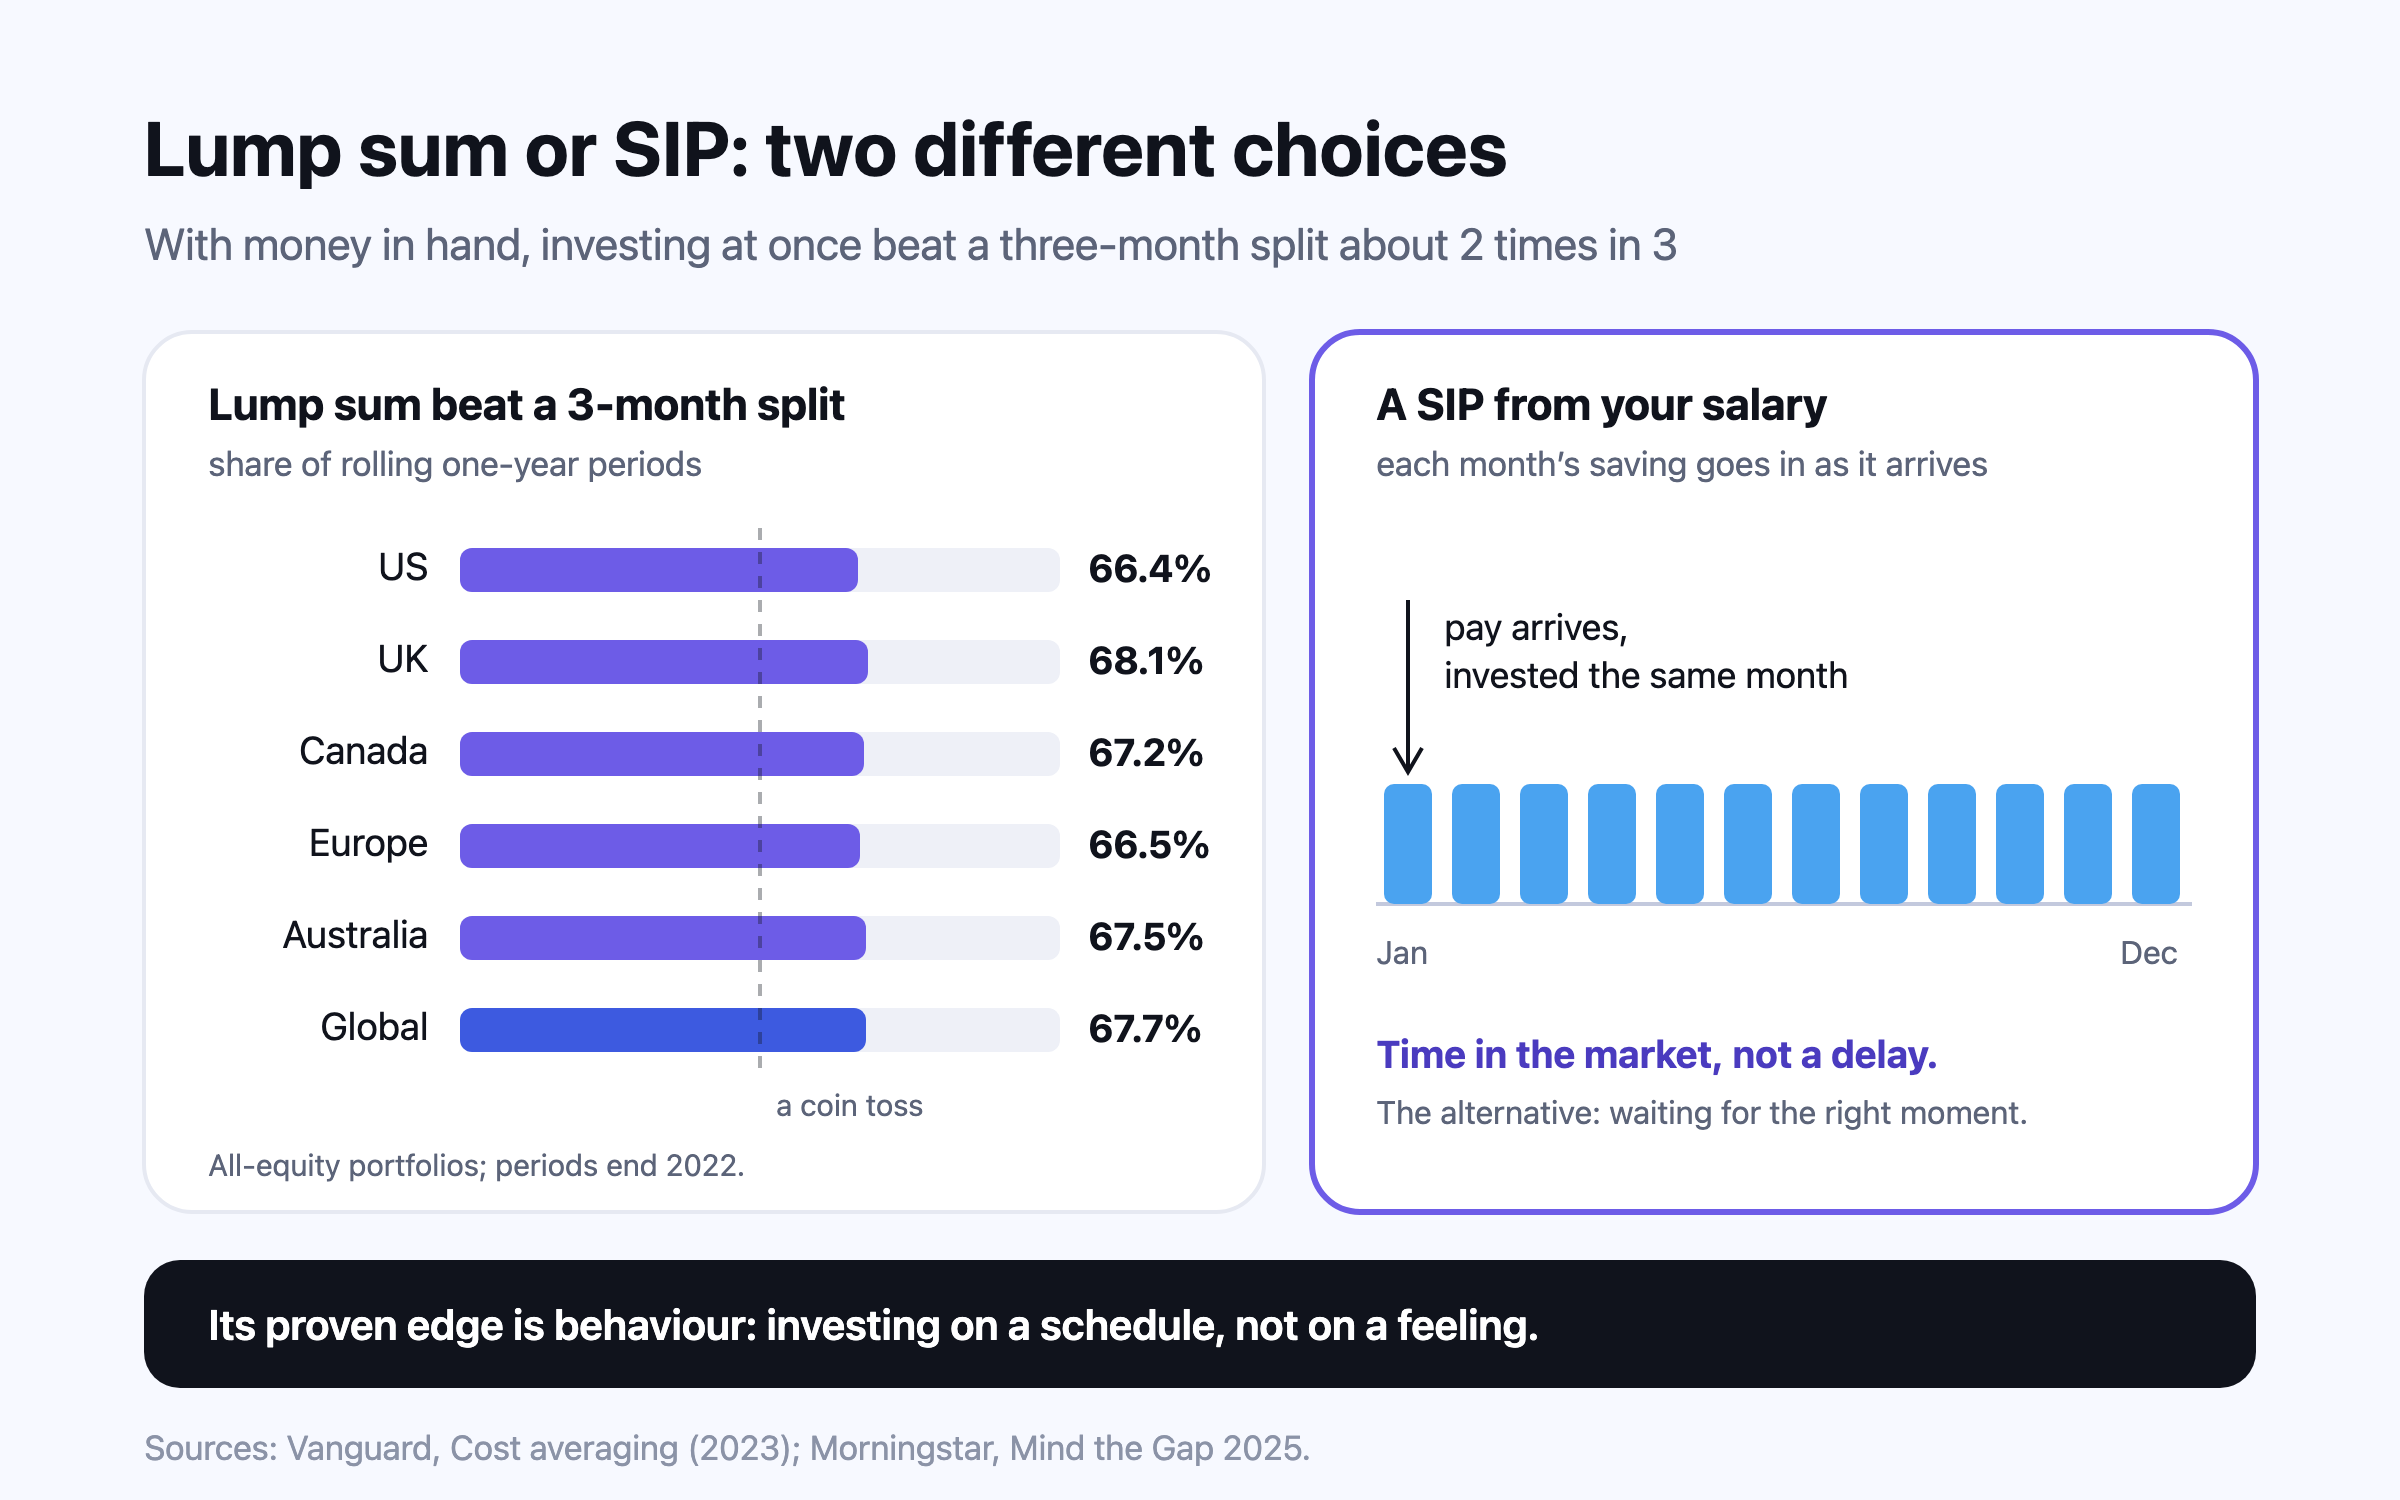
With money already in hand, investing it at once has beaten feeding it in over a few months roughly two-thirds of the time, by about 2% after a year for an all-equity portfolio, because markets rise more often than they fall. A SIP from each month’s salary is not that choice: it invests money as soon as it exists. Its real advantage is behavioural: automatic, regular investing takes the stop-start timing decisions out of investors’ hands.

Asset allocation by age: rules and glide paths

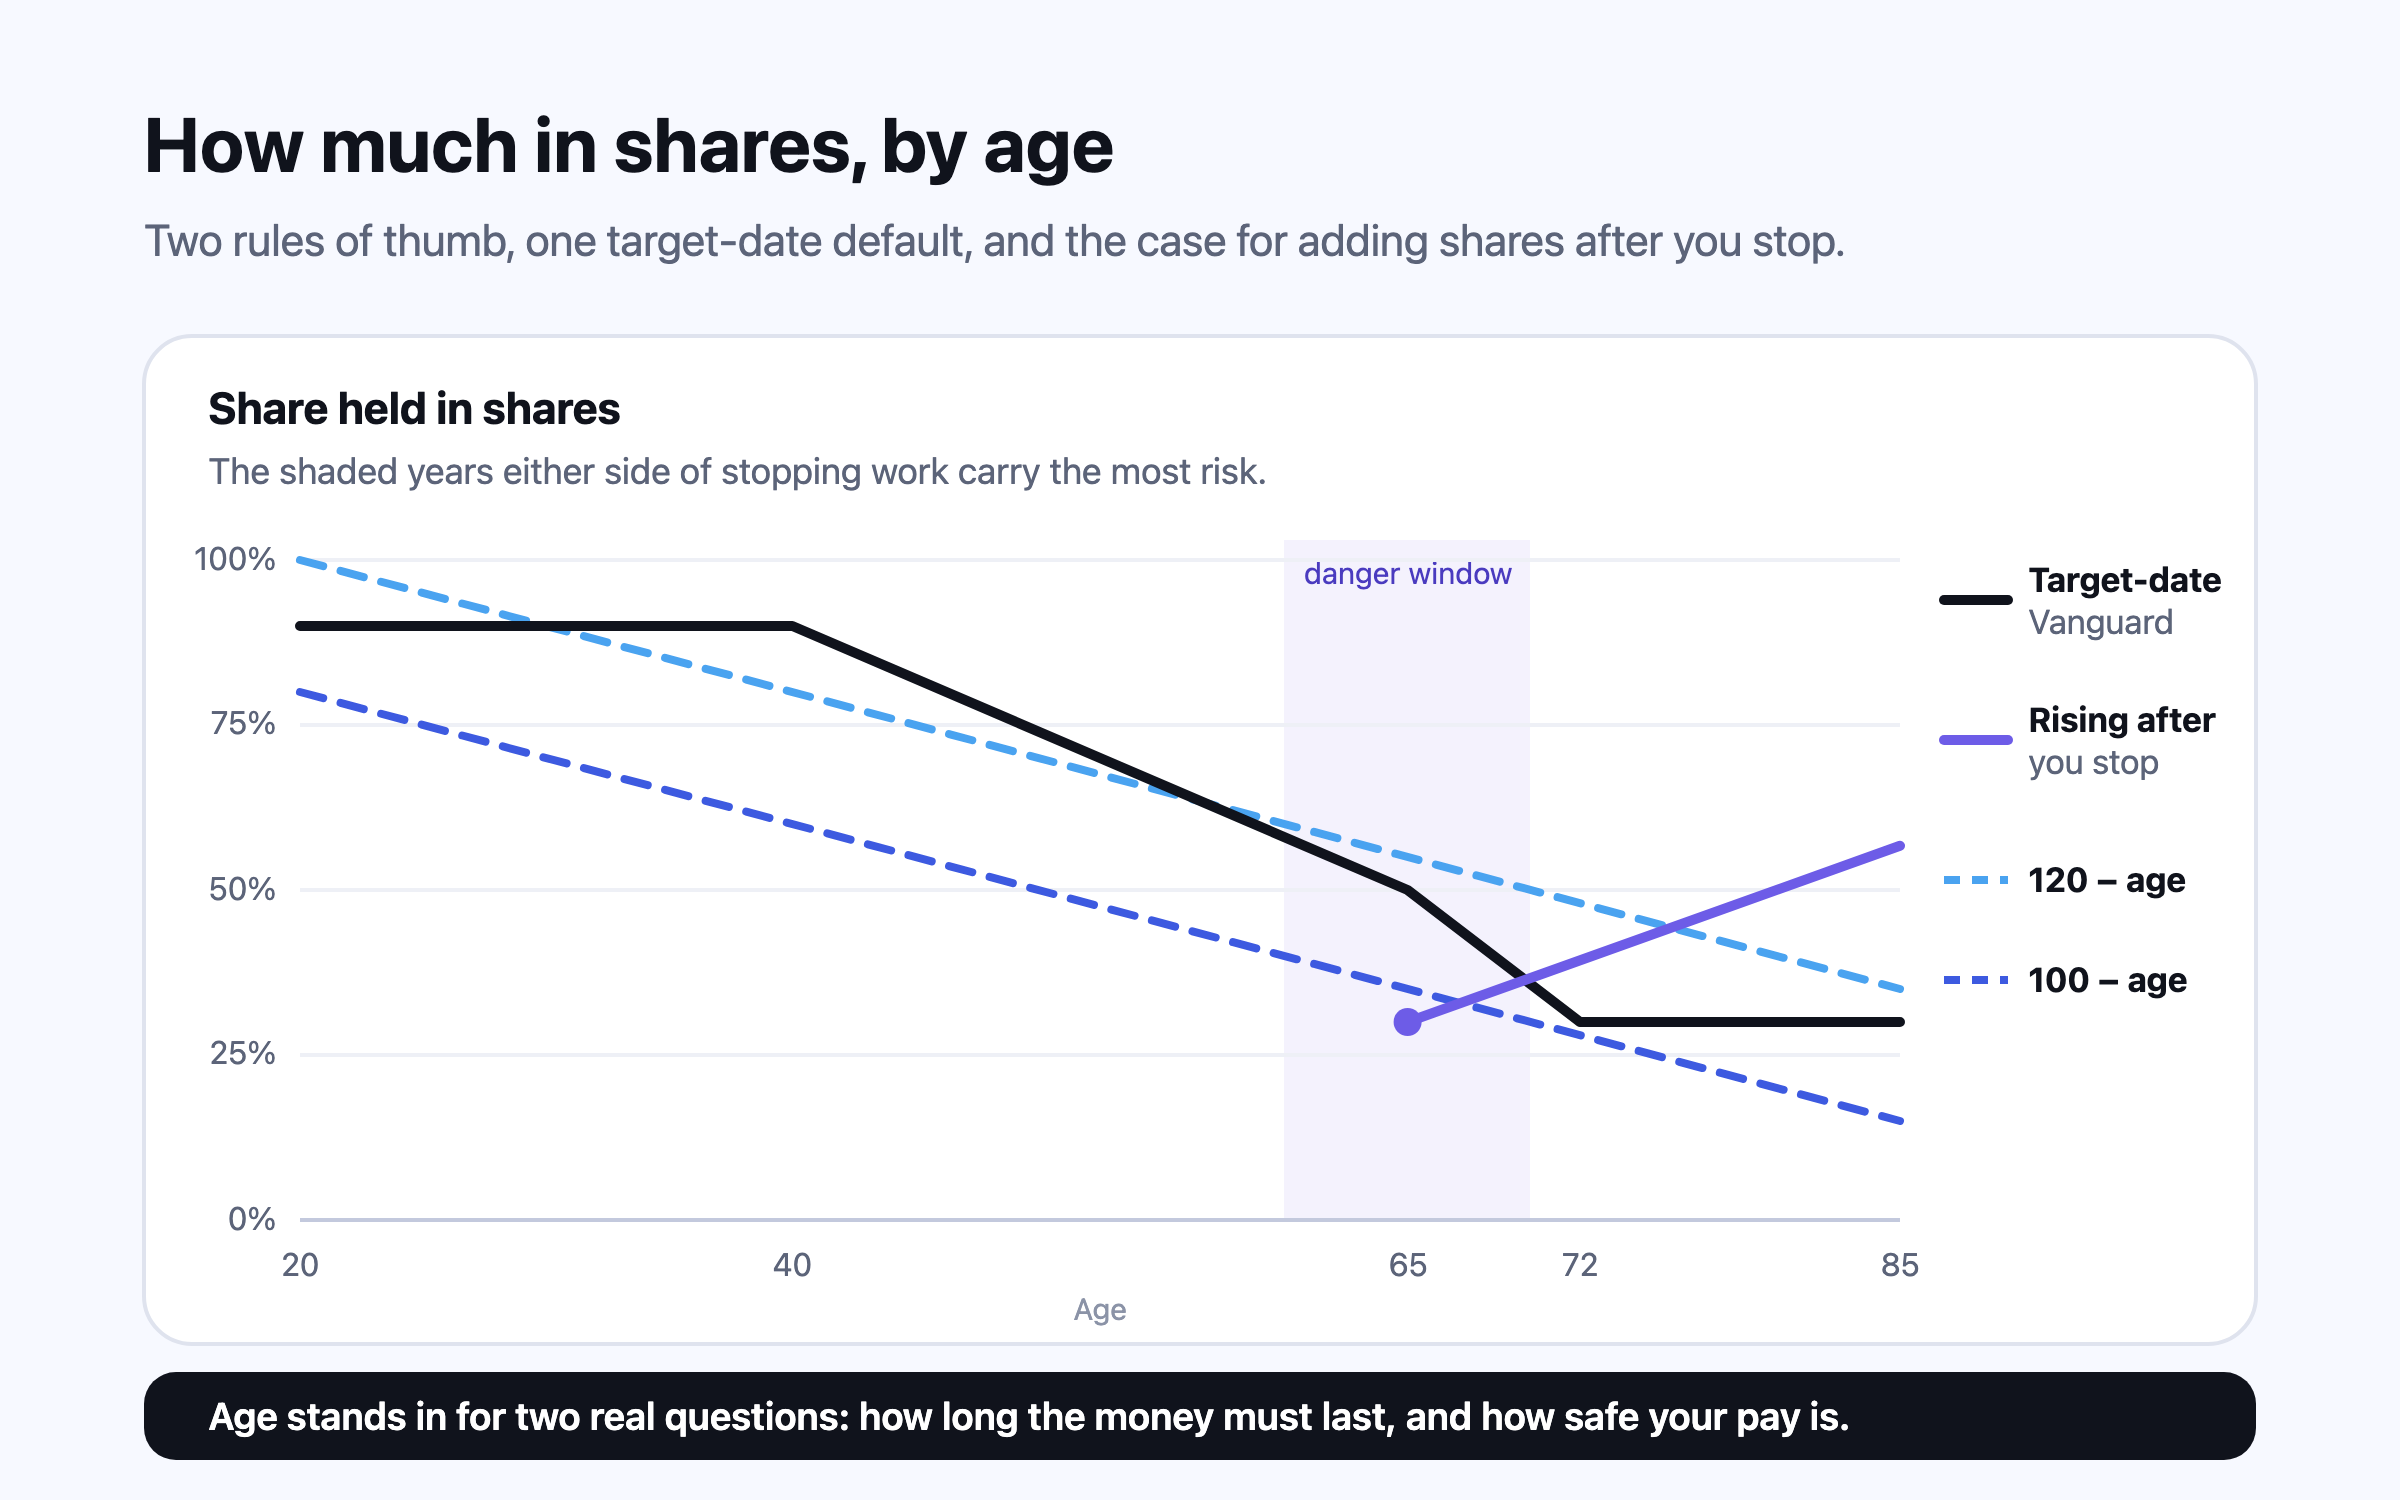
Rules like “own your age in bonds” and target-date funds both cut shares as you age — Vanguard’s default path holds 90% in shares until about 40 and 30% by 72. The research behind them is really about horizon and human capital: a long horizon and a steady salary can carry more shares, while the years either side of stopping work carry the most risk. Early retirees face a longer horizon and a longer danger window at once.

What investment fees cost over 30 years

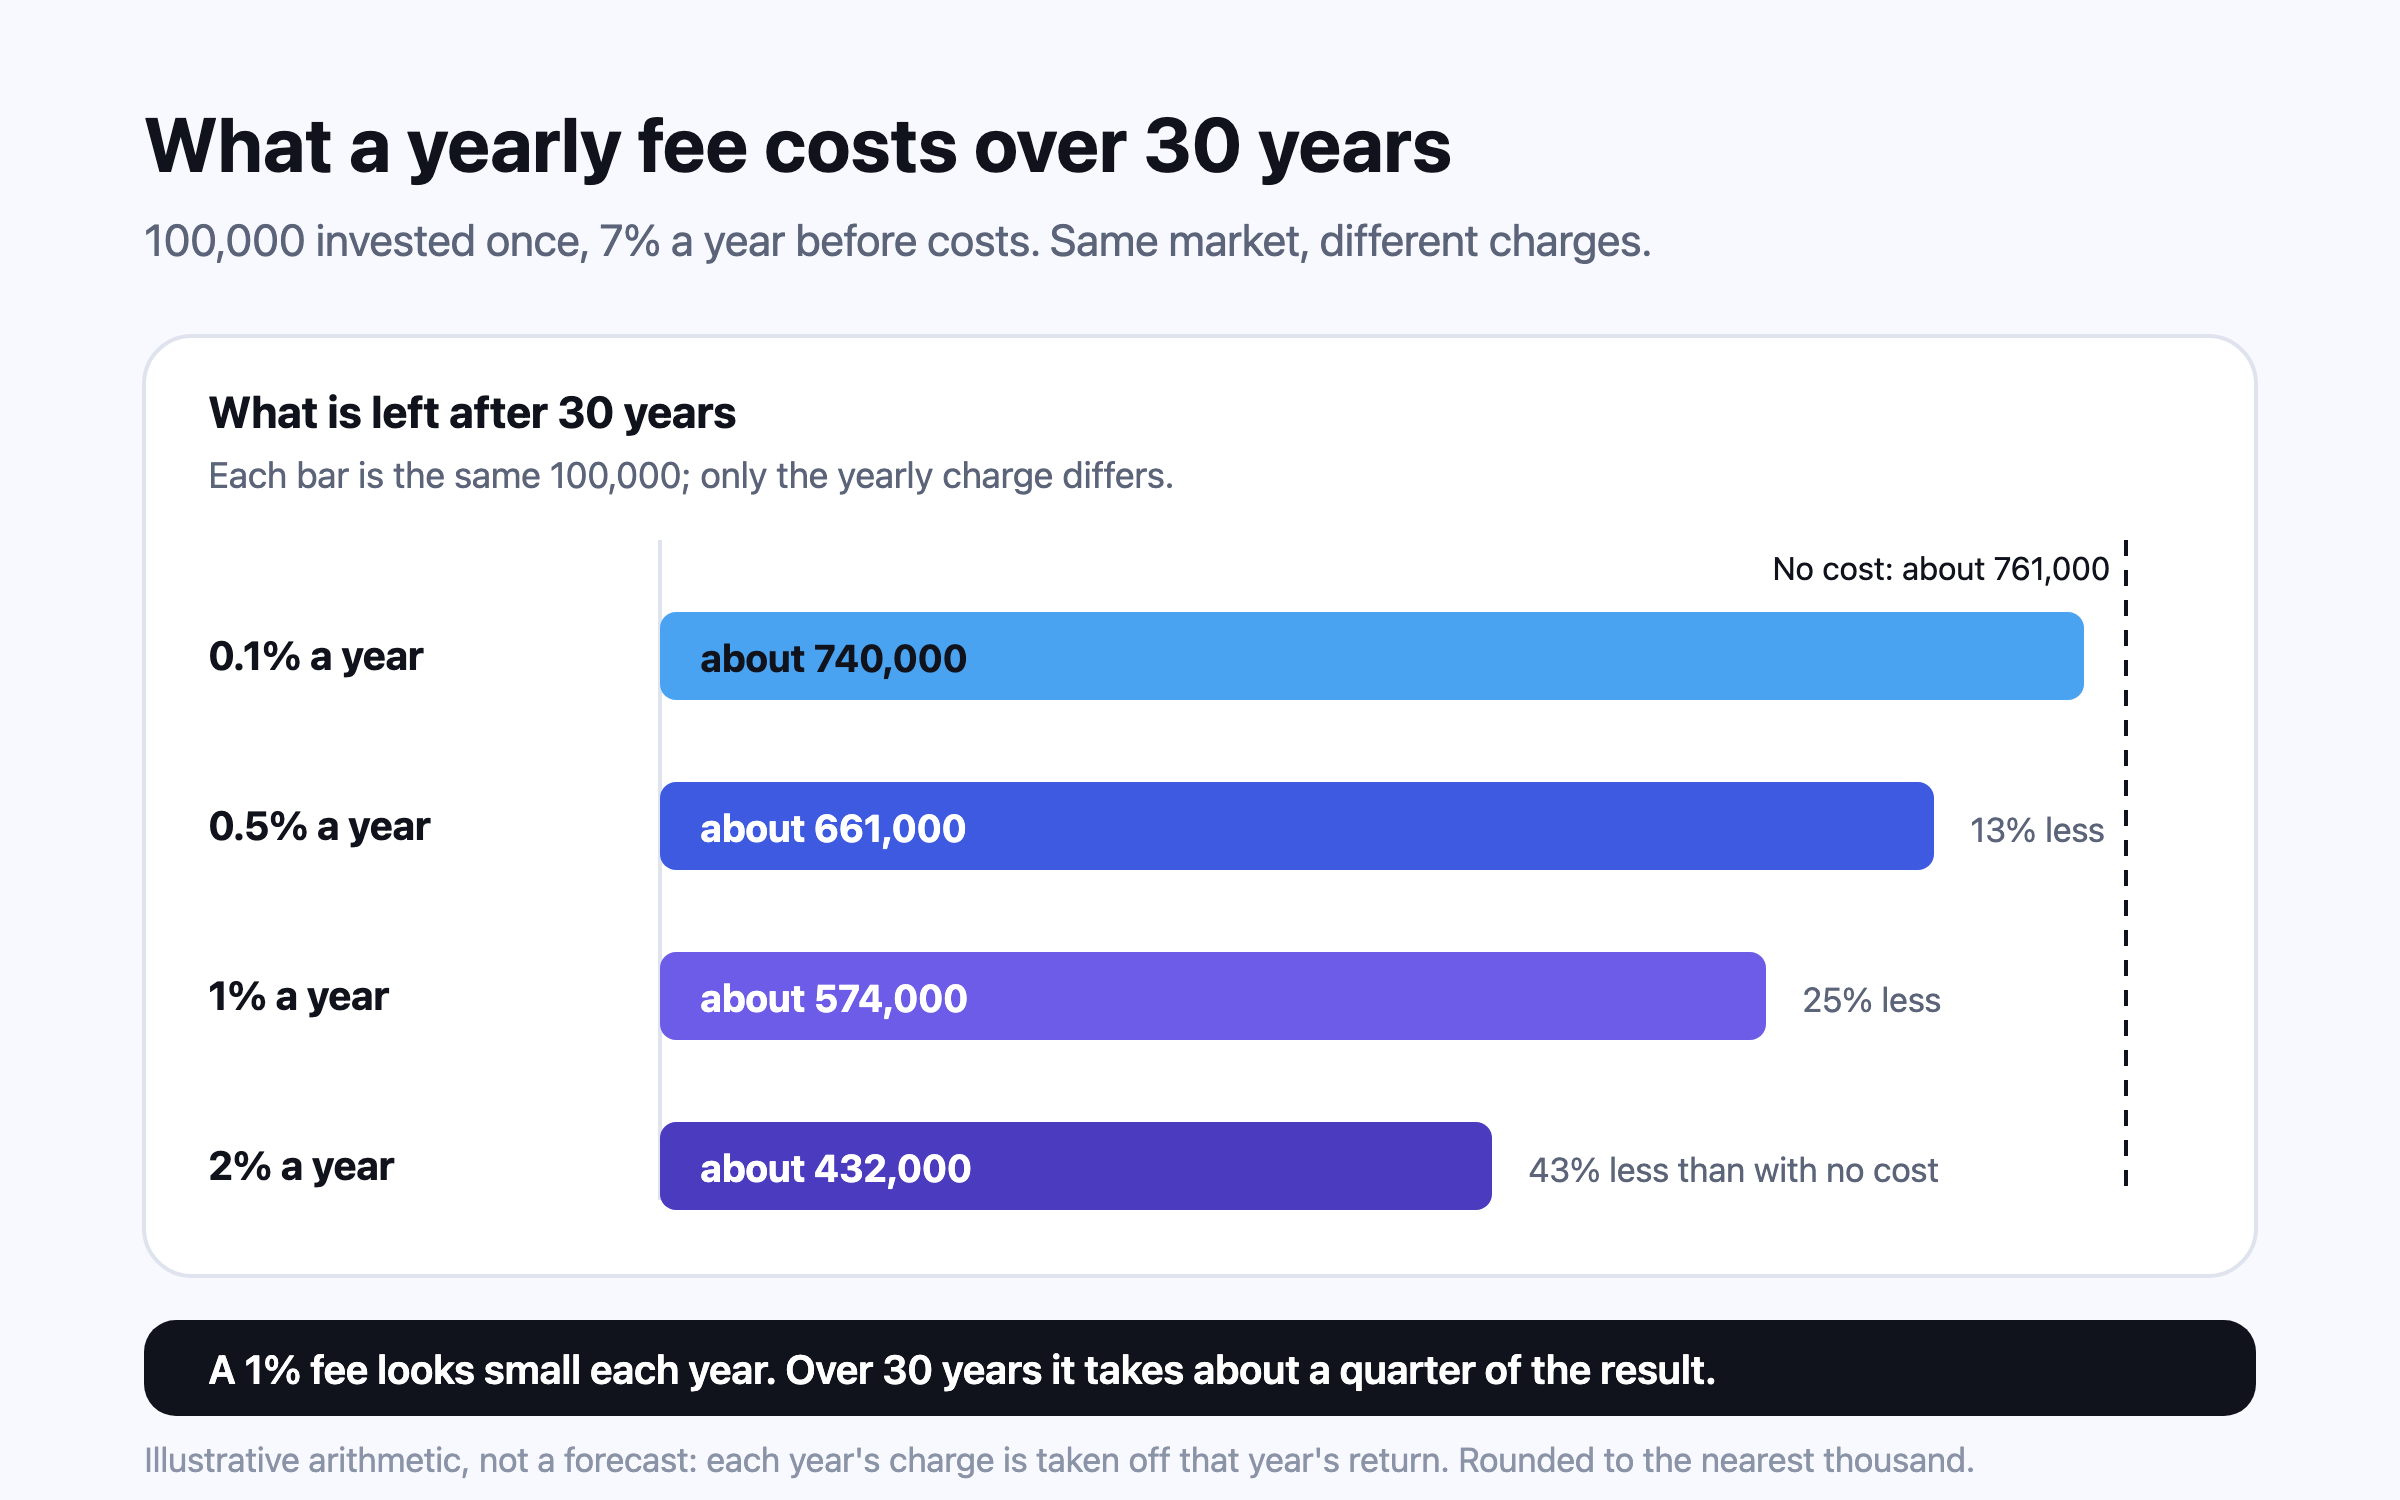
A fee is charged every year on the whole balance, so it compounds against you. On 7% a year before costs, a 1% yearly charge leaves about a quarter less after 30 years than no charge at all, and 2% leaves over 40% less. Fund costs have fallen sharply — US equity funds averaged 0.40% in 2025 against 1.04% in 1996 — but platform and adviser layers sit on top, and in India a regular plan carries a distributor’s commission that a direct plan does not.

Gold returns over 50 years vs stocks and inflation

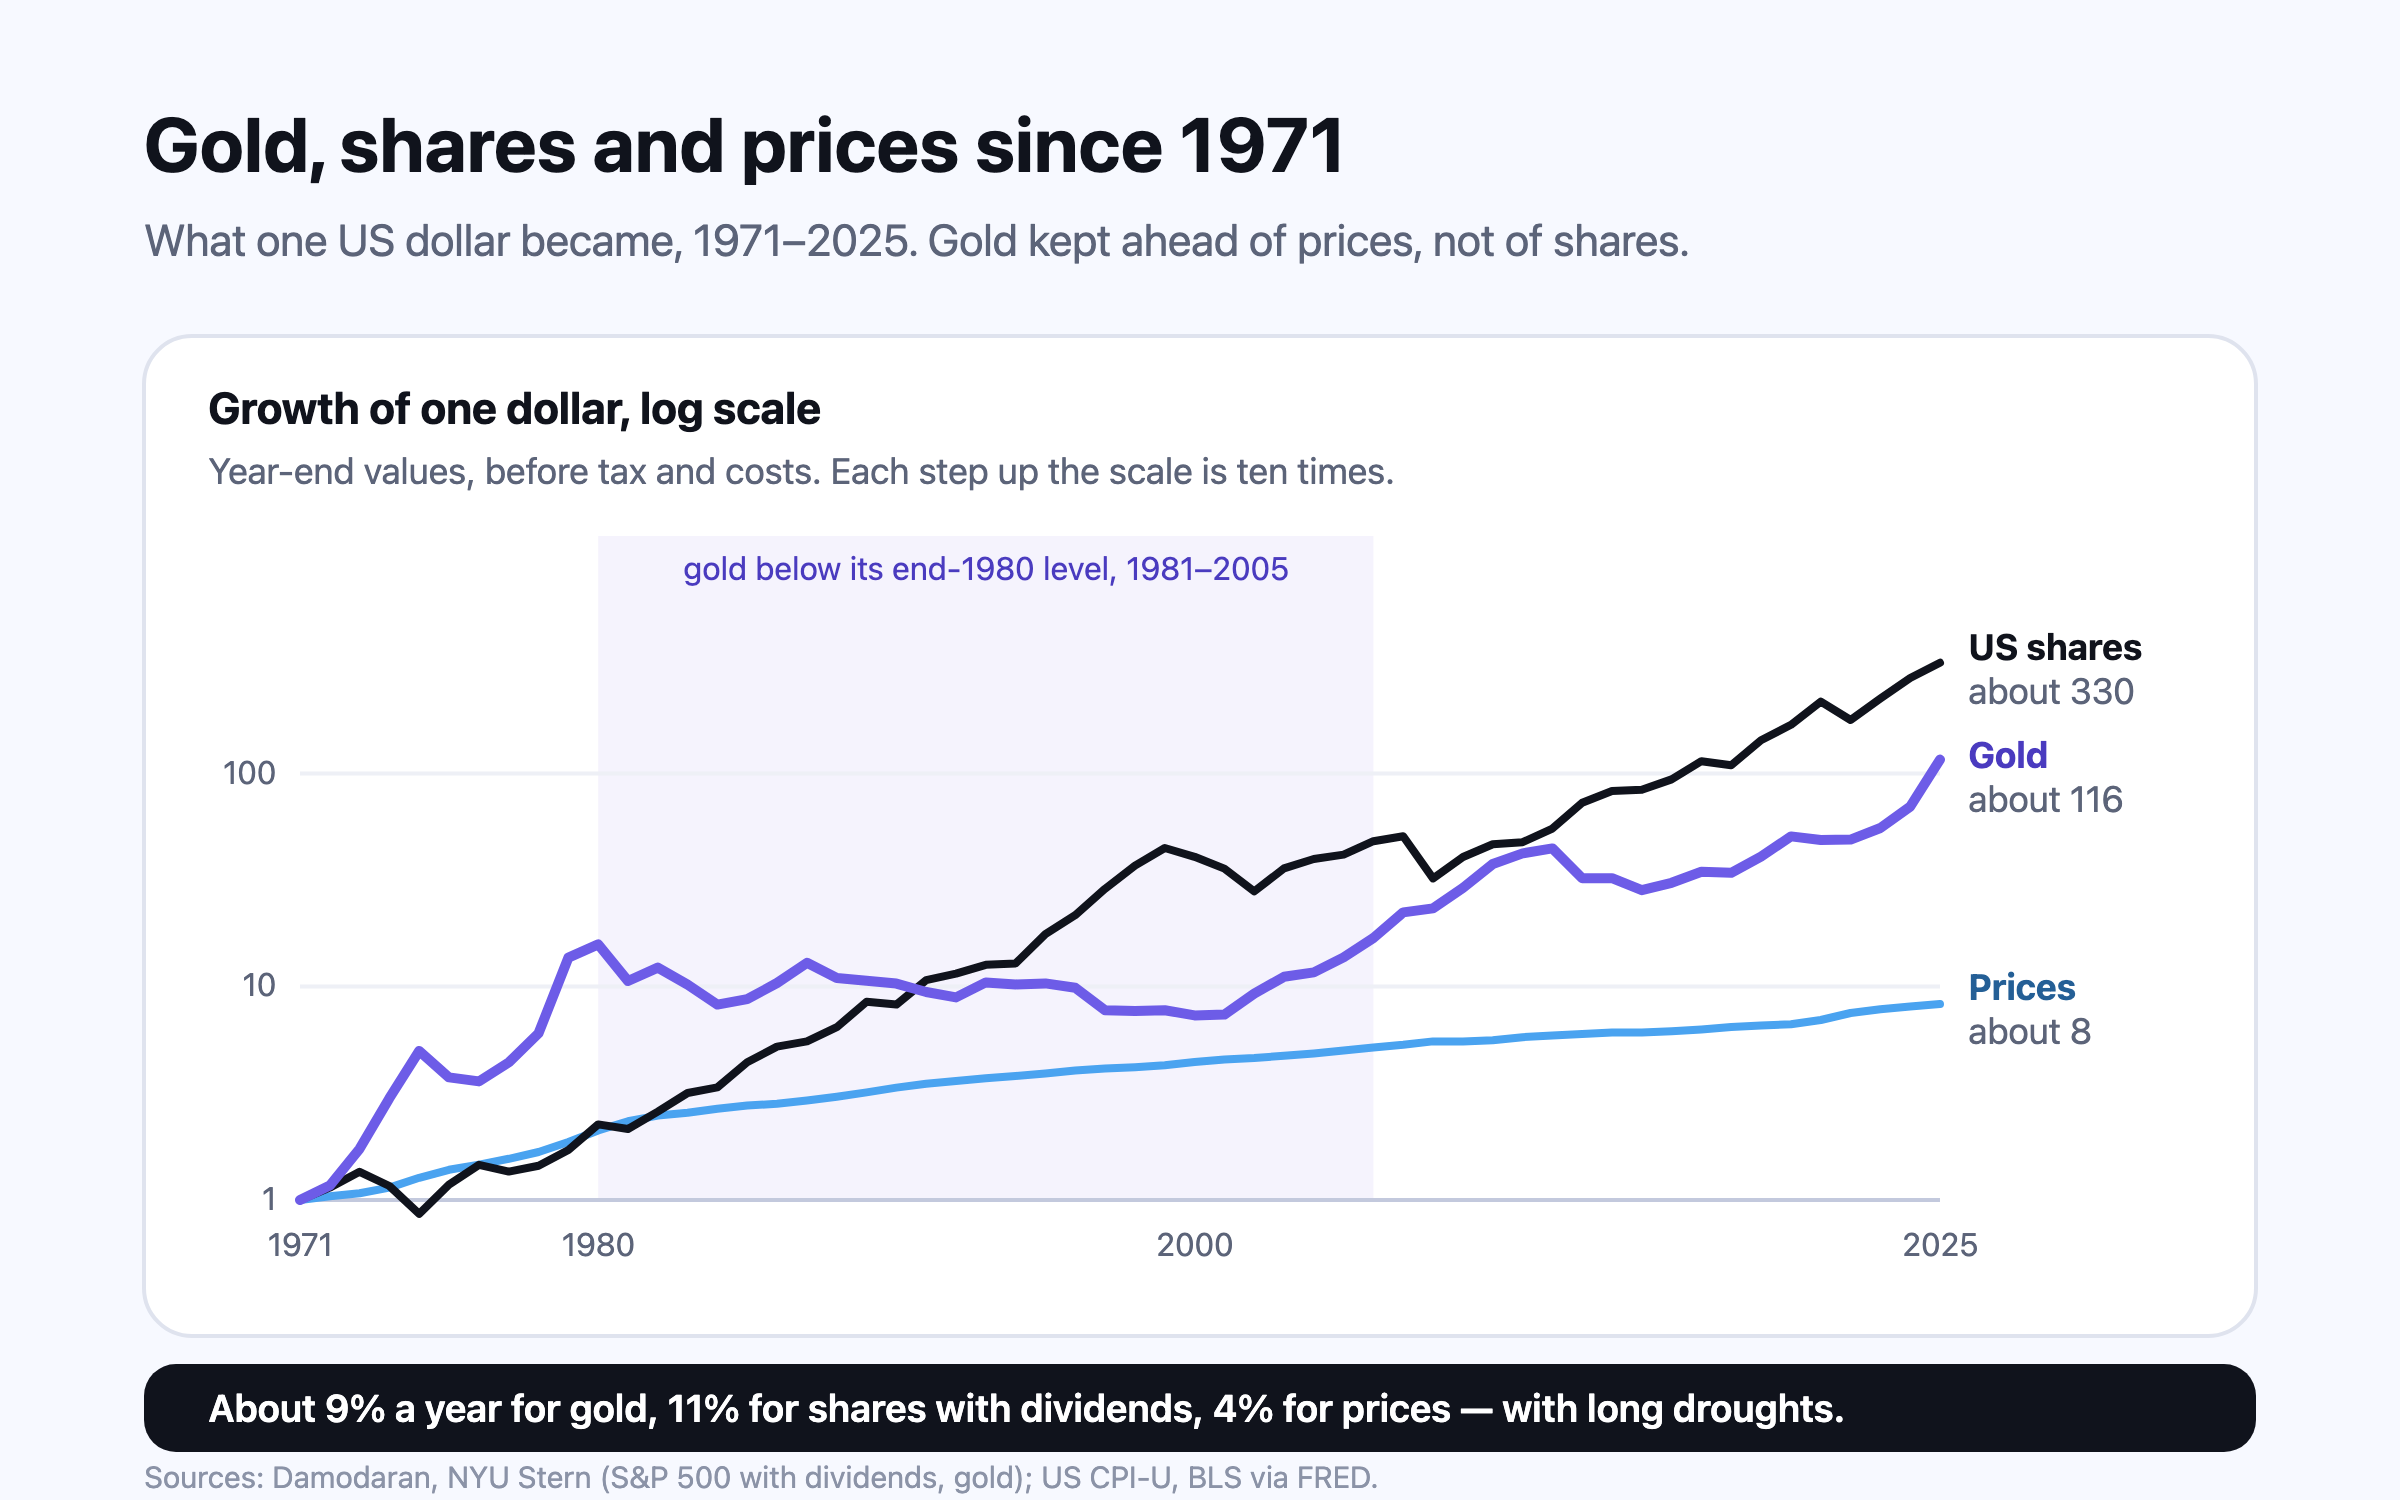
From 1971 to 2025 gold returned about 9.0% a year in dollars against 11.1% for US shares with dividends and 3.9% inflation. The average hides two long droughts: gold fell about 70% from its 1980 peak to its 1999 low and took until 2025 to pass that peak after inflation. For Indian households a weaker rupee softened the slump, and gold’s real case is as a diversifier that has often risen when shares fell, not as a growth engine.

Now run the numbers on your own money.

Nivritee projects your family’s plan in the country you will live in, tracks every investment in one currency, and shows where each pound, dollar or rupee should sit. Free, and nobody here reads your plan.

Start free