When markets swing, the number on your app’s front screen is the least useful one: what you have earned on your own money, timing included, is the XIRR.
The NIFTY 50 fell 6.06% in September 2026, the S&P 500 had its worst day since July on 14 October, and the rupee sat near a record low. A family can be down 4% in a month and still be earning about 11% a year on everything they have put in. This article shows why, works the XIRR through step by step, and sets out a weekly and monthly routine that looks at the right numbers.
Nivritee Research · 17 October 2026 · 11 min read
The short answer: the number your app shows first, the change today or this month, measures the market, not you. In September 2026 the NIFTY 50 fell 6.06%1, and on 14 October the S&P 500 fell 1.1% on a hot US inflation report2. Neither tells you what your own money has earned. That figure is the XIRR, which counts when every rupee or dollar went in. Look at it monthly, look at the day change rarely, and decide nothing on a day the market is loud.
a year lost by US fund investors to timing, ten years to 2025
Kavya and Rohan live in Bengaluru and have two children. For three years they have put ₹25,000 a month into two mutual funds by SIP, ₹15,000 into a NIFTY 50 index fund and ₹10,000 into a flexi-cap fund, and a year ago Rohan bought $4,000 of US shares through an overseas brokerage account. They are an illustrative household, with round figures, but their October is a common one. On the evening of 12 October, the day the Sensex closed 547.65 points lower5, Kavya opened the fund app on the sofa and saw red: the holdings were down 4% over the month. Later that night she checked again, as if the number might have changed. It had not, and she slept badly.
This article follows their month. It sets out what actually moved in India, the US and Thailand and why, as it was reported; then what checking every day does to the decisions people make; then the four numbers a tracking app can show and the one that answers Kavya’s real question, which is not “what happened today?” but “is our money working?”. It ends with a routine that takes ten minutes a week.
What moved, and why
The story of these weeks was interest rates. On 16 September the US Federal Reserve raised its policy rate by a quarter point, to a range of 3.75% to 4%, by a vote of 12 to 06. Higher US rates pull money towards US bonds and away from riskier markets, and the reports of the following weeks keep returning to that theme3.
India took the hardest hit. The NIFTY 50 closed August at 24,080.40 and September at 22,620.45, a fall of 6.06%; the Sensex fell 5.82% and the NIFTY IT index 11.18%1. DSIJ’s closing report called it the NIFTY’s weakest September since 2018, and put it down to foreign selling, crude oil and worries about global technology spending7. The selling went on into October: foreign portfolio investors withdrew about ₹44,166 crore from Indian shares in the first nine days of the month, and on 12 October the NIFTY closed at 22,363.355. On 7 October the Reserve Bank of India raised its repo rate by 25 basis points to 5.50%, its first increase in nearly four years, as the rupee fell to about ₹96.84 to the dollar, close to its May record low of ₹96.968.
By a number of estimates, including the REER, the rupee is not overvalued; it may be undervalued.
— Sanjay Malhotra, Governor of the Reserve Bank of India, 7 October 20268
The US barely noticed, and then it did. On 6 October the S&P 500 closed at a record 7,818.93, topping the record it had set in August9. Then on 14 October the September consumer price index showed prices 3.7% higher than a year earlier, up from 3.4% in August and above the 3.6% economists expected. The S&P 500 fell 86.51 points, or 1.1%, to 7,718.94, its worst day since July, and the Nasdaq fell 1.9%; the chance traders put on another Fed rise at the next meeting went from 22% to nearly 35%2. Even so, that left the S&P 500 only about 1.3% below the record it had set eight days earlier9,2.
Then India bounced. On 15 October, a day after the US fall, the NIFTY rose 1.66% to 22,997.35 and the Sensex 2.11%, their biggest one-day gain in four months. The gains spread across IT, carmakers, infrastructure, oil and gas and private banks, with IT lifted by HCL Technologies’ results, though more shares fell than rose that day10. On 16 October the NIFTY added another 0.65% to 23,146.1511. Anyone who sold on 12 October sold close to the low of the period shown below.
NIFTY 50 closing level, 31 August to 16 October 2026.
Closing levels on the days reported. The 14 October close is the 15 October close less that day’s reported gain of 374.65 points. A fall of about 7% over six weeks, then a rise of about 3.5% in four sessions. 1,7,5,10,11The figures in this chart
NIFTY 50 close
31 Aug
24,080
30 Sep
22,620
12 Oct
22,363
14 Oct
22,623
15 Oct
22,997
16 Oct
23,146
Thailand moved less. The SET Index ended September at 1,559.01, down 2.3% in the month and still up 23.8% since the end of 2025; the exchange’s own report pointed to the Fed’s rise and high US yields, flooding late in the month, and foreign investors selling a net ฿26.33 billion of shares3. For a family holding Thai shares the month was dull. For one holding Indian IT funds it was bruising.
Change in September 2026, by index.
End of August to end of September. The same month looked very different depending on which market, and which part of it, a household owned. 1,3The figures in this chart
Change in September
NIFTY IT
−11.18%
NIFTY 50
−6.06%
Sensex
−5.82%
SET Index
−2.30%
What checking every day does to you
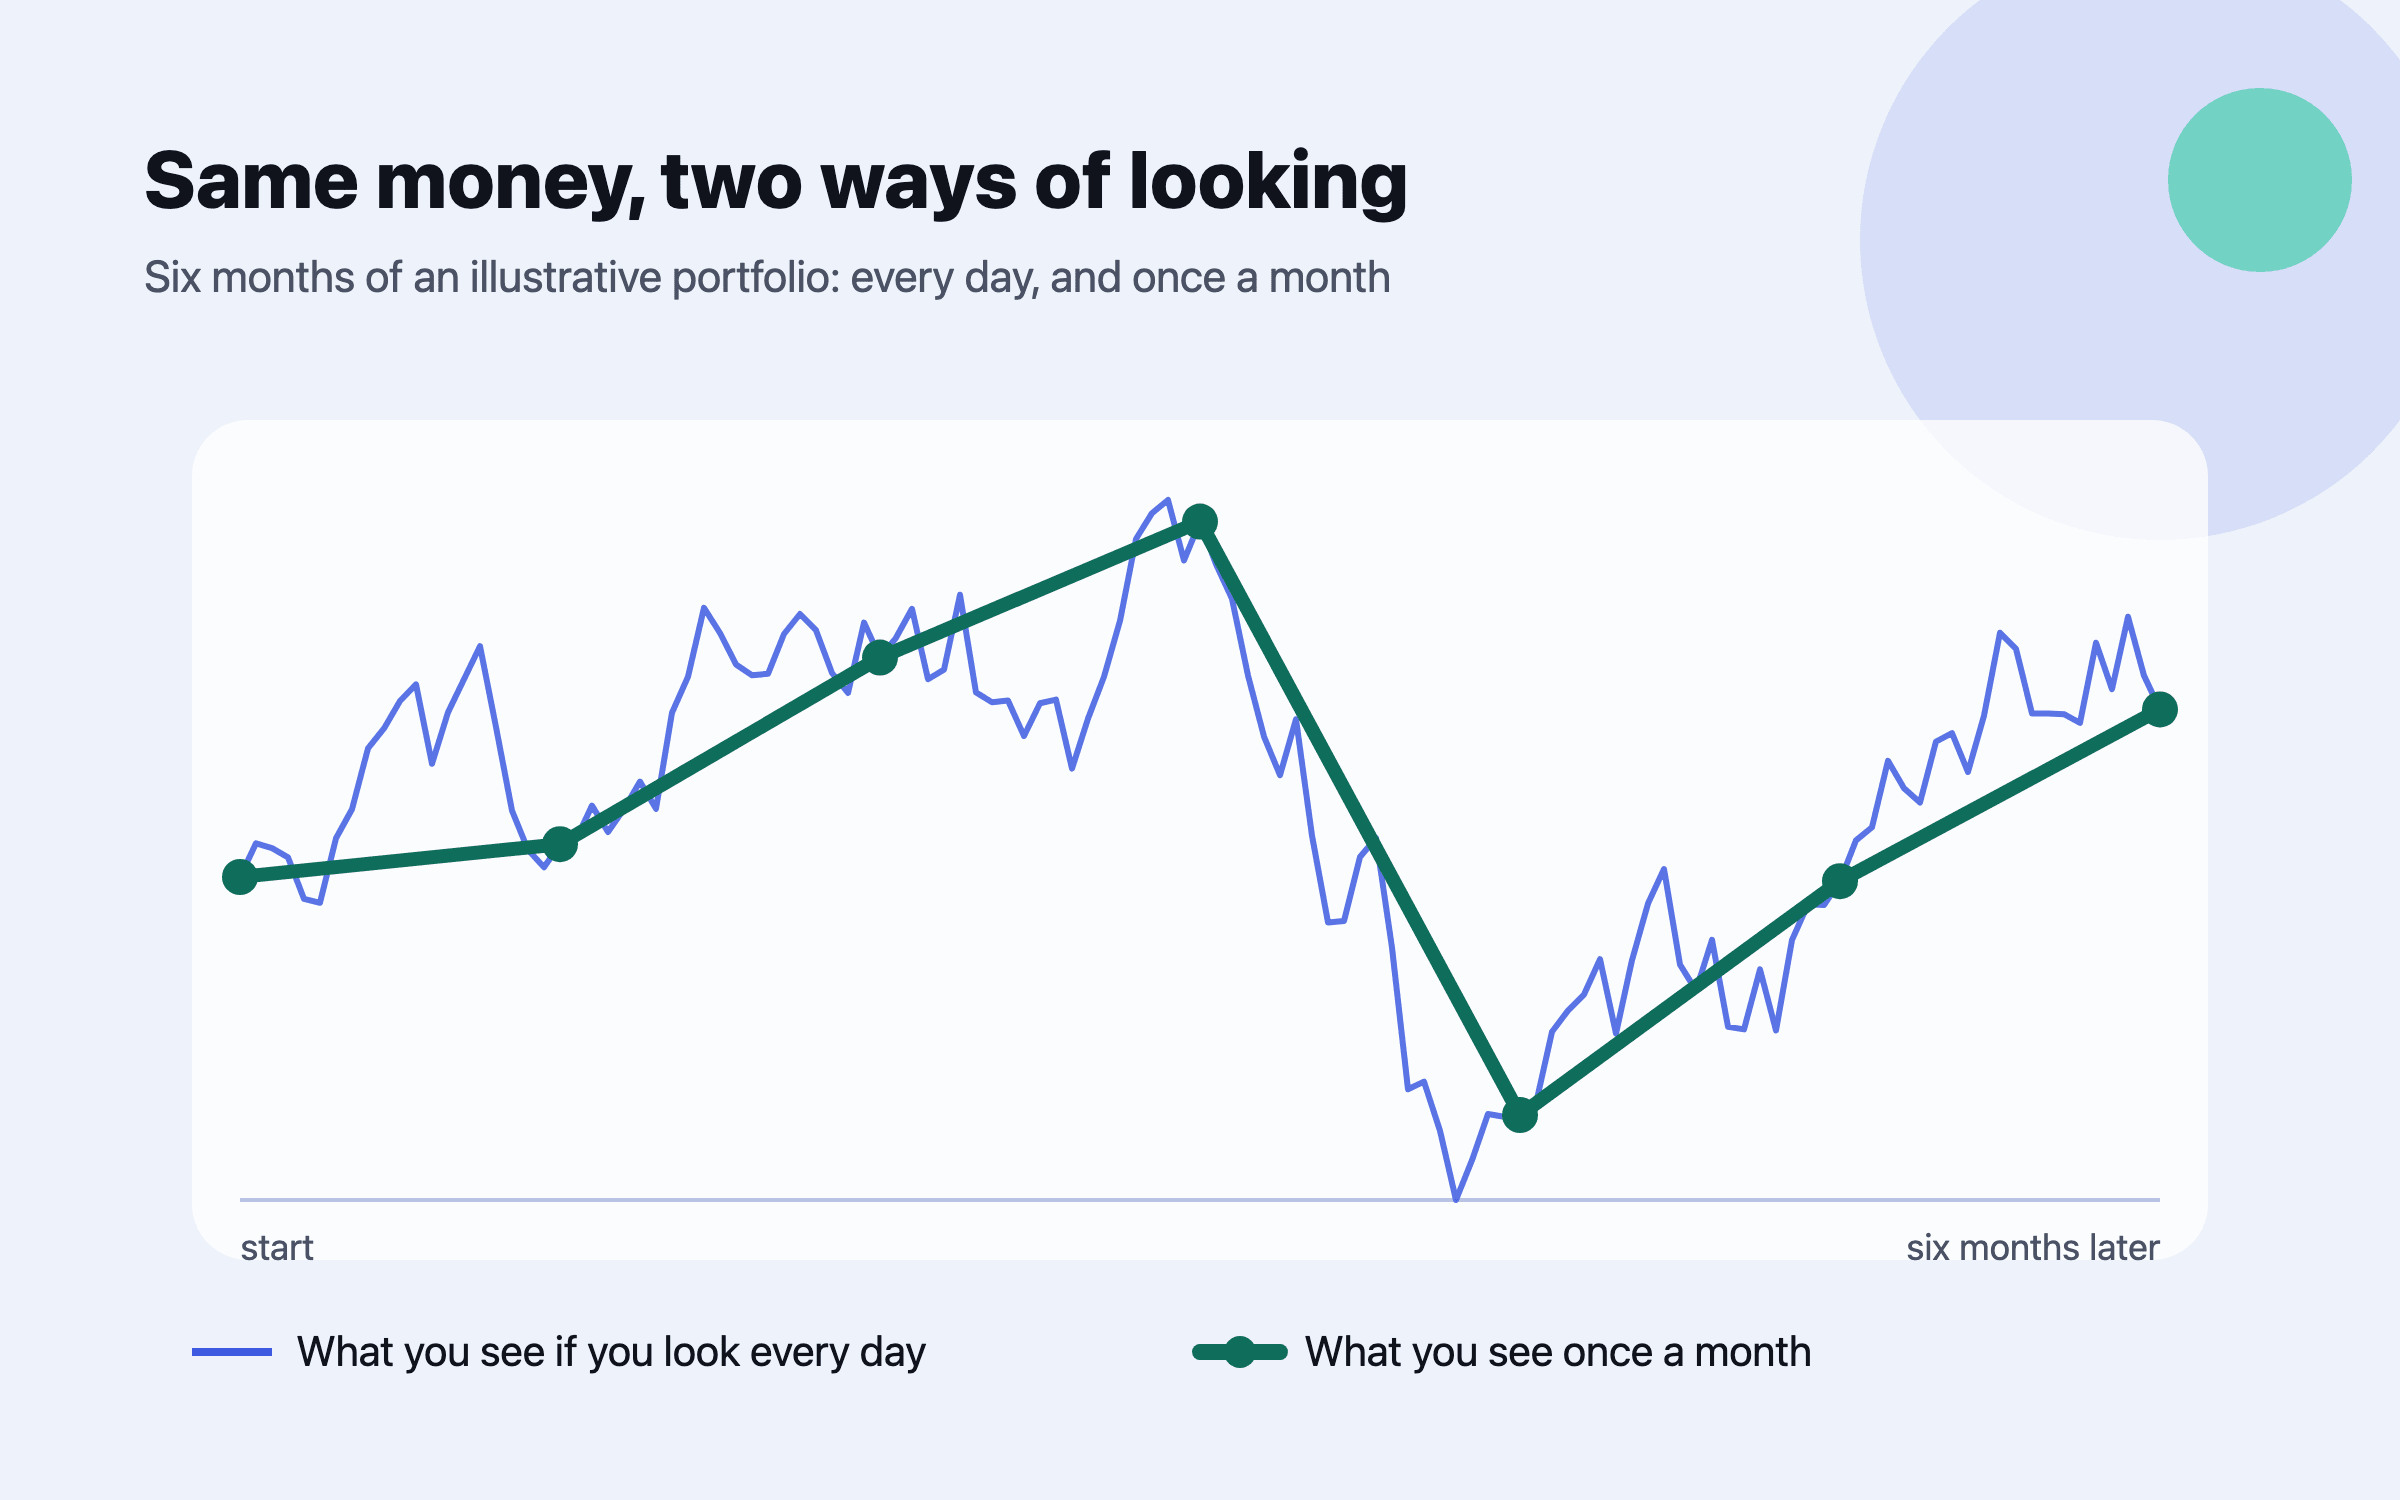
Most people track their money in one of three ways: a broker or fund app with a coloured number at the top, a spreadsheet updated now and then, or both. The app is the problem only in one respect. It puts the shortest measure first, and short measures are mostly noise: on any given day shares can go either way, while over years they have tended to rise, as market crashes and recovery times shows. Kavya’s fall for the month was real, but it described a month, not three years of saving.
Economists have a name for what that does to people. In 1995 Shlomo Benartzi and Richard Thaler argued that investors feel a loss more sharply than an equal gain and also look at their results often, and that this combination, which they called myopic loss aversion, explains why people demand so much extra return for holding shares. The figures fitted best if investors judged their portfolios about once a year12.
Two years later Thaler, Amos Tversky, Daniel Kahneman and Alan Schwartz tested it. Participants chose how much to put in a riskier, higher-earning option and a safer one, and some were shown their results far more often than others. Those given the most frequent feedback took the least risk and ended up earning the least13. Nobody told them to be cautious; seeing the losses more often was enough.
Real money shows the same pattern. Morningstar’s Mind the Gap study compares what US funds and ETFs returned with what the money in them actually earned, once the timing and size of purchases and sales is counted. Over the ten years to 2025 investors earned 8.7% a year against 9.9% for their funds, a gap of 1.2 points; the gap was about 0.4 points in the least volatile funds and about 2.1 points in the most volatile4. Morningstar cautions that the gap is not necessarily a measure of bad timing, but the pattern fits the experiment: the funds whose prices move most are where investors’ results fall furthest behind. Our article on the biases that cost investors takes them one by one.
Four numbers that describe the same money
A tracking app can show four different returns for one portfolio, and they answer four different questions. Here is what each means, using Kavya and Rohan’s figures. Their SIPs total ₹25,000 a month for 36 months, ₹9,00,000 in all, and the funds are worth ₹10,20,000 today. Rohan’s US shares cost $4,000 a year ago at an illustrative ₹84 to the dollar, or ₹3,36,000; they are worth $4,400 now, at about ₹96, close to the rate reported in mid-October5, which is ₹4,22,400. So they have put in ₹12,36,000 and hold ₹14,42,400.
Day or month change: how much prices moved over a short window. Kavya’s −4% for the month is this; 4% of what they hold now is ₹57,696. It is about the market and says nothing about whether their plan is working14.
Absolute return: gain over money put in. ₹14,42,400 less ₹12,36,000 is a gain of ₹2,06,400, or 16.7%. True, but it ignores time: 16.7% in one year is excellent, in ten it is poor14.
CAGR (compound annual growth rate): the steady yearly rate that turns one starting sum into one ending sum. It is right for a single lump sum, such as the US shares. Applied to the whole portfolio as if ₹12,36,000 had gone in three years ago, it gives about 5.3% a year, which understates the return, because most of that money went in much more recently14.
XIRR (extended internal rate of return): the one yearly rate that, applied to every amount from the day it went in, adds up to today’s value. It counts each SIP instalment for exactly as long as it has been invested. For Kavya and Rohan it is about 11.4% a year14,15.
One illustrative portfolio, four ways of measuring it.
Illustrative: the household in this article. The month figure is a short window of prices; the absolute return has no time in it; the CAGR treats three years of SIPs as one early lump sum; the XIRR counts when each payment went in. The figures in this chart
Kavya and Rohan
Change this month
−4.0%
Absolute return
16.7%
CAGR, as one lump sum
5.3%
XIRR
11.4%
The XIRR, worked step by step
An XIRR sounds like something only software can do, but the idea is a guess, a check and a better guess. Each payment is grown at a trial rate for as long as it has been invested, the results are added up, and the total is compared with what the portfolio is worth. If the total comes out too low, the trial rate is too low; if it comes out too high, the rate is too high16. To keep the arithmetic readable we measure time in months; a real XIRR counts days, and gives almost the same answer.
List every amount and when it went in. 36 SIP instalments of ₹25,000, the oldest 36 months ago and the newest one month ago, and ₹3,36,000 of US shares bought 12 months ago16.
Note what it is all worth today. ₹10,20,000 in the funds plus ₹4,22,400 in the US shares, ₹14,42,40016.
Try a rate. At 10% a year, the oldest instalment would be worth ₹25,000 × 1.10³, about ₹33,275, and the newest about ₹25,199. Adding all 37 amounts grown this way gives ₹14,15,604, less than ₹14,42,400, so the true rate is higher than 10%16.
Try again. At 12% the same sum is ₹14,53,302, more than the portfolio is worth, so the rate is lower than 12%16.
Narrow it down. Halving the gap between the two guesses a few times settles at about 11.4% a year. That is Kavya and Rohan’s XIRR: what their money has earned, each rupee counted from the day it was invested16.
Illustrative household; time measured in months. The rate at which the payments grow to exactly what the portfolio is worth is the XIRR. 16
Trial rate a year
All 37 payments grown to today
Against today’s ₹14,42,400
6%
₹13,42,004
Too low: try higher
8%
₹13,78,507
Too low: try higher
10%
₹14,15,604
Too low: try higher
12%
₹14,53,302
Too high: try lower
11.4%
₹14,42,400
Equal: this is the XIRR
Now hold the two numbers side by side. The month says −4%. The XIRR says their money has earned about 11.4% a year over three years, and that is after the September fall, which is already inside today’s ₹14,42,40016. The fall is real, and it is also a small part of a longer story. A bad month lowers the XIRR a little; it does not turn it negative unless the fall is larger than everything earned before it.
There is a lesson in the funds alone too. Without the US shares, the two SIPs’ XIRR is about 8.3% a year: ₹9,00,000 in, ₹10,20,000 now16. A three-year SIP that has just lived through the NIFTY’s weakest September since 20187 still shows a gain, and the instalments bought during the fall bought more units at lower prices. Our article on SIPs and lump sums explains why steady buying makes falls less frightening than they look.
The currency inside your foreign shares
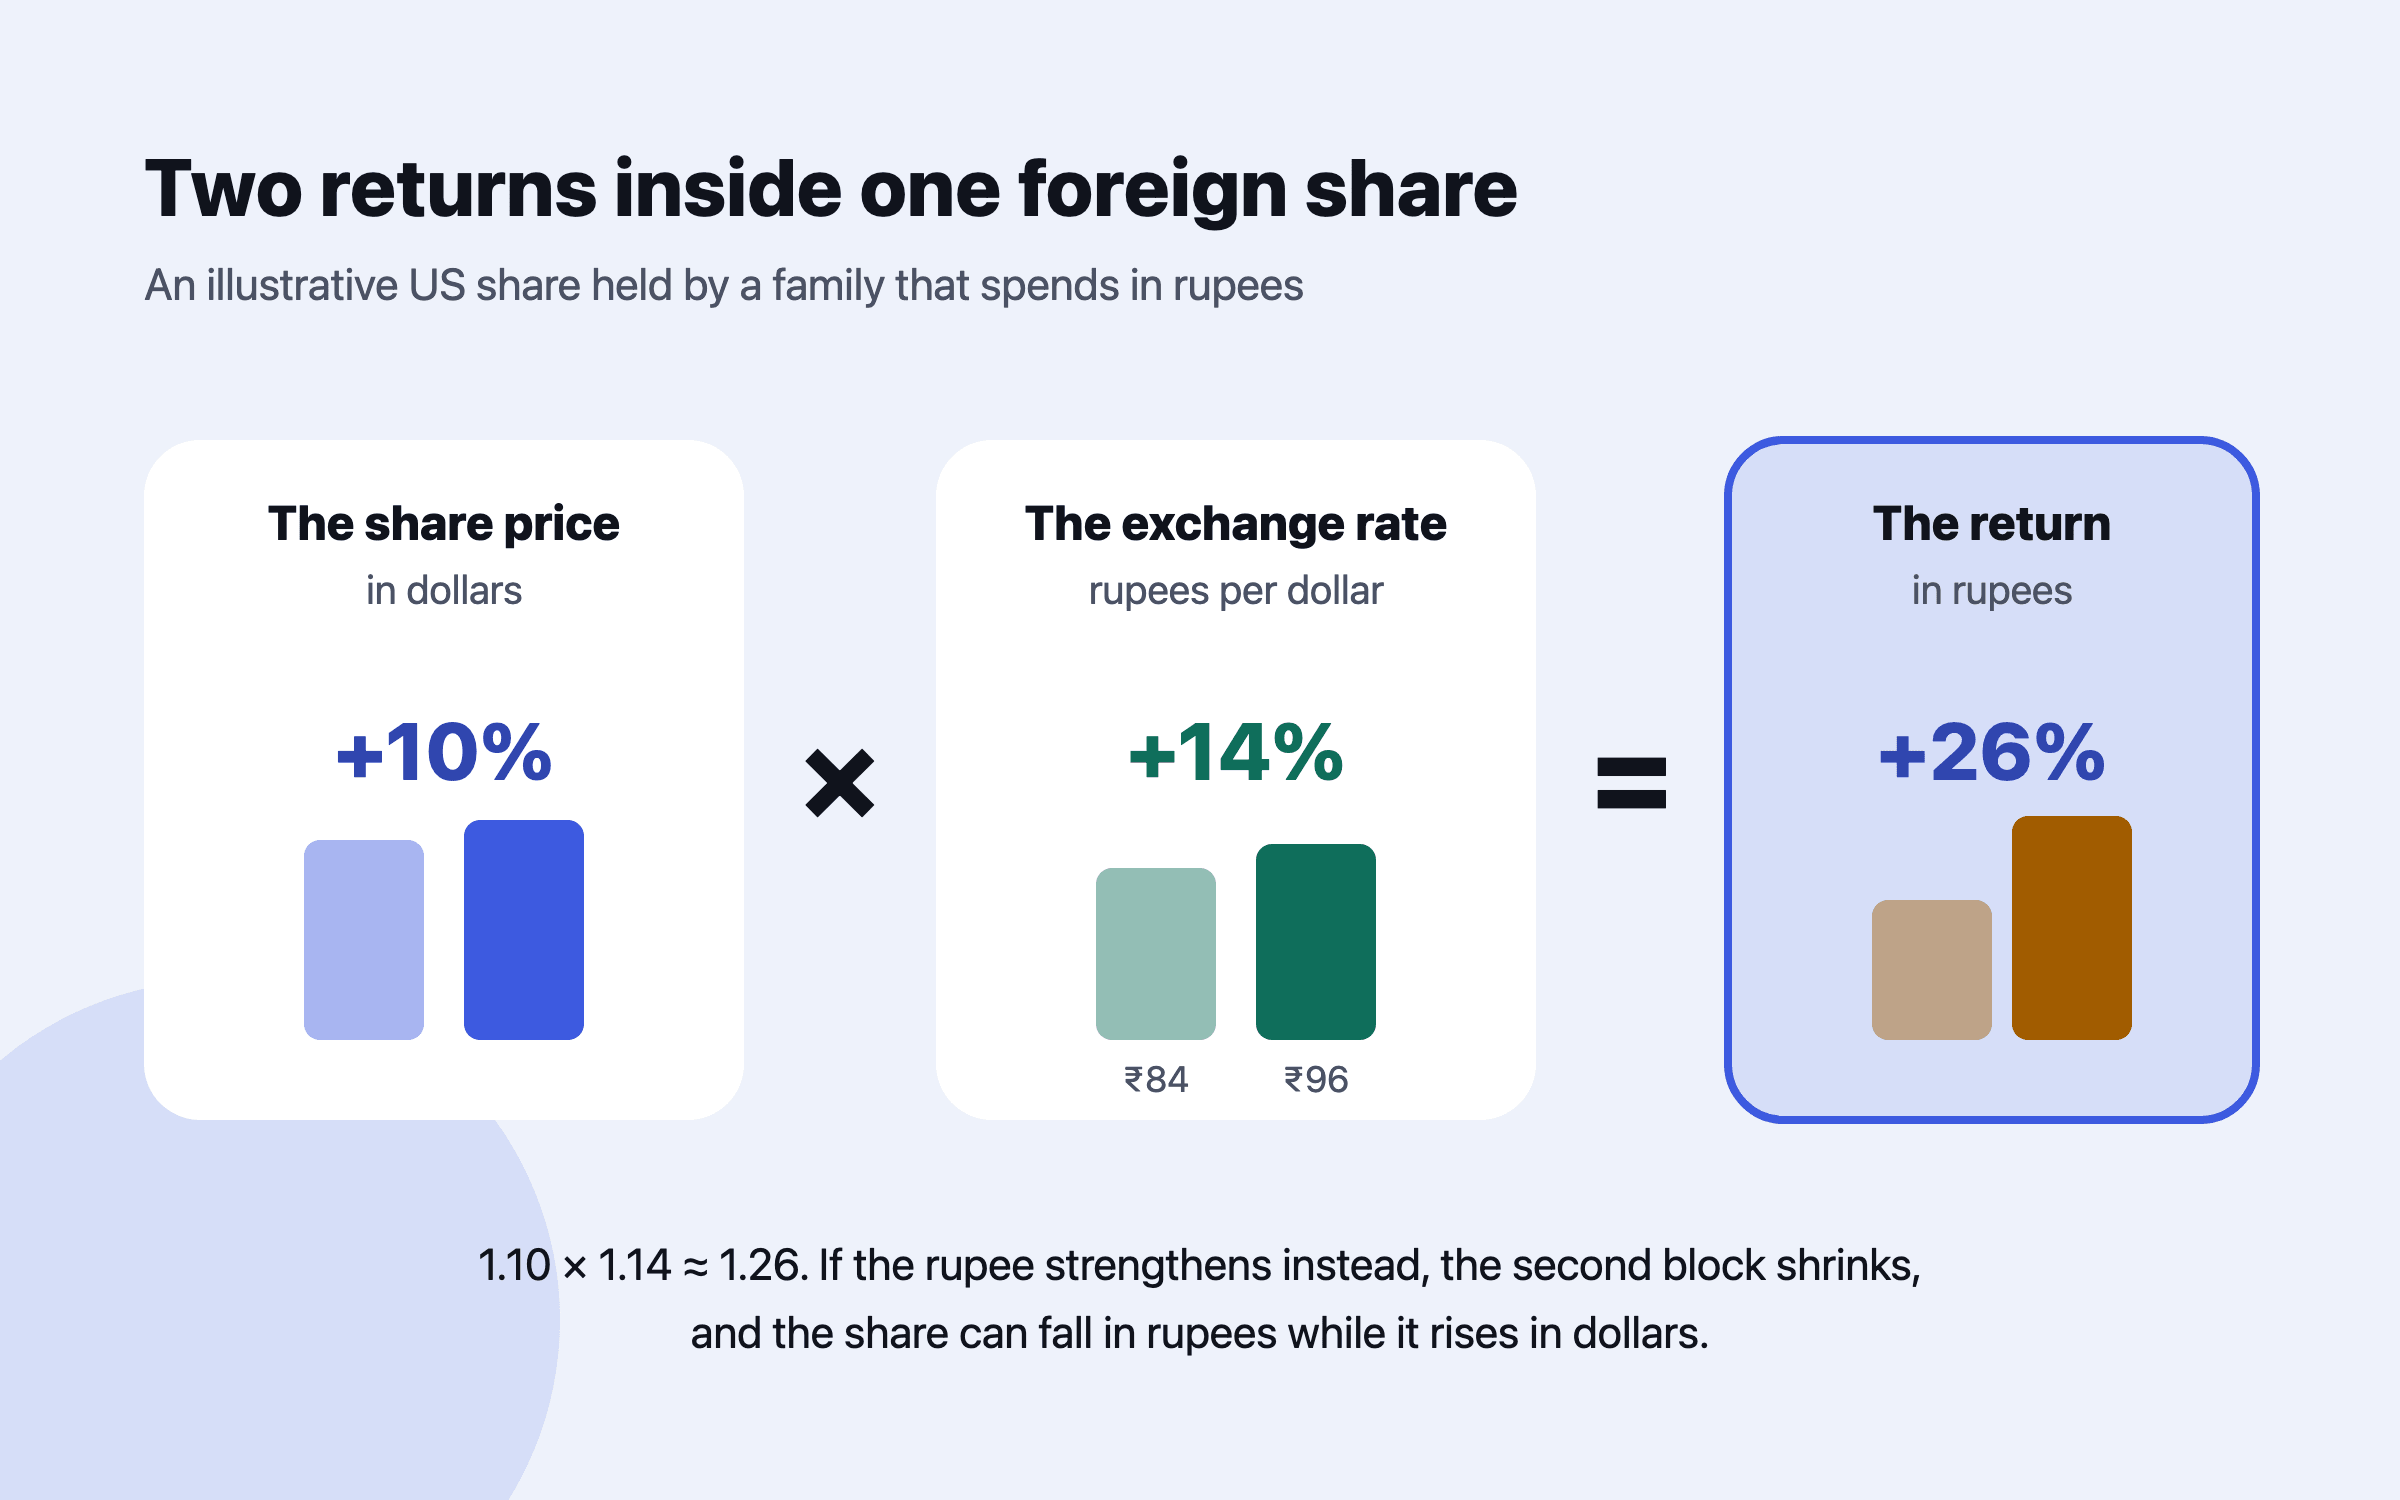
Rohan’s US shares rose 10% in dollars, from $4,000 to $4,400. In rupees they rose 25.7%, from ₹3,36,000 to ₹4,22,400. The difference is the rupee: in this example a dollar went from ₹84 to ₹96, which on its own adds 14.3%, and the two multiply, 1.10 × 1.143 = 1.25716. In a month when the rupee was close to its record low against the dollar8, a rupee-based family’s US shares did better in rupees than in dollars.
A foreign holding carries two returns: what the share did in its own currency, and what that currency did against yours. Either can be the larger, and either can reverse.
It runs the other way as well. If the rupee recovers, the same shares can fall in rupees while rising in dollars, and the day change on a US holding mixes both. The rupee strengthened by about 1% on 12 October alone, from ₹96.73 to ₹95.76, after the RBI’s measures5; a family holding US shares saw that day as a small loss even if the shares did not move. So look at a foreign holding in the currency you finally spend in, and know which part of a move was the market and which the exchange rate. Home bias and currency risk covers why owning some foreign shares is still worth it.
A tracking routine that keeps you calm
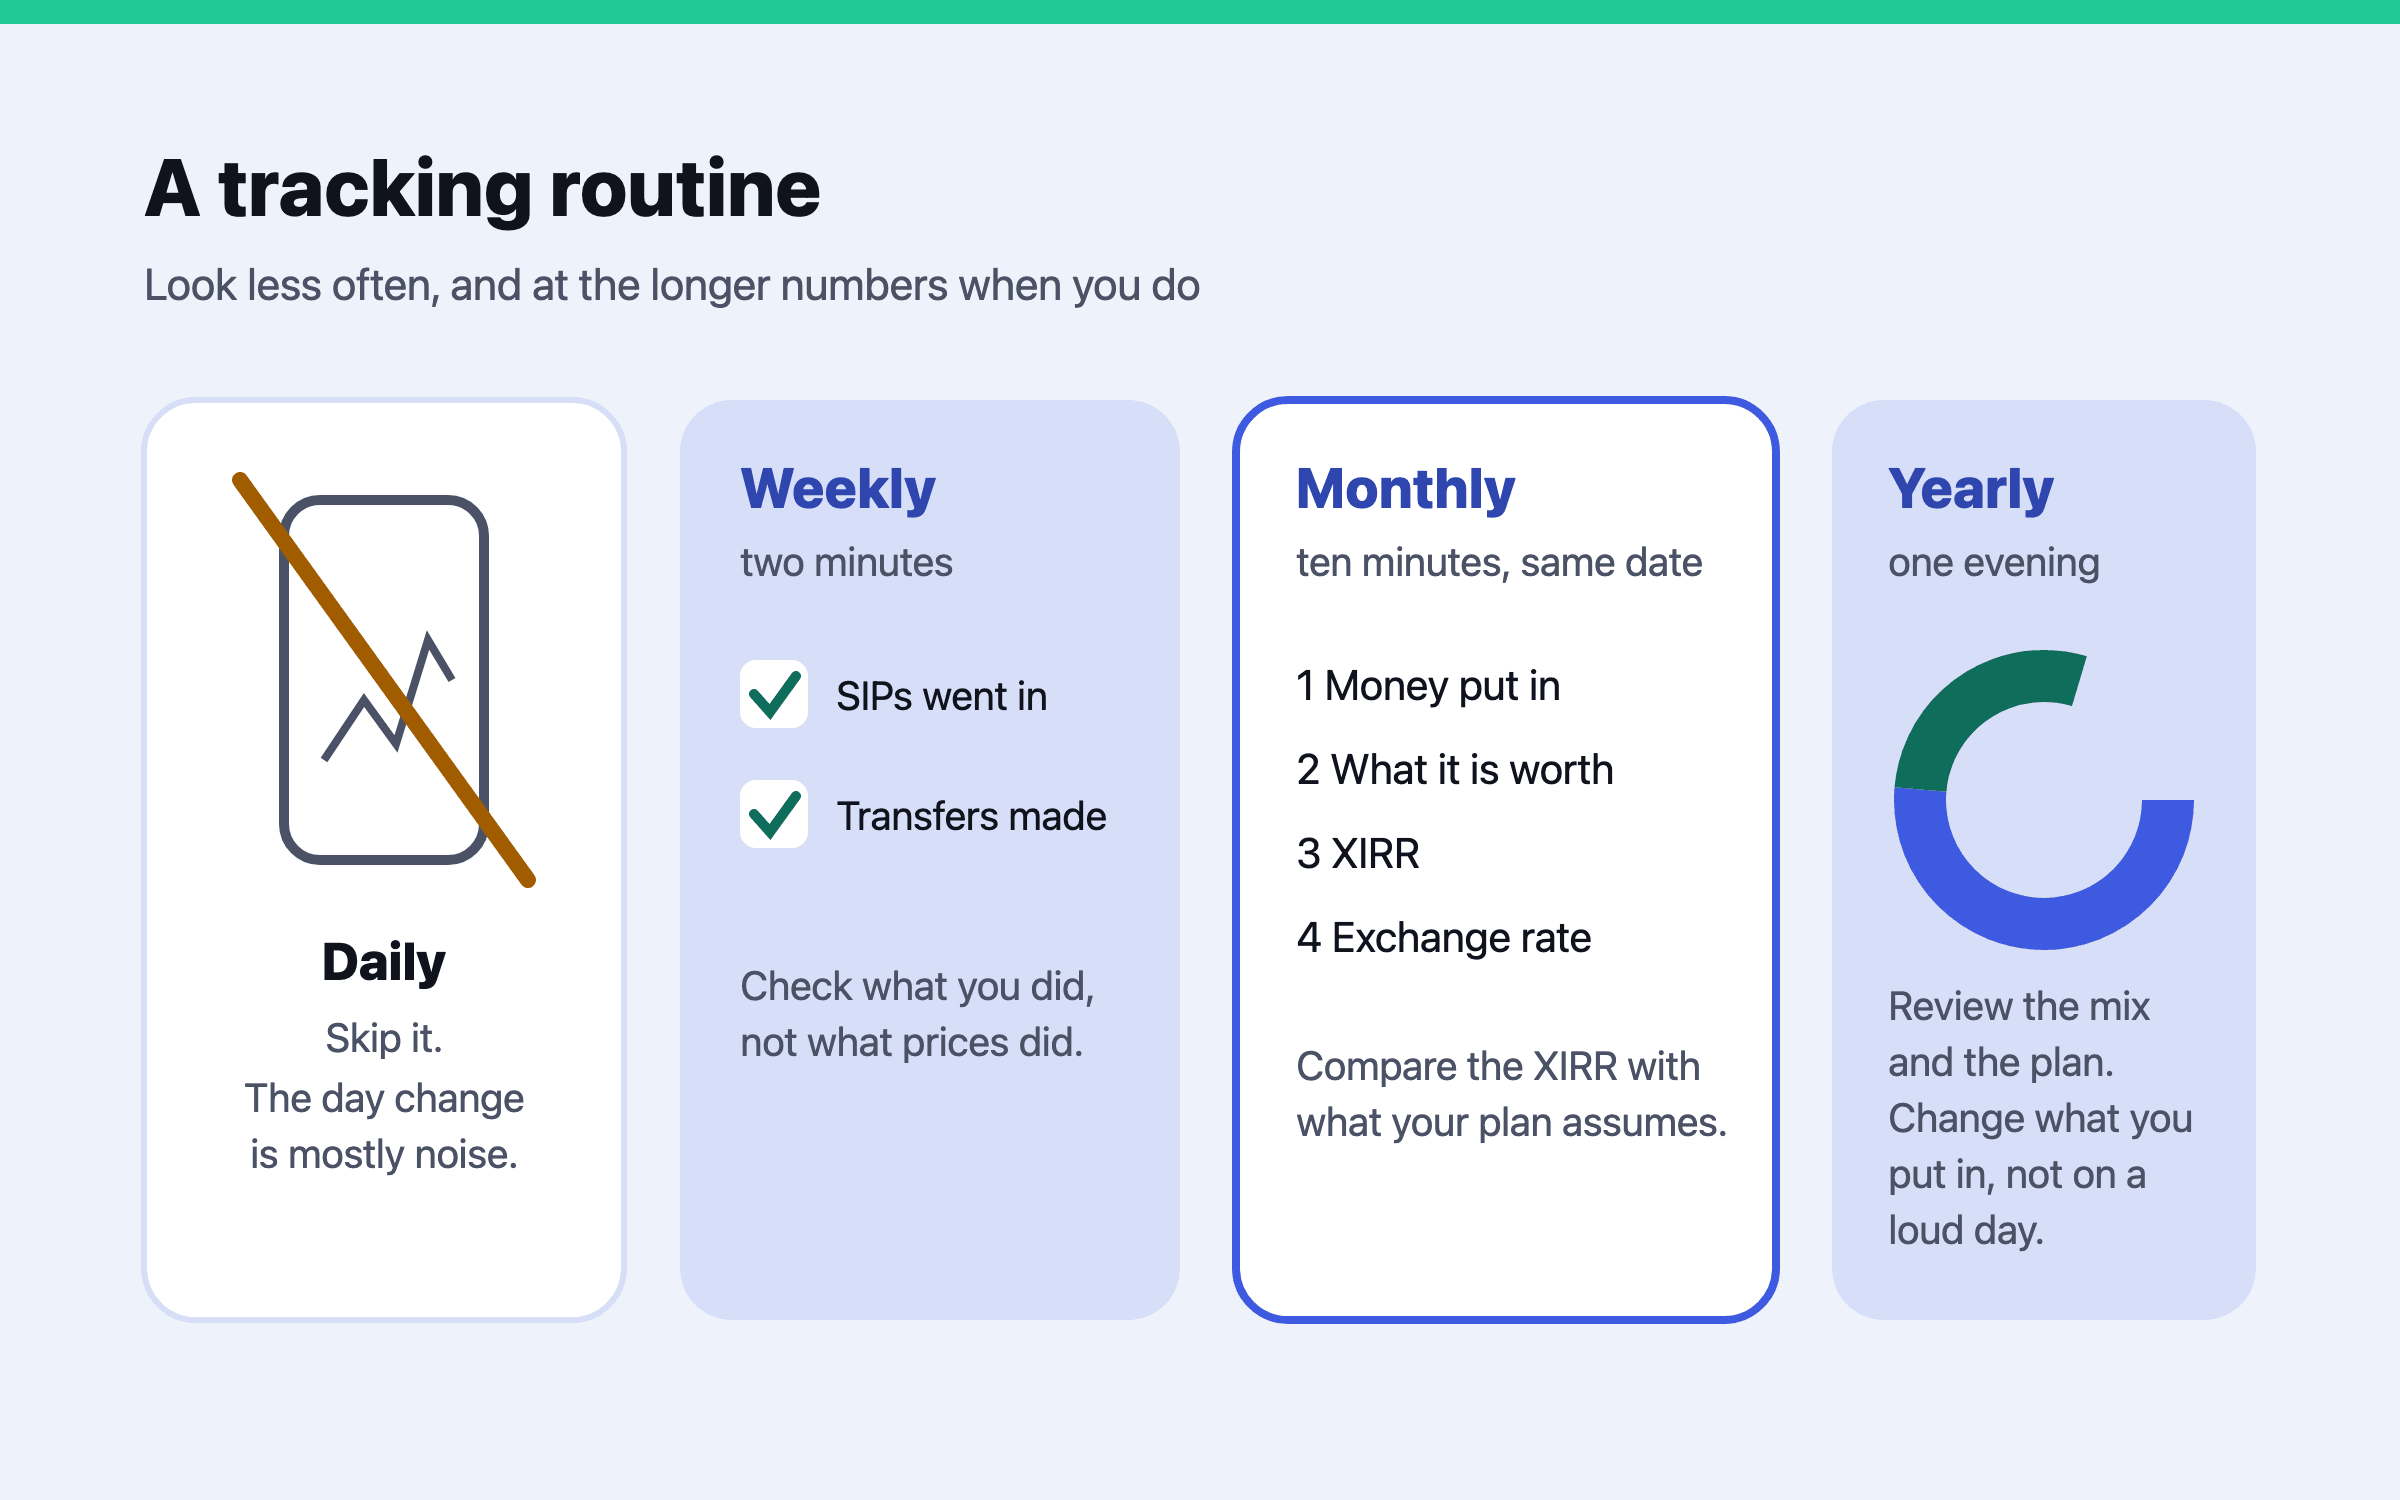
The research suggests a simple rule: look less often than you are tempted to, and look at the longer numbers when you do13. Here is the routine Kavya and Rohan settled on after October.
The routine: a quick weekly check of what you did, a monthly look at what your money has earned, a yearly review of the plan. The daily change is left out on purpose.
Weekly, two minutes: confirm the SIPs and any transfers went through. That is the part you control. Do not read the day change.
Monthly, ten minutes, on a fixed date: write down three figures: what you have put in, what it is worth, and the XIRR. Note whether the XIRR is above or below the return your plan assumes. A single month below it is not a signal; a year below it is worth a conversation.
Monthly, for foreign holdings: note the exchange rate beside the value, so you can see later how much of a change was currency.
Yearly: check the mix of shares, bonds, deposits and gold against what your plan needs, and change contributions rather than react to prices.
On a loud day: make no decision until the next scheduled look. If you still want to act then, write down why, and agree it with your partner first.
What to ignore: the day change, red and green arrows on single holdings, “market wipes out ₹X lakh crore” headlines, and any comparison with a friend’s best stock. What to watch: whether you are still putting money in, whether the XIRR is close to what your plan needs, and whether any of this money is needed in the next few years, because money needed soon is usually kept out of shares. On 12 October Kavya felt the market had decided something about her family; by the 16th, when the NIFTY closed at 23,146.1511, it had decided nothing. Her XIRR had barely moved in either direction.
If a fall does make you wonder whether you can stay invested, that is a question about your plan, not about the market. How long markets have taken to recover from past falls is set out in our article on crashes and recoveries. The honest test is whether your plan still works if prices stay low for a few years, and that is something you can check once rather than worry about nightly.
How Nivritee helps
Questions people ask
What is the difference between XIRR and CAGR?
CAGR is the steady yearly growth from one starting sum to one ending sum, so it suits a single lump sum. XIRR counts every payment from the day it was made, so it is the right measure for SIPs and for any portfolio with money added or taken out at different times14.
Why is my SIP showing negative returns?
Usually because the recent instalments were bought at higher prices than today’s and a fall has pulled the whole value below what you put in. In September 2026, for example, the NIFTY 50 fell 6.06%1. Instalments made during a fall buy more units, which is what tends to lift the return when prices recover.
How often should I check my portfolio?
Monthly is enough for most families, with a fuller review once a year. In a well-known experiment, people shown their results most often took the least risk and earned the least13.
My portfolio is down this month. Should I sell?
A month’s change describes the market, not your plan. Check your XIRR and whether you need the money soon. Over the ten years to 2025 the money in US funds and ETFs earned 8.7% a year against 9.9% for the funds themselves, once the timing and size of purchases and sales were counted, and the gap was widest in the most volatile funds4.
How does the rupee affect my US stocks?
Your return in rupees is the share’s return in dollars combined with the change in the rupee. When the rupee weakens, as it did towards ₹96.84 to the dollar on 7 October 20268, US shares are worth more in rupees; when it strengthens, the opposite.
Why did the Nifty fall in September 2026?
Reports pointed to foreign investors selling, high crude oil prices and worries about global technology spending; the NIFTY IT index fell 11.18% in the month1,7. Higher US interest rates after the Fed’s rise on 16 September added to the pressure6.
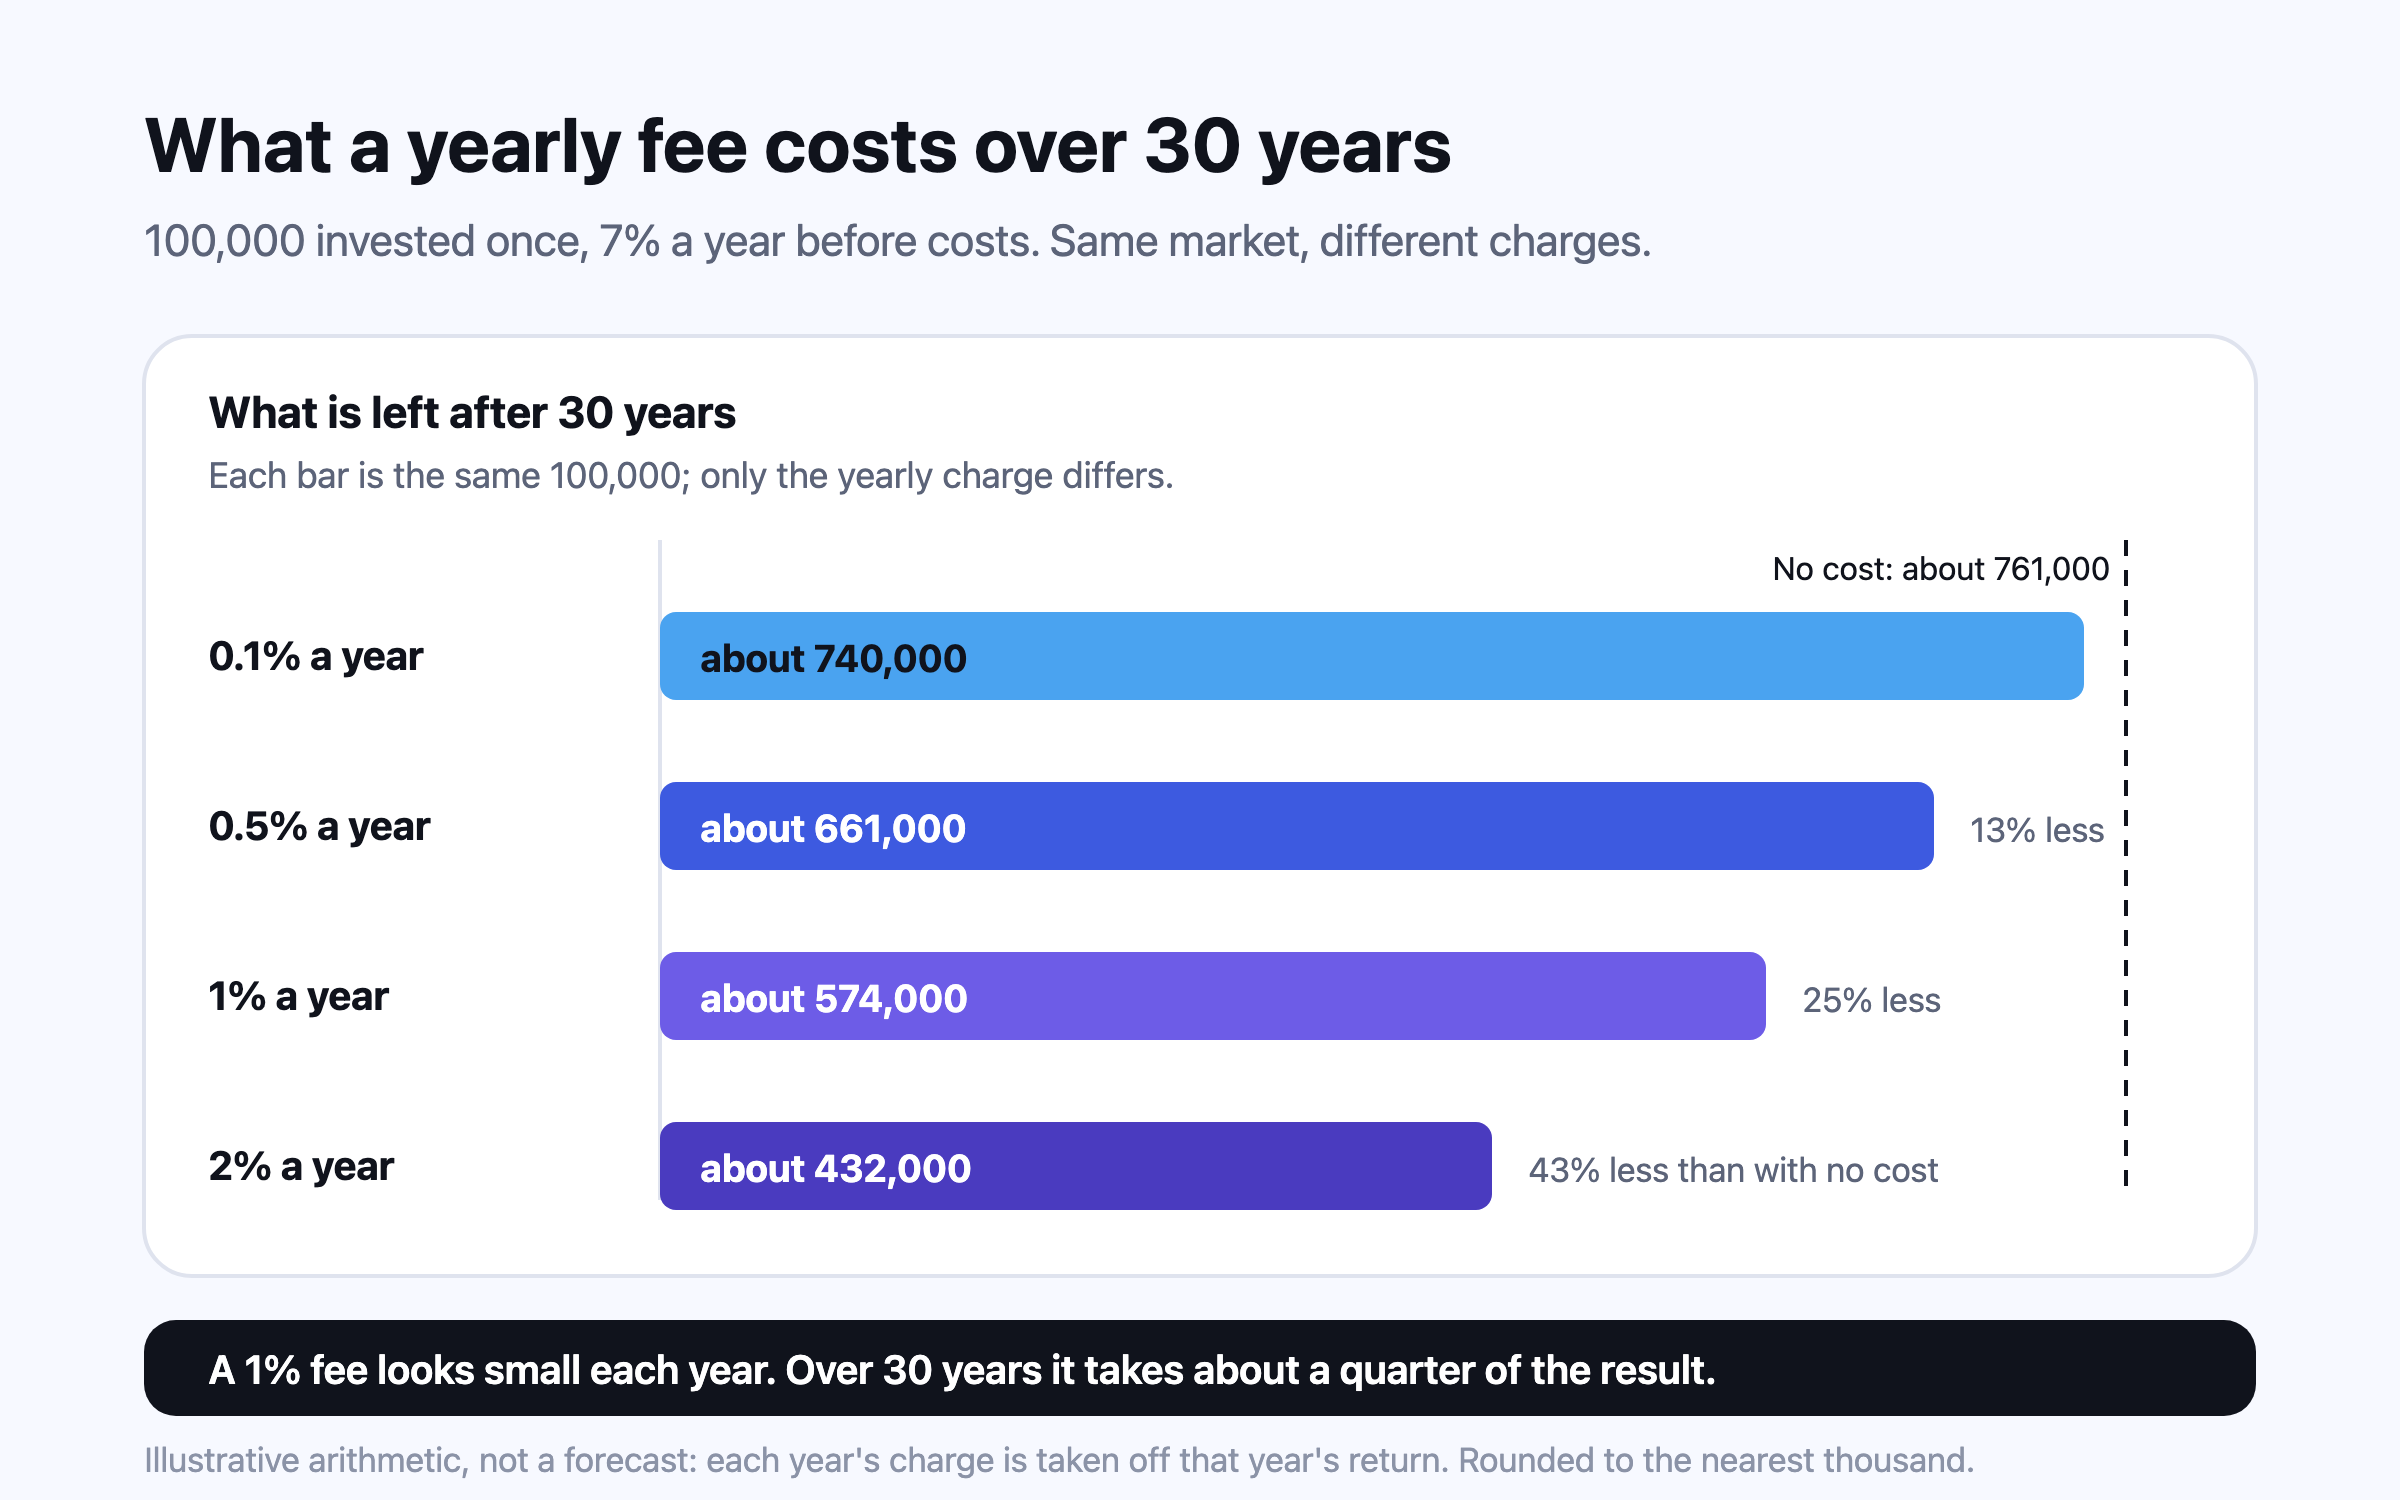
A fee is charged every year on the whole balance, so it compounds against you. On 7% a year before costs, a 1% yearly charge leaves about a quarter less after 30 years than no charge at all, and 2% leaves over 40% less. Fund costs have fallen sharply — US equity funds averaged 0.40% in 2025 against 1.04% in 1996 — but platform and adviser layers sit on top, and in India a regular plan carries a distributor’s commission that a direct plan does not.
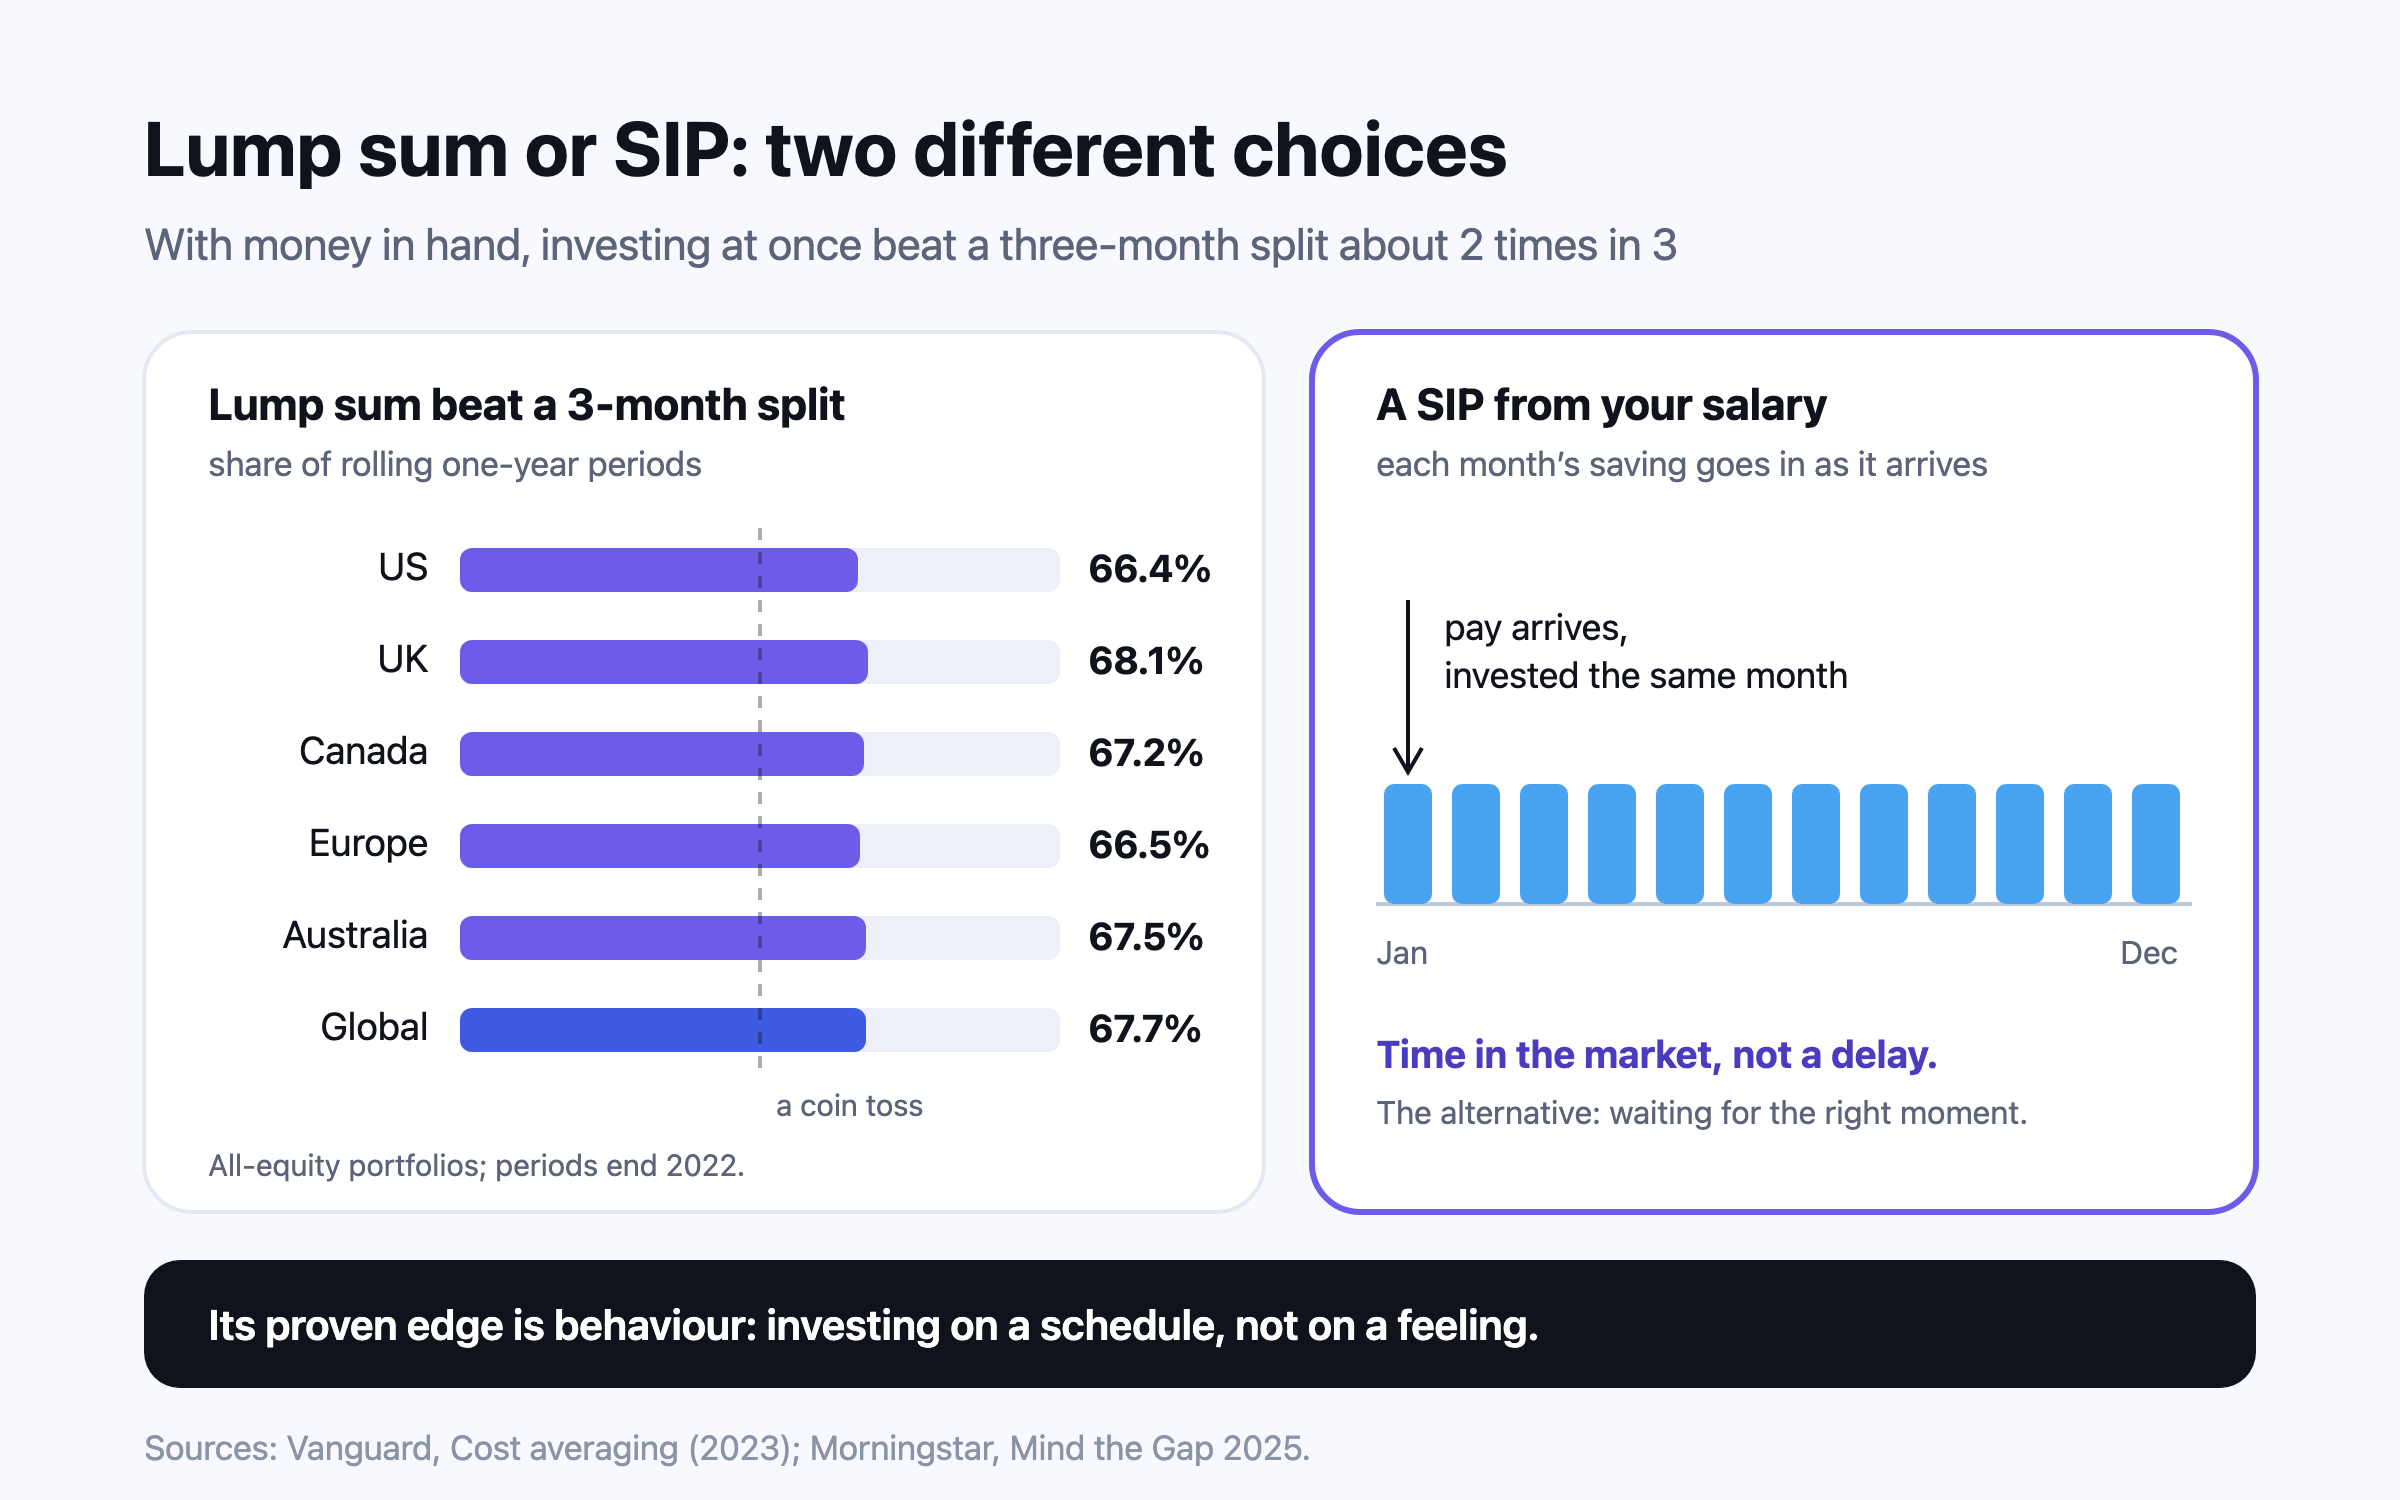
With money already in hand, investing it at once has beaten feeding it in over a few months roughly two-thirds of the time, by about 2% after a year for an all-equity portfolio, because markets rise more often than they fall. A SIP from each month’s salary is not that choice: it invests money as soon as it exists. Its real advantage is behavioural: automatic, regular investing takes the stop-start timing decisions out of investors’ hands.
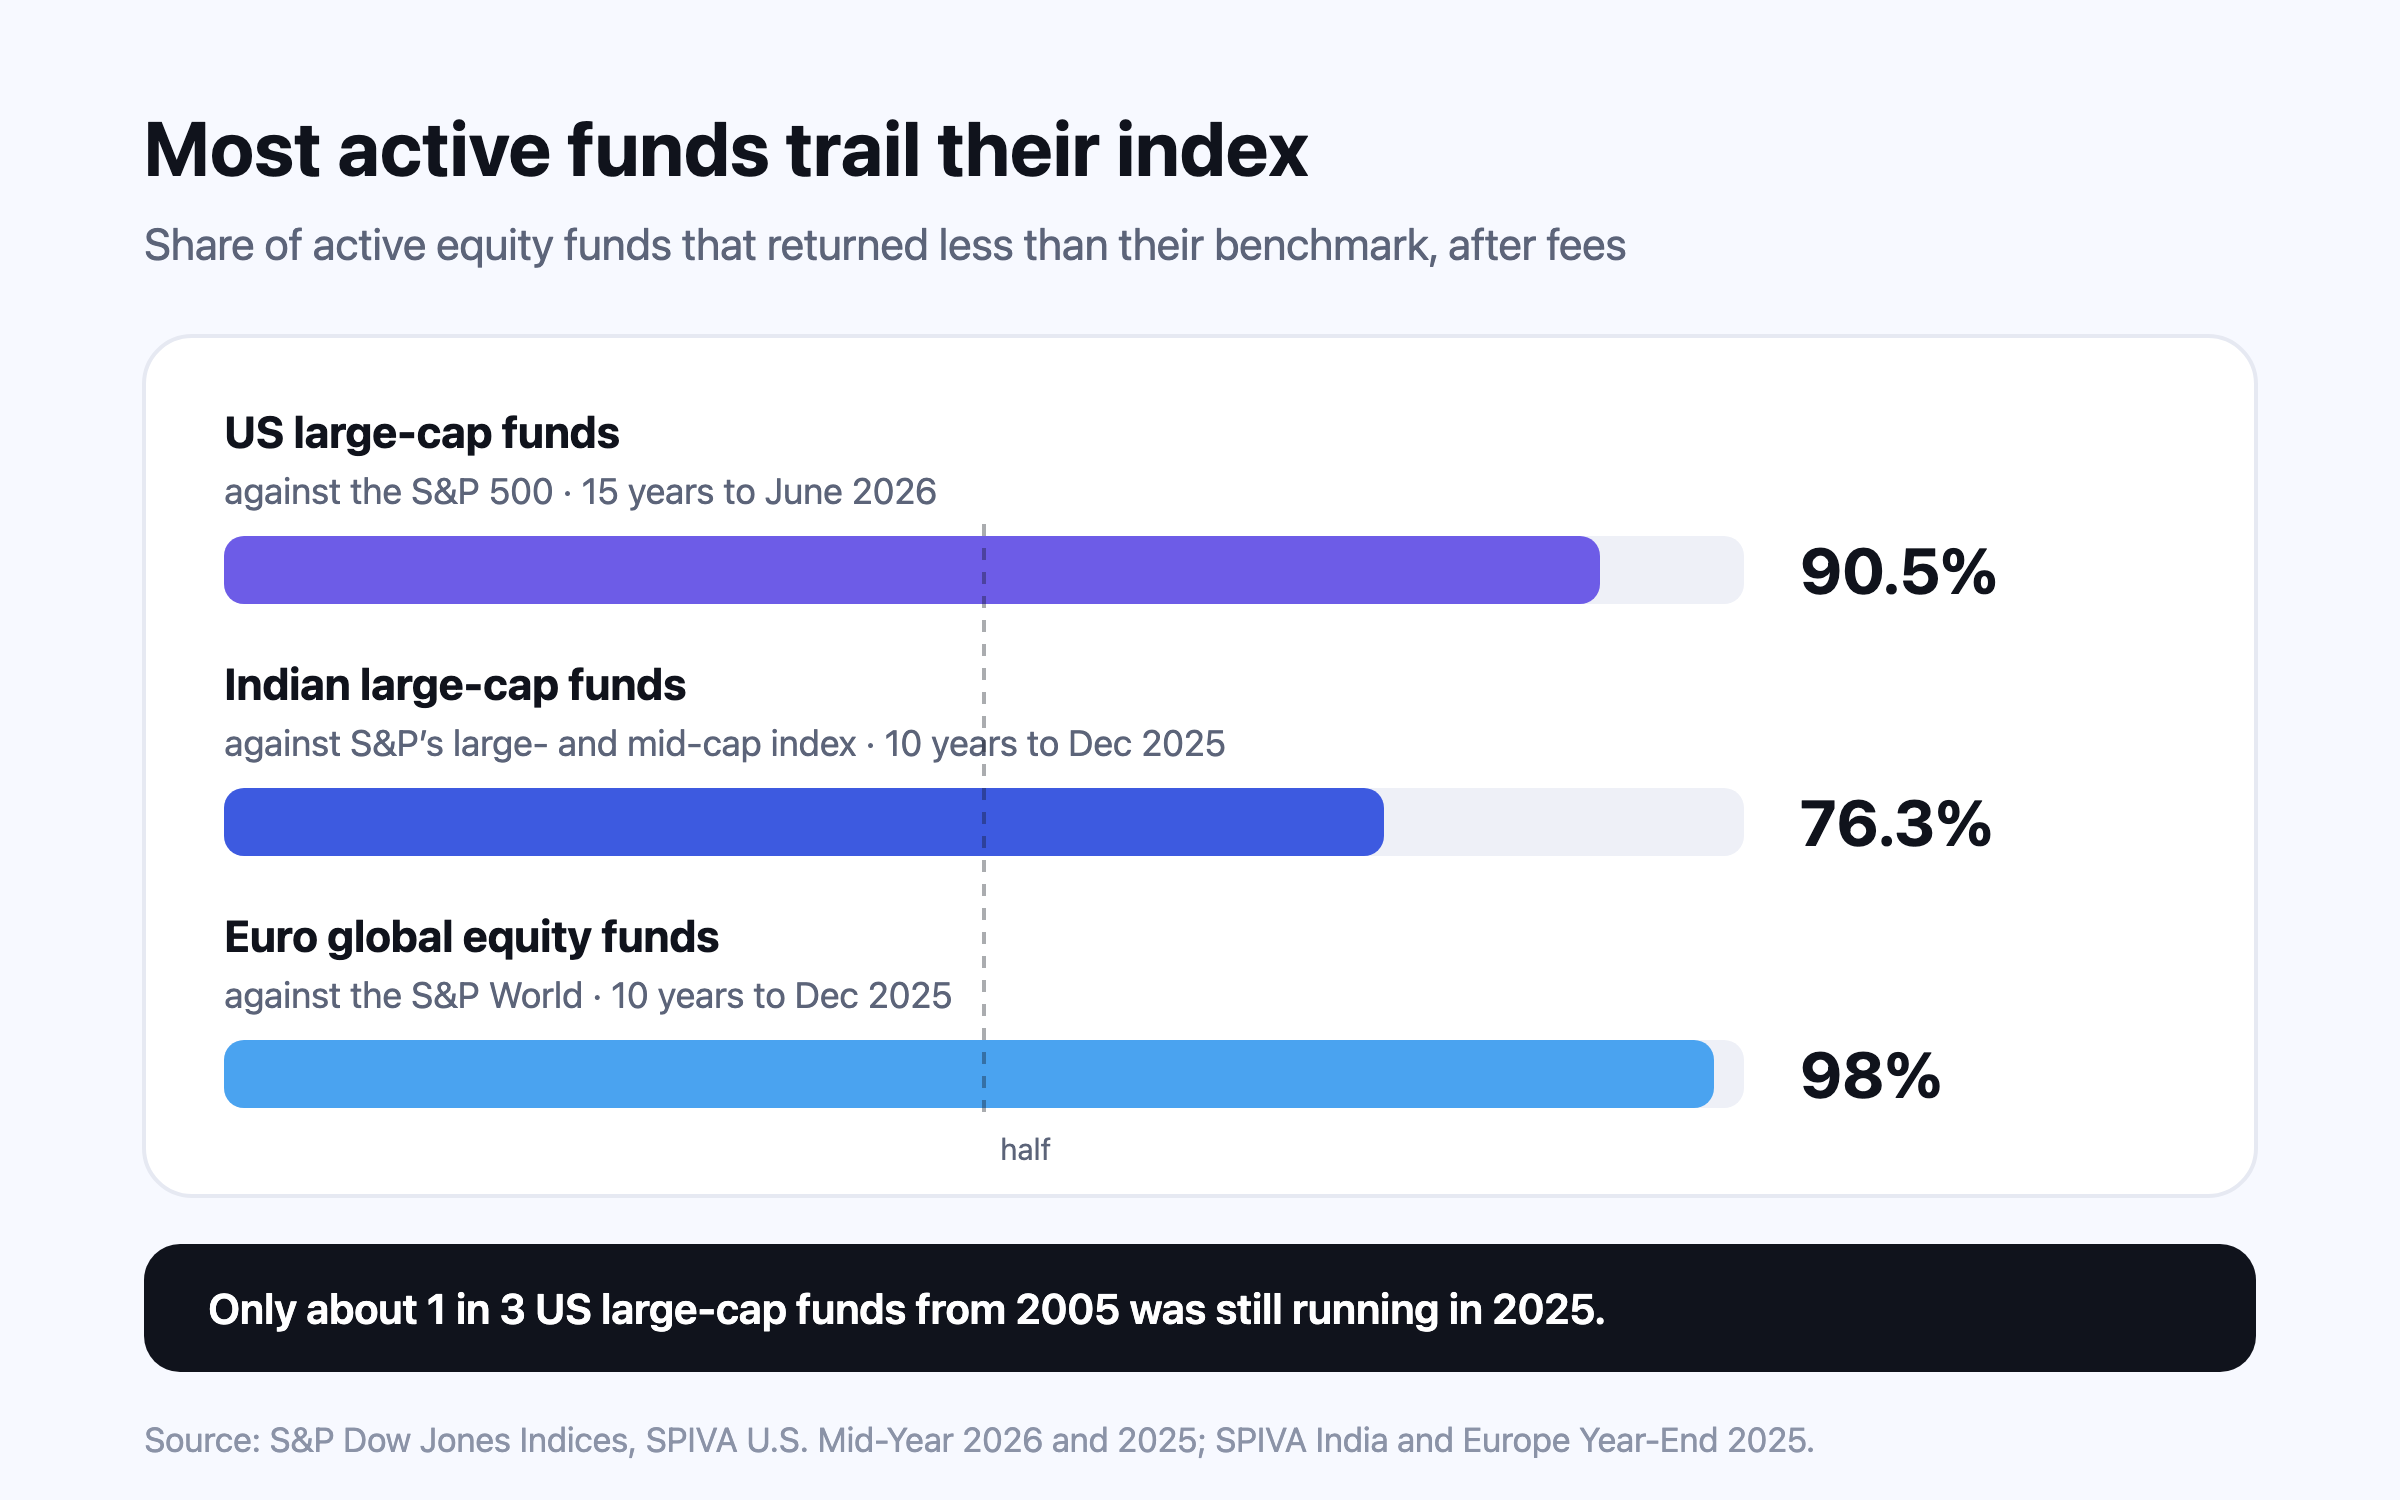
Most actively managed equity funds trail their benchmark after fees, and the share grows with time: to June 2026, 90.5% of US large-cap funds lagged the S&P 500 over 15 years. India and Europe show the same long-run pattern, with real exceptions — Indian mid- and small-cap funds had their best year against the index since 2014 in 2025. Winners rarely stay winners, and the cheapest funds succeed most often.
This is general information, not financial, tax or legal advice for your circumstances. Rules and figures change; check the official source for your country, and consult a licensed professional before making financial decisions. Projections are estimates, not predictions.